© 2018, IRJET | Impact Factor value: 6.171 | ISO 9001:2008 Certified Journal | Page 2441
Density Based Smart Traffic Light Control System and Emergency
Vehicle Detection Based On Image Processing
Miss. Gaurita R. Choukekar
1, Mr. Akshay G. Bhosale
21
Student, electronic Department, the Sanjay Ghodawat University, Atigre, Kolhapur
2
Asst. Prof., Electronic Department, the Sanjay Ghodawat University, Atigre, Kolhapur
---***---Abstract -
Traffic management is becoming one of the mostimportant issues now a day due to the rapidly growing of urban population due to these; the number of vehicles on the road is increasing rapidly. Due to these the need of controlling streets, highways and roads become the major issue. Due to this problem of proper traffic management, there is a need for advanced technology and equipment to improve the state-of-the-art of traffic control. Today's traffic management systems are not based on the live scenario, which leads insufficient traffic management. There is a need for developing self-adaptive system helps for better traffic management and helps to reduce the problem.
This paper represents the method that can be implemented by using mat lab software and its aim to prevent heavy traffic congestion. A web camera is placed in a traffic lane that will capture the images on the road these reference image and capture real-time images are compared. Images are effectively processed to know the traffic density; According to the processed data from mat lab, the controller will send a command to the timer show the particular time on the signal to manage traffic. Using this information obtained the development of Android application will be done; User can get the information of traffic density of particular location. The emergency vehicle detection such as ambulance, so that it can be detected easily and that lane can be given higher priority.
Key Words: Traffic Management, Traffic light control,
edge detection, Traffic density count, ATMEGA8 microcontroller, Android application, Gradient magnitude and direct subtraction method, Emergency vehicle detection.1. INTRODUCTION
Fast transportation system and rapid transit system are important for economic development of any nation. Mismanagement and traffic congestion results in wastage of time, loss of fuel and money, there is a need for fast, efficient and economical traffic management system. The monitoring and controlling traffic becomes a major problem nowadays. The numbers of users are increasing day by days due to this proper management is being required and there is a need for smart traffic control system. To have proper traffic management there are several techniques are available. But no technique is perfect itself as the real-time situation is continuously changing and the no system is suitable to adopt the change continuously.
There is two standard traffic control system such as 1) manual controlling: It requires manpower to control the traffic. Traffic police are allocated to that particular area and he will carry the signboard, sign light, Whistle.2) automatic controlling: Controlled by the timers and electronic sensors. The sensor detects the availability of the vehicle and according to that the timers are adjusted. But it has too many drawbacks not adaptable and not an efficient system. [4]
We proposed a system for controlling density based smart traffic light control system in these is aims are to achieve goals:
Distinguish presence and absence of vehicles in capture road image.
Signal traffic light goes red when the road is empty.
Signal the traffic light go green accordingly to the density of the vehicle and the duration of green light adjusted based on calculation.
This proposed system can be done by using mat lab software and aim to have proper traffic management. The camera is installed in the particular area where all the lanes are visible just above the traffic light. The film comes in the form of consecutive frames and each frame is compared with the first frame from which the density of car specified, further, the number of vehicles are displayed on the screen. According to that traffic control algorithm is used to display the allocation time. Accordingly, the green light adjusted.
Then the use of emergency vehicle detection is made which helps to detect the ambulance and the emergency vehicle accordingly the lane is given higher priority. These are passed on the hardware which is consists of ATMEGA 8 microcontroller for controlling traffic light and USART module for sending control information to the microcontroller. According to that, the traffic signal is being controlled.
Using the information of traffic density is passed on the android application user can select the location as per his choice. It gives various locations along with the traffic status. This status provided information can use to choose the particular location to the destination. This application is easy and no extra cost is required.
© 2018, IRJET | Impact Factor value: 6.171 | ISO 9001:2008 Certified Journal | Page 2442 contours.2) a good location guarantee ensures .3) for a
contour there will be only one edge detection avoid the effects of rebounds. [9]
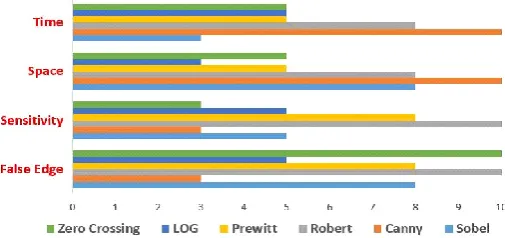
As per stated in [7], Here these shows the comparison between different edge detection technique such as zero crossing, Prewitt, LOG, Robert, canny and Sobel. The Canny edge detector is better than other techniques due to its higher accuracy in detection of an object with higher entropy, PSNR (Peak Signal to Noise Ratio), MSE (Mean Square Error) and better execution time. It's having better overall performance as compared to other techniques.
Fig -1: Comparative analysis of distinct edge detection technique
.
2. LITERATURE REVIEW:
Automatic traffic monitoring system and traffic surveillance are important for road usage and better traffic control. There are various methods are available for traffic management, because it has become serious issues nowadays. There are various techniques are available using different sensors, RFIDs tags etc. Out of all these techniques, the image processing technique is better because it's having its own computer visions, adaptable to the particular environment. Low cost and avoids the distortion and provides the accurate output and helps to control the traffic light time limit, depending on the density of the vehicles.
As per [1], the image is acquired by using the web camera and furthers it goes through the four stages such as image acquisition, RGB to grayscale conversion, Image enhancement, and image matching technique. Here the reference image is compared with the captured image and it goes through the different technique. In these RGB to the grayscale conversion of these two images are done further the binary conversion is made. Than gamma correction to remove the error and the edge detection technique using Prewitt edge detection technique. These two images are matched using image matching technique and further the percentage of image matching is used, to indicate the time allocation of a traffic light. In [2] the new technique is used to see the status of the traffic over the android application. When the count of the vehicles are detected these are passed over the server its updates status as high traffic or medium traffic or small traffic. A new application user is required to update the information during login into the application.
Then the application returns the various locations and update of the new location is also available. The user can use the status provided by the server to update the alternative paths to the destination. In [3] the input is taken via the camera of the reference image and the real-time image is passed through the grayscale conversion. Further, the grayscale converted reference image is cropped and is multiplied using the real-time image and the required area is only considered. Then the binary conversion is done the traffic density is detected by making the bounding box property the accurate number of vehicles can be detected. In order to deal with the noise added in different lighting condition at different times of a day, the set of the reference image is captured and stored accordingly different time slots of a day. The system cycles these reference image accordingly the current set of the day.
[image:2.595.38.291.231.350.2]© 2018, IRJET | Impact Factor value: 6.171 | ISO 9001:2008 Certified Journal | Page 2443 Gaussian noise filter is used to eliminate the noise. Further,
the use of canny edge detection is applied, the white point is count. Accordingly, the percentage matching and the time allocation is done. Further, these are implemented using the hardware in which the four ways traffic intersection model is designed. These four ways intersection model is consists of four arrays of LEDs with each array having red and green light. Python programming language is used for image processing and Arduino development board is used for controlling the LEDs. In [8] the image is captured by using camera than its converted into a grayscale image. The grayscale image is converted into the threshold image. The edge detection method using canny edge detector. On which the contour has been drawn in order to calculate the vehicle count. The vehicles are boxed to find the count, the output screen in the command prompt to display the vehicle count. Density measurement is implemented by using OpenCV software for image processing, by just displaying the various conversion of the image on the screen. Finally surrounding the box on the vehicle in the given image. The number of vehicles counted and the density of the vehicle is counted by using mat lab. In [9] the density of the vehicle count is done by using the video and the image. Overview of vehicle detection and counting system consists of the input frame, segmentation, and detection, tracking, and counting. In these we have used vehicle detection using image processing consists of the input image, Converting RGB to gray, Convert to binary, Edge detection, Image enhancement, Labeling the detected region, Vehicle tracking and vehicle counting.
3. PROPOSED SYSTEM
3.1. The architecture of the system
[image:3.595.32.288.565.743.2]In these cameras is placed at the top of the signal to have a better line of sight. Also, the clear view of the traffic on the particular side of the signal so that it will capture an image and analyzes the image and get the count of the vehicle at that particular side. This count helps to detect the density of the vehicle and accordingly the signal is adjusted. [8]
Fig -3.1: System Architecture
3.2. Traffic Information Extraction
Extracting traffic information from image, video camera is placed at an appropriate position is employed for image acquisition. Camera video stream data is processed frame by frame, to determine how much traffic is on the road. In these background subtraction method is used, here the empty road will be the background image and the subsequent frames from the video camera will be foreground image. By subtracting the background image from foreground image we can find the traffic density of the road. These two methods are consists of gradient magnitude and another direct subtraction method. As per stated in [6].
A. Gradient Magnitude
1. RGB to the grayscale image
In this, both background and foreground image is converted to RGB to a grayscale image. It's having superior signal to noise ratio as compared to RGB image. While doing the conversion it's good to consider RGB values of each pixel and make the output as a single value reflecting the brightness of the pixels.FGrgb to FGgray, BGrgb to BGgray.
2. Edge Detection Method
In these, the use of canny edge detector is made for both foreground and background image because as compared to detection method canny edge detector provides better overall performance. It's mainly used to outline the edges of the objects.FGp from FGgray and BGp to BGgray.
3. This processed background and foreground image are subtracted to obtain the foreground objects which show only the vehicle unnecessary area is eliminated. We obtain the object image.
Gobj = FGp - BGp
4. Filter
We need to do some noise removal to remove the noise introduced during subtraction. Here we choose wiener to filter it's having the ability to remove the additive noise and invert the blurring simultaneously. This filter is used for finding pixel-wise adaptive Wiener filtering, by using neighborhoods of a size which you wish. Here its consider as 6*6 to estimate the local image mean and standard deviation. Before filtering we try to reduce small intensity pixels of all the value.
Gfilt = {Gtuned if pixel value ≥0
0 else } by subtracting fixed value and then apply Wiener filter. [6]
© 2018, IRJET | Impact Factor value: 6.171 | ISO 9001:2008 Certified Journal | Page 2444 5. Morphological Operation
There are two basic operation morphological erosion and dilation. Erosion shrinks the image object while dilation expands them. Erosion helps to decreases the size of objects and removes small anomalies by subtracting the object, which has a smaller radius than that of the structuring element. Erosion (ʘ) when we use the small structuring elements of a size such as 2* 2 etc. These shrink that image by removing away a layer of pixels from both the inner and outer boundaries of the regions. The holes and the gaps in the structuring element become larger and the small pixels are eliminated. Also with the case of large structuring element goes with the similar way as that of the smaller structuring element. Erosion helps to remove the small unnecessary pixels from the binary image but simultaneously reduces the region of interest. Dilation (Ɵ) is used to increase the size of the objects by filing the holes broken areas and connecting areas separated by spaces smaller than the size of structuring element. It mostly used to connect the areas that are separated by the spaces smaller than that of the structuring element. Helps to add perimeter pixels to each image object.
These provide us the objects with a closed contour that is G closed and having structuring element represented by S.
Gclosed = Gfilt • S = (Gflit ʘ S) Ɵ S
6. Flood fill operation is performed to fill the holes in the objects with closed contours and get the image. Is applied to G closed and we get Gfilled.
7. Then obtain a binary image to enhance the binary image we required to obtain the proper threshold value than we obtain a binary image. To enhance the binary image quality we multiply it by the factor to the threshold. Is apply over Gfilled and we get G binary.
Gbinary = {1 if pixel value ≥ T × factor 0 else }
B. Direct subtraction method
1. RGB to a grayscale image of both background and foreground image.
2. Than subtraction of two images grayscale foreground and background image. We get object image as Dobj.
Dobj = FGgray - BGgray
3. Wiener filter is used to remove unwanted noise from obtained object image. We used Dobj to remove some unwanted pixel using Dtunned. After applying wiener filter we remove the noise using Dfilled.
4. Morphological operation of erosion and dilation is performed after filtering of the object image. We get Dclosed image.
5. Flood fills operation after morphological operation on the object image. Performed on Dclosed to obtain Dfiled image.
6. The binary image is obtained after flood fill operation with the proper threshold value. The Dbinary image is obtained from Dfiled without multiplied factor to the threshold.
C. Two methods together
The binary images obtained from two methods are combined to obtain a single image.
I total = Gbinary + Dbinary
I total = (1 if pixel value ≥ 1
0 else)
The number of white pixels in the obtain a single image is consequently our desired traffic density.
TD =
R and C the number of rows and columns I total.
In Direct subtraction method color of the vehicle can be problematic so it’s detected by gradient magnitude method. For example In case of black color.
In gradient magnitude method there can be a certain situation where detected edges may not from the closed contour. The lower left- hand side of the vehicle front edge cannot be detected so image fill flood operation fails and cannot be detected this problem is solved by direct subtraction method.
3.3. Vehicle Count
There are many drawbacks for algorithm search of connecting pixels due to this bounding box property is used to see the no of a vehicle on that particular lane [3]. After labeling the number of pixels of each labeled vehicle contain are counted and accordingly the vehicles are categorized as small, medium and large vehicles. To display the total no of vehicles, the number of pixels each vehicle contains, the number of vehicles falls into each category. Accordingly, the priority is assigned to the road. After comparing the number of vehicles the traffic signal control assigned the priority which lane should be given first and accordingly the time limit is assigned. [5]
For drawing the bounding box we required to see the information about every region and bring a property of connected components of the binary image. The three properties are considered eccentricity, area and bounding box.
© 2018, IRJET | Impact Factor value: 6.171 | ISO 9001:2008 Certified Journal | Page 2445 Eccentricity: the ratio of the distance between the foci of the
ellipse and its major axis length the value is between 0 and 1.
Bounding Box: These property helps to locate the vehicle by drawing the smallest rectangle containing the region specified as 1- by- Q *2 vector, where Q is the number of image dimensions.
3.4. Traffic Control Algorithm
As per stated in [6], we implement the traffic control algorithm according to the density the traffic is control. So that according to the density of the vehicle we can set accurate time limit required. We take the traffic densities of different roads at a certain time as an input, based on the taken input we produce output. Traffic Cycle (Tc) total time taken for one complete rotation of the signal light at any traffic point.
Tc = f (TD)
The denser the traffic longer is the traffic cycle vice versa, so the more vehicles can pass at the given time.
Weighted time allocation: The weight is relative to the traffic density of a particular road in a traffic junction. Weight for i – th road is
Wi =
Where Wi is the factor for i – th road, TDi is traffic density and n is the total road junction.
Time allocated (Ti) for i –th road to remain open the green signal
Ti = Tc × Wi
3.5. Hardware Implementation.
As per stated in the paper[6], We can implement the image processing by using mat lab further that data is given to the ATMEGA8 microcontroller through USART module (Universal Synchronous Asynchronous Receiver Transmitter) module for sending the information from software to microcontroller. The use of this microcontroller, because it's a low power CMOS 8- bit microcontroller based on the AVR RISC architecture. By executing powerful instructions in a single clock cycle, its achieves throughput approaching 1 MIPS per MHZ, allows the system designed to optimize the power consumption vs. processing speed.
[image:5.595.308.561.84.143.2]All the necessary information is processed and sends by mat lab to the microcontroller for a particular signal to be lighted. So there is longer traffic cycle for more traffic density vice versa accordingly the traffic light is controlled. It's obtained by using model weight and weight time allocation.
Fig -3.5: Flowchart
3.6. Emergency vehicle detection
As per stated in the paper [4], there is additional concept is used during traffic management in case of ambulance, police vehicle. When there are too many lanes, if the vehicle is present in that particular lane is detected by using these below algorithm and that lane is given higher priority for that particular time limit so that the vehicle can pass easily by making that lane signal green.
After the acquiring of the image, it goes through the grayscale image, edge detection, morphological operation, and then by specifying the particular threshold is used to detect the red light. We isolated the area with high-intensity red light and lesser intensity of the blue and green color. Due to these, the headlight of the vehicle is detected, but the condition is given that red light must satisfy the blinking condition. The red light satisfying should appear in the other frame so the other lights are eliminated. Also if the vehicle in any position can be detected easily.
The condition for detection of red light during various periods of days is given below:
Night time condition
For red light: R> 230, G<250, B<250
In the intermediate frames: R <230, G>230, B>230 Daytime conditions
For red light: R> 230, G<250, B<250
In the intermediate frames: R<230, G<230, B<230
[image:5.595.309.560.570.636.2]If matched, the normal system is stopped and that particular lane is given higher priority over all others.
Fig -3.6: Flow diagram for emergency vehicle detection
3.7. Android Application
[image:5.595.318.545.692.742.2]© 2018, IRJET | Impact Factor value: 6.171 | ISO 9001:2008 Certified Journal | Page 2446 The traffic density information which we obtain is passed
over the server this status is then sent to the handset through the Android application to give the information of the traffic in that particular area. A new application user will first register and to log in the information using login form provided. The server returns the various locations present in the database to the Android user. Along with the traffic status, also it can provide you to search the particular place and to see what the traffic status is. The other alternative road which has less traffic to your particular destination. The application is very handy and no extra cost will be required. This application will save the time avoid the users to have to find out busy streets.
4. CONCLUSION
These paper we discuss a method for estimating the traffic density on the different lane based on image processing, we can use it to count the number of dynamic vehicles that are passing on the highway and to control the traffic. These are advantageous technique over such as the use of Ariel imagery, complex sensor-based system and using any additional devices, such as RFIDs. The image is acquired by the camera and it's being placed at a particular height. Traffic information extraction is done by combining the two techniques such as gradient magnitude and frame subtraction method. The vehicle count is found out by using bounding box property, further according to the traffic control algorithm we can allocate the time limit to the particular lane according to the traffic density. The use of emergency vehicle detection algorithm helps to detect the vehicle such as ambulance, fire vehicles etc. Helps to give the priority to those emergency vehicles. The controlling of traffic light takes place through the microcontroller ATMEGA8 communication takes place through USART and accordingly the traffic light control based on the priority assigned. The use of the Android-based application to detect the traffic status to the user and accordingly decided the path to the destination. It helps to save the time and also to control the traffic.
REFERENCES
1. Pallavi Choudekar, Sayanti Banerjee, M.K.Muju, “Implementation Of Image Processing In Real Time Traffic Light Control”, 978- 1- 4244- 8679- 3/11/ 2011, IEEE.
2. Uma Nagaraj, Jinendra Rathod, Prachi Patil, Sayali Thakur, Utsav Sharma, “Traffic Jam Detection Based On Image Processing”, International Journal Of Engineering Research And Applications (IJERA), Vol. 3, Issue 2, March – April 2013, pp. 1087-1091.
3. Naeem Abbas, Muhammad Tayyab, M.Tahir Qadri, “Real Time Traffic Density Count Using Image Processing”, International Journal Of Computer Applications(0975 – 887), Volume 83, No .9, December 2013.
4. Chandrasekhar. M, Saikrishna. C, Chakradhar. B, Phaneedra Kumar. P, Sasanka. C, “Traffic Control Using Digital Image Processing”, International Journal of Advanced Electrical and Electronics Engineering (IJAEEE), volume- 2, Issue -5, 2013.
5. Yasar Abbas UrRehman, Adam Khan, Muhammad Tariq, “Modeling, Design and Analysis Of Intelligent Traffic control System Based On Integrated Statistical Image Processing Techniques”, 12th
International Bhurban Conference On Applied Sciences & Technology (IBCAST), January 2015.
6. Md. Munir Hasan, Gobinda Saha, Aminul Hoque, Md. Badruddoja Majumder, “Smart Traffic Control System With Application Of Image Processing Techniques”, 3rd International Conference Of
Informatics, Electronics & Vision, 978-1-4799-5180-2/14/ 2014, IEEE.
7. Taqi Tahmid, Eklas Hossian, “Density Based Smart Traffic Control System Using Canny Edge Detection Algorithm For Congregating Traffic Information”, 3rd International Conference On Electrical
Information and Communication Technology (EICT), 978-1-5386-2307-7/17/ 2017, IEEE.
8. K. Vidhya, A. Bazila Banu, “Density Based Traffic Signal System”, 2014 International conference of Innovations Engineering and Technology (ICIET’14), March 2014.
9. Al Hussain Akoum, “Automatic Traffic Using Image Processing”, Journal of Software Engineering and Applications (JSEA),10, 756-776, Aug 14, 2017.
10. Omkar Ramdas Gaikwad, Anil Vishwasrao, Prof. Kanchan Pujari, Tejas Talathi, “Image Processing Based Traffic Light Control”, International Journal of Science Engineering and Technology Research (IJSETR), Volume 3, Issue 4, April 2014.
11. Alisha Janrao, Mudit Gupta, Divya Chandwani, U.A. Joglekar, “ Real Time Traffic Density Count Using Image Processing”, International Journal of Computer Applications (097-887), Volume162, No. 10, March 2017.