http://dx.doi.org/10.4236/jpee.2015.34013
Study on Multi-Objective Effect Evaluation
System of Smart Grid Construction
Yanling Wang, Zhengjie Pan, Haitian Hao, Ziqing Zhou
Research Institute of Electric Power Market, North China Electric Power University, Beijing, China Email: [email protected], [email protected],[email protected],
Received January 2015
Abstract
This paper builds multi-objective effect evaluation indicator system of smart grid construction from five connotations including strong and reliable, clean and green, friendly and interactive, transparent and open, economical and effective, which is embodied in the power generation, tran- smission, transformation, distribution, consumption, dispatching and information communication platform of smart grid. Taking the construction of smart grid in a certain area of China as an ex-ample, this paper uses analytic hierarchy process (AHP) to make an empirical analysis on it, and makes a comprehensive and objective evaluation on its construction effect.
Keywords
Smart Grid, Multi-Objective Effect, Evaluation Indicator System, AHP
1. Introduction
In order to tackle climate change and ensure energy security, countries around the world are increasing emphasis on the development of clean energy and the improvement of energy efficiency at present. As the basis and pmise for achieving low-carbon electricity, smart grid technology has developed rapidly in many countries in re-cent years, and effectively promotes the grid smart [1] [2].
Some countries have put forward appropriate evaluation system of smart grid based on their basic national conditions and development stage of power industry, in order to cooperate with the construction of strong smart grid and reflect its technical characteristics and functional properties comprehensively.
The foreign typical evaluation systems of smart grid mainly contain the smart grid maturity model proposed by IBM [3], the framework system of smart grid assessment drafted by DOE [4], the smart grid construction evaluation indicator of EPRI [5], the smart grid profit evaluation system of EU [6] and so on. It should be noted that the evaluation system of US pays more attention to the safety and reliability of power system because of its obsolete facilities and the hidden dangers against security and stability; the evaluation system of Europe focuses on development and utilization of new energy and low carbon due to the shortage of fossil energy and large spe-cific gravity of new energy generation.
evaluation model and method [7] [8], etc.
Combined with the target and development direction of smart grid in China, this paper has built multi-objec- tive effect evaluation indicator system of smart grid construction from five connotations including “strong and reliable”, “clean and green”, “friendly and interactive”, “transparent and open”, “economical and effective” [9], which can make a comprehensive and objective evaluation on the effect of smart grid construction.
2. Multi-objective Effect Evaluation Indicator System of Smart Grid Construction
2.1. Construction Principle of the Indicator System
Currently, the World Bank and the national government departments commonly adopt the SMART criterion to select indicators, and the 5 letters of SMART represent specific, measurable, attainable, relevant and trackable. The advantage of this criterion is having a relatively clear standard, which makes evaluation easy.
Considering the characteristics and connotations of smart grid, according to SMART criteria, this paper has proposed the principle of establishing indicator system. 1) Comprehensiveness. Indicators should reflect the ac-tion of each construcac-tion link as much as possible. 2) Independence. Various indicators in the same level should have clear connotation, mutual independence and cannot overlap each other. 3) Typicality. Indicators should make key points of construction stand out and grasp the main aspect of problem. 4) Measurability. Evaluation indicators of each construction action should have the appropriate standards and use the same standard as uni-fied evaluation dimension.
2.2. Five Connotations of Smart Grid
The State Grid Corporation has proposed the development train of thought about unified strong smart grid with Chinese characteristics, which is “one goal, two main lines, three stages, four systems, five connotations, six links”. The five connotations are:
1) Strong and reliable, which mean strong grid structure, strong power transmission capacity, safe and reliable power supply ability.
2) Clean and green, which mean promoting development and utilization of renewable energy, reducing energy consumption and pollutant emission, and improving the proportion of clean energy in final energy consumption.
3) Friendly and interactive, which mean flexible adjustment of power grid operation mode, easy for various types of power and users accessing or exiting the grid, promoting the generation companies and users to actively participate in grid operation regulation.
4) Transparent and open, which mean the transparent and shared information of power grid, power sources and users, and open grid without discrimination.
5) Economical and effective, which mean improving the operation and transportation efficiency of power grid, reducing operating costs, promoting the efficient utilization of energy resources and electric power assets.
According to these five connotations above, the effect evaluation indicator system of smart grid construction extracts effect indicators from each construction link of smart grid, which can embody the smart grid characte-ristics scientifically and comprehensively.
2.3. Multi-Objective Effect Evaluation Indicator System
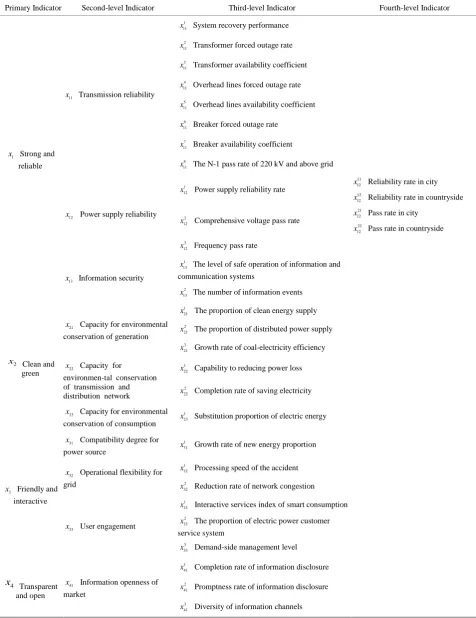
The smart grid has five connotations including “strong and reliable”, “clean and green”, “friendly and interac-tive”, “transparent and open”, “economical and effecinterac-tive”, which are embodied in the power generation, trans-mission, transformation, distribution, consumption, dispatching and information communication platform of smart grid. Build multi-objective effect evaluation indicator system of smart grid construction based on these connotations, as shown in Table 1.
3. Effect Evaluation Model Based on AHP
3.1. Determine the Weight of Indicators by AHP
Table 1. Multi-objective effect evaluation indicator system.
Primary Indicator Second-level Indicator Third-level Indicator Fourth-level Indicator
1
x Strong and
reliable 11
x Transmission reliability 1 11
x System recovery performance
2 11
x Transformer forced outage rate
3 11
x Transformer availability coefficient
4 11
x Overhead lines forced outage rate
5 11
x Overhead lines availability coefficient
6 11
x Breaker forced outage rate
7 11
x Breaker availability coefficient
8 11
x The N-1 pass rate of 220 kV and above grid
12
x Power supply reliability 1 12
x Power supply reliability rate
11 12
x Reliability rate in city
12 12
x Reliability rate in countryside
2 12
x Comprehensive voltage pass rate
21 12
x Pass rate in city
22 12
x Pass rate in countryside
3 12
x Frequency pass rate
13
x Information security
1 13
x The level of safe operation of information and
communication systems
2 13
x The number of information events
2
x Clean and green
21
x Capacity for environmental conservation of generation
1 21
x The proportion of clean energy supply
2 21
x The proportion of distributed power supply
3 21
x Growth rate of coal-electricity efficiency
22
x Capacity for
environmen-tal conservation of transmission and distribution network
1 22
x Capability to reducing power loss
2 22
x Completion rate of saving electricity
23
x Capacity for environmental conservation of consumption
1 23
x Substitution proportion of electric energy
3
x Friendly and interactive
31
x Compatibility degree for
power source
1 31
x Growth rate of new energy proportion
32
x Operational flexibility for grid
1 32
x Processing speed of the accident
2 32
x Reduction rate of network congestion
33
x User engagement
1 33
x Interactive services index of smart consumption
2 33
x The proportion of electric power customer service system
3 33
x Demand-side management level
4
x Transparent and open
41
x Information openness of
market
1 41
x Completion rate of information disclosure
2 41
x Promptness rate of information disclosure
3 41
Continued
42
x Open grid without discrimination
1 42
x Growth rate of trade electricity for generation
right
2 42
x Growth rate of trade volume of direct purchasing electricity for large consumers
3 42
x Growth rate of inter-provincial electricity trade
volume
5
x Economical
and effective 51
x Operation efficiency of
power grid
1 51
x Generation efficiency of renewable energy
2 51
x Operating efficiency of distribution automation
3 51
x Operating efficiency of Information communication
52
x Utilization efficiency of power grid
1 52
x Capacity utilization of 220kV and above lines 11 52
x Conventional power lines
capacity utilization
12 52
x New energy lines capacity utilization
13 52
x Load feeders capacity utilization
14 52
x Main network frame and contact lines capacity utilization
2 52
x Capacity utilization of 220kV and above
transformer
21 52
x Main transformer capacity
utilization
3 52
x Capacity utilization of 110kV and below lines 31 52
x Municipal power supply lines capacity utilization
32 52
x County power supply lines
capacity utilization
4 52
x Capacity utilization of 110kV and below
transformer
41 52
x Municipal main transformer capacity utilization
42 52
x County main transformer capacity
utilization
construction effect of smart grid. Specific steps are as follows:
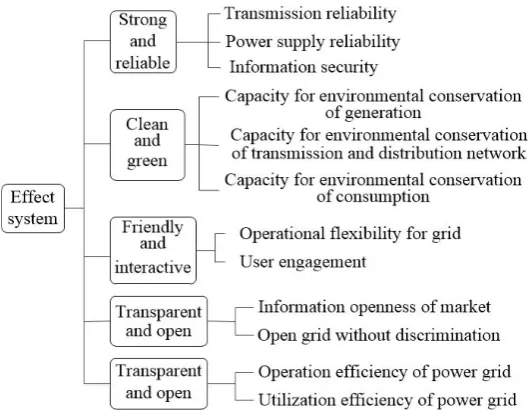
1) Build the hierarchic analysis structure. The Figure 1 just shows typical AHP model structure.
2) Construct the judgment matrix. The judgment matrix compares the relative importance degree of evalua-tion indicators at the same level which are associated with the indicator in upper level.
3) Order the single hierarchical. Calculate relative importance of a factor in one hierarchy to a factor in the upper hierarchy, which is called single hierarchical ordering. It can come down to calculating the largest eigen-values and eigenvectors of the judgment matrix.
4) Test the consistency of judgment matrix. The indicator weight assignment is successful if the result of sin-gle hierarchical ordering has an ideal consistency; otherwise, the values of element in judgment matrix need to be adjusted.
3.2. Classify the Indicator Evaluation Grade
Set four evaluation grades for effect indicators, give each grade the corresponding score interval, and then we can classify the effect level of smart grid construction, as shown in Table 2.
3.3. Calculate the Evaluation Result
Figure 1. Hierarchical chart of multi-objective effect evaluation system.
Table 2. Evaluation grade and score interval of effect.
No. Indicator Evaluation Grade Score Interval
A Unqualified 0 - 59
B Qualified 60 - 69
C Good 70 - 84
D Excellent 85 - 100
in multi-objective effect evaluation indicator system can be obtained according to the score interval and evalua-tion grade in Table 2, as shown in Table 3.
Finally, we can judge the overall level of smart grid construction effect by using the weighted means method to obtain total score according to the scores of five primary indicators.
4. Example Analysis
Use the method in this paper to evaluate construction effect of smart grid in one region.
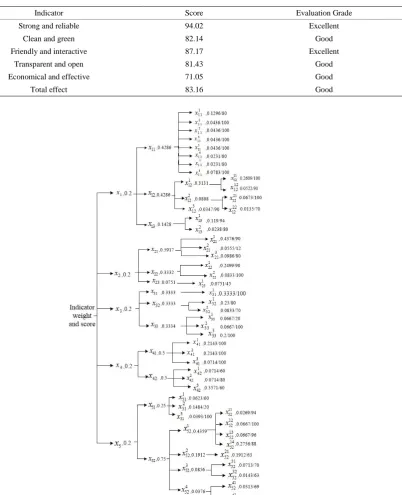
4.1. Determine the Indicator Weight and Score
Determine the indicator weight by using AHP, and let experts give the corresponding scores on the basis of ac-tual data of smart grid. The indicator weight and score are as shown in Figure 2.
4.2. Calculate the Evaluation Result
Use weighted means method to calculate scores of the five primary indicators including “strong and reliable”, “clean and green”, “friendly and interactive”, “transparent and open”, “economical and effective”, and finally obtain the total score of effect. Then judge the grade of construction effect according to Table 2, as shown in
Table 4.
Finally, we can judge the overall level of smart grid construction effect by using the weighted means method to obtain total score according to the scores of five primary indicators.
Table 3. Evaluation result of smart grid construction effect example.
Indicator Score Evaluation Grade
Strong and reliable 90 Excellent
Clean and green 84 Good
Friendly and interactive 92 Excellent
Transparent and open 81 Good
[image:6.595.133.536.201.697.2]Economical and effective 72 Good
Table 4. Evaluation result of smart grid construction effect.
Indicator Score Evaluation Grade
Strong and reliable 94.02 Excellent
Clean and green 82.14 Good
Friendly and interactive 87.17 Excellent
Transparent and open 81.43 Good
Economical and effective 71.05 Good
Total effect 83.16 Good
poor, distributed power develops slowly, the level of environmental protection on power demand side is low, various electricity trades increase slow, utilization efficiency of grid a little low, etc. Therefore, appropriate measures should be taken to continuously strengthen and improve the construction work of smart grid, such as reinforcing the construction and renovation of rural power grid, rational development of distributed power, ac-tively promoting the strategy of electric energy substitution, further improving the trading rules and trading sys-tem functions of power market, further optimizing the grid structure.
5. Conclusions
This paper constructs multi-objective effect evaluation indicator system around five connotations including strong and reliable, clean and green, friendly and interactive, transparent and open, economical and effective; and builds the evaluation model based on AHP. Through the evaluation and analysis of smart grid construction in one region of China, it is found that “clean and green”, “transparent and open” and “economical and effective” get low scores. There is a need to improve the construction work of smart grid for its weak part, thereby guaran-teeing the scientifically and orderly development of the construction work.
The case in this paper shows that the evaluation system can objectively evaluate the construction effect of smart grid in the round, quickly and accurately identify the deficiencies in smart grid construction, so that it can help to grasp the development direction of smart grid construction and provide reference for the planning and construction of smart grid.
References
[1] Zheng, J. (2011) The Review of the Smart Grid Development Both at Home and Abroad Shanghai Electric Power, No. 3, 256-259.
[2] Bala, S.K., Babu, B.C. and Bala, S. (2012) A Review on Development of Smart Grid Technology in India and Its Fu-ture Perspectives. Proceedings of 2012 Students Conference on Engineering and Systems (SCES 2012), Uttar Pradesh, 16-18 March 2012, 1-6. http://dx.doi.org/10.1109/SCES.2012.6199016
[3] IBM Corporation (2009) IBM End-to-End Security for Smart Grids. IBM Corporation, New York.
[4] US Department of Energy (2009) Smart Grid System Report. U.S. Department of Energy, New York.
[5] The Electric Power Research Institute Inc., EPRI (2010) Methodological Approach for Estimating the Benefits and Costs of Smart Grid Demonstration Projects. The Electric Power Research Institute Inc., Palo Alto.
[6] European Smart Grids Technology Platform (2010) Vision and Strategy for Europe’s Electricity Networks of the Fu-ture. European Commission, Brussels.
[7] Wang, J.-M. and Shi, T. (2012) Construction of Evaluation Index System for Smart Grid. East China Electric Power, 40, 193-197.
[8] Sun, Q., Ge, X.-B., Liu, L., Xu, X., Zhang, Y.-B., Zeng, Y., et al. (2011) Review of Smart Grid Comprehensive As-sessment Systems. Proceedings of the CSU-EPSA, 23, 105-109.
[9] Baidu Encyclopedia, Smart Grid.