© 2017, IRJET | Impact Factor value: 5.181 | ISO 9001:2008 Certified Journal | Page 3457
Optimization of Solar Water Pumping System
Shirish V. Singh
1, Sunil Bhatt
21
Central India Institute Technology, Indore
2Professor, Dept. of Electrical and Electronics Engineering
, Central India Institute Technology, Indore
---Abstract -
The Non – Renewable energy sources are beenexcessively consumed in last few decades. Therefore to promote the use of renewable source i.e. Solar energy as a clean source of energy for most common application i.e. water pumping with properly designed system to optimum use of solar energy is been studied in this paper. The photovoltaic panel gives output in DC. For simplicity the systems are employing PMDC motor for this application so that the output DC power can be fed directly to the motor which has been coupled with the pumps to deliver water. But along with this advantage it has large number of dis-advantages which results in competing the performance with BLDC motors..
1.
INTRODUCTION
The PMDC motor with 15 slot armature 2 pole segmented magnet of SmCo grade Sm2Co17 26H. Br = 10.6 kG, Hc = 784 kA/m. The motor working temperature when loaded at 0.3 hp is 78 .C Due to less power rating motor the magnet eddy current is to be reduced therefore the magnets are been segmented. On the other hand reliability of the motor is less and losses are more due to carbon brushes supplying current. These brushes have to be replaced after regular interval to ensure proper working of the motor. As well as the power vs. efficiency profile is linear.
Figure. No.1 Circuit diagram of PMDC motor
The replacement of above PMDC with BLDC is designed with similar dimension with higher service factor . The electrical steel grade is taken similar but SmCo is been replaced with NdFeB.
2.
DESIGN PROCEDURE AND STEPS
The biggest confusion for designer to design a motor of independent power source of stator and rotor is to collaborate both stator and rotor design.A poor design collaboration will result in lesser power factor. Therefore it is also necessary to fix the design step either to design stator first or the rotor first. Further iteration will improve the design. Here the rotor permanent magnet is been designed first than the stator lamination, winding. The material selection should be compatible with PWM supplies with higher frequencies
3.
Design topology
The stator is distributed wound to increase the number of slot for same number of pole with lesser and frequency thereby also reducing the hysteresis loss, eddy current loss, and copper loss due to increase in resistance with higher operating frequencies. The surface mount magnet rotor is designed to reduce the manufacturing difficulty and cost. If the service factor is required is less the rotor should be designed with interior permanent magnet design to increase reluctance torque and to reduce cogging torque with lesser number of stator slot and poles.
4.
Parameters Details
The motor is designed to work on a single panel of 300 Wp. Sr.
No. Description Value
1 Rated Power 0.3 hp
2 Minimum Operating
Voltage 36 V,DC
3 Rated Speed 1750
4 Rated Torque 2 Nm
5 Cogging torque <10% of rated
torque. Due to higher service factor otherwise <2%
6 Efficiency More than 80 % at
rated torque Table. No.1 Parameters of motor
5.
Permanent Magnet design
Material Grade: NdFeB – N35-M
Back emf max:
√
√
Maximum Speed: 1750 rpm Torque required:
© 2017, IRJET | Impact Factor value: 5.181 | ISO 9001:2008 Certified Journal | Page 3458
= =0.648 Nm
( )
, ( ) - ( )
, ( )
( )
,
{ }
* +
{ }
( ) * +
( ) ( )
( ) √ ( )
( )
wb
6.
Stator lamination design.
Number of stator slot = 12 Shape of slot = Tapper
© 2017, IRJET | Impact Factor value: 5.181 | ISO 9001:2008 Certified Journal | Page 3459
Core Back = 0.00852 m
0.898 T
Tooth width = 0.00472 m
*Note – Flux density are been calculated at No – Load
[image:3.612.333.555.77.279.2]
I. Results
Figure. No.2 (a) Winding over hang temperature (62.4°C) at service factor 1.35 (b) Housing temperature (53.9 °C) at service factor 1.35 (c)Terminal Box temperature (44.5 °C) at service factor 1.35 (d) Winding over hangs temperature (48.7°C) at service factor 1.00
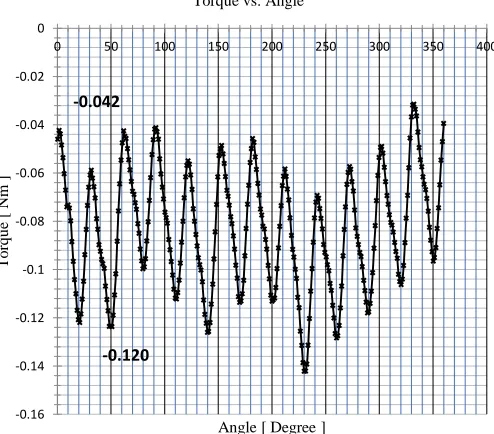
Figure. No.3 Cogging torque
Cogging torque = Tmax – Tmin
=0.120 - 0.042 = 0.078 Nm
-0.042
-0.120
-0.16 -0.14 -0.12 -0.1 -0.08 -0.06 -0.04 -0.02 0
0 50 100 150 200 250 300 350 400
T
o
rq
u
e
[
N
m ]
[image:3.612.320.567.360.577.2]© 2017, IRJET | Impact Factor value: 5.181 | ISO 9001:2008 Certified Journal | Page 3460
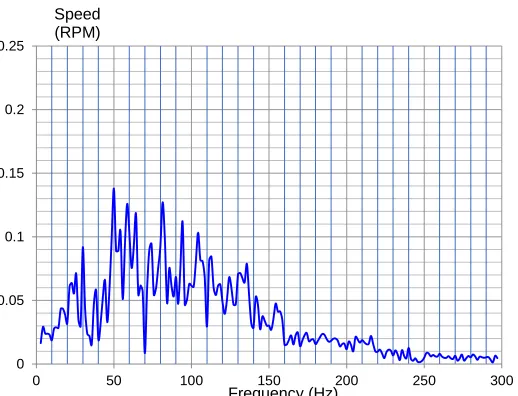
Figure. No.4 Steady state torque spectrumFigure. No.5 Steady state speed spectrum
Figure. No.6 H-Q Curve with BLDC motor
[image:4.612.47.310.299.483.2]Figure. No.7 Ƞ - H Curve with BLDC motor
Figure. No.8 H-Q Curve with PMDC motor
Figure. No.9 Ƞ - H Curve with PMDC motor 0
0.05 0.1 0.15 0.2 0.25
0 50 100 150 200 250 300
Speed (RPM)
Frequency (Hz)
0 5 10 15 20 25 30 35 40 45
0 50 100 150 200 250 300
Speed (RPM)
Frequency (Hz)
0 5 10 15 20 25 30 35 40 45 50
0 500 1000 1500 2000
H
ea
d
(
m)
Discharge (LPH) H - Q Curve
10.0 15.0 20.0 25.0 30.0 35.0 40.0 45.0
0 10 20 30 40 50
Ef
fi
ci
en
cy
(
ῃ%)
Head (m) ῃ % Vs H
0 5 10 15 20 25 30
0 200 400 600 800 1000 1200 1400
H
ea
d
(
m)
Discharge (LPH) H - Q Curve
0.0 5.0 10.0 15.0 20.0 25.0 30.0 35.0 40.0
0 5 10 15 20 25 30
Ef
fi
ci
en
cy
(
ῃ%)
[image:4.612.326.576.300.498.2] [image:4.612.50.578.527.704.2]© 2017, IRJET | Impact Factor value: 5.181 | ISO 9001:2008 Certified Journal | Page 3461
300 WpHead LPH LPM Power Efficiency
3.7 1568 26.1 113.6 13.9
5 1536 25.6 122.7 17.1
10 1493 24.9 151.5 26.9
15 1439 24.0 178.4 33.0
20 1372 22.9 210.0 35.6
25 1300 21.5 230.7 39.0
30 1160 19.3 234.0 40.5
35 1041 17.4 231.2 42.9
40 885 14.8 228.8 42.2
[image:5.612.347.545.51.172.2]45 742 12.4 225.5 40.3
Table. No.2 Performance of BLDC with 300 Wp @ Solar radiation 1000 W/m2 with Temp 25 ˚C
300 Wp
Head LPH LPM Power Efficiency
1 1199 20.0 167.3 2.0
5 1191 19.9 177.5 9.1
10 1178 19.6 195.5 16.4
15 1155 19.3 213.2 22.1
20 915 15.3 143.9 34.6
25 508 8.5 95.6 36.2
[image:5.612.70.271.51.202.2]30 340 6.7 85.6 33.2
Table. No.3 Performance of PMDC with 300 Wp @ Solar radiation 1000 W/m2 with Temp 25 ˚C
The motor was coupled with the positive displacement pump and above reading have been noted. At the time of loading thermal images has been captured at different location and at different service factor which are been mentioned above.
7.
Conclusion
The performance with BLDC was much better as compared to PMDC in spite of lower rating motor. Also the motor can be easily overloaded which enhance the use of BLDC motor for solar powered in water pumping application
8.
References
[1] A.K. Sawhney and A. Chakrabarti, Electrical Machine Design, Dhanpatrai & Co., 2006
[2] M.G. Say, The performance and Design of Alternating Current Machines, CBS Publishers & Distributors, 2002, ISBN: 81-239-1027-4.
[3] G. Madescu, I. Boldea, T.J.E. Miller, Optimal Lamination Approach for Induction Motor Design, IEEE Trans Vol.IA-34, No. 2, 1998, pp.1-8