http://dx.doi.org/10.4236/mme.2014.44019
Finite-Element Analysis of Parts Stress State
of Tight Joint Assembled by Press Fitting
Sinitsyna Vasilya, Sinitsyn Anton
Mechatronic System Department, Izhevsk State Technical University, Izhevsk, Russia Email: nvasilenok@yandex.ru, tofkas@yandex.ru
Received 3 September 2014; revised 9 October 2014; accepted 4 November 2014
Copyright © 2014 by authors and Scientific Research Publishing Inc.
This work is licensed under the Creative Commons Attribution International License (CC BY). http://creativecommons.org/licenses/by/4.0/
Abstract
This paper includes descriptions of the stress distribution regularities in the tight joint parts, re-gularities of the stress state changes in the contact region along coupling length, stress concentra-tion factors, levels of addiconcentra-tional stresses caused by press fitting. Distribuconcentra-tions of stress intensity, axial stress, contact pressure, tangent stress in parts and in contact zone along coupling length are considered. Calculation results obtained by three approaches: Lame relationships, FEM without considering assembly method, FEM with considering press fitting process are analyzed and com-pared. The adequacy of research carried out is confirmed.
Keywords
Tight Joint, Stress State, Contact Pressure, Press Assembly, Finite Element Method
1. Introduction
The tight joints are widely used in the mechanical engineering. Increasing demands for higher transmitting forces and torques require the reliability enhancement of machinery and equipment. The tight joint reliability enhancement is one of the fundamental tasks as part of the problem reliability enhancement of machinery and equipment. The tight joint failure leads to machinery and equipment failure, which leads to technogeneous effect and economic troubles. Therefore, stress state of the tight joint parts should be calculated taking into account maximum number of acting loads to enhance the tight joints reliability.
In paper [5] parts stress state of the mechanically assembled tight joint is investigated. But, there is no con-sideration of distributions of stress intensity, axial stress, contact pressure, tangent stress in parts and in contact zone along coupling length. Stress concentration factors also are not considered.
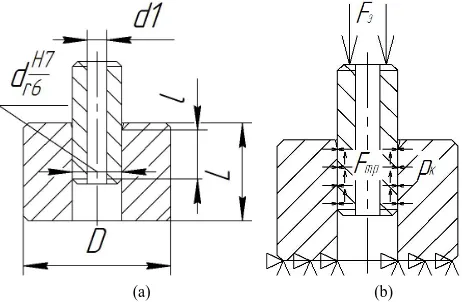
The research is carried out with the financial support of RFBR in the framework of the research project № 14-08-31235mol_а. The press fitting is one the of mechanical assembly methods, whose classification is pre-sented in the paper [6]. Scheme of press fitting is presented in Figure 1(b).
2.
Оbject of Research
The shaft and hub connection with interference N =6 мкм and coupling length l=10 мм (Figure 1) is an object of research. Rated joint diameter d=10 мм, inner diameter of shaft d1 =4 мм, outer diameter of hub
30 мм
D= . Both parts are manufactured from the same material-steel 40, for which the yield point is 1480 МПа
Т
σ = , the strength is σ =В 1750 МПа, the elastic modulus is E= ×2 10 МПа11 , the Poisson’s ra-tio is µ=0.3, the density is
ρ
=7850кг м3. The friction ratio in the contact region is f =0.18.3. Design Methods
3.1. Analytic Approach
Lame dependences are often used for the initial evaluation of the tight joint parts stress state. According to them the largest radial tension is determined by the contact pressure.
1 2 1 2 r N p C C d E E
σ = − = −
+ ⋅ (1) where 2 1
1 2 1
1 1 1 d d C d d µ + = − − and 2 2
2 2 2
2 1 1 d d C d d µ + = + −
-coefficient of stiffness; d-rated joint diameter; d1-inner
diameter of the shaft; d2-outer diameter of the hub; N-rated interference, Е1, Е2, и µ1, µ2—elastic mod-ulus and Poisson’s ratio of the shaft and the hub respectively.
The largest compressive tangential stress in the shaft is evaluated by the expression:
(
)
(
)
2 1 2 1 2 1 I t d d p d d σ =− (2)
The largest compressive tangential stress in the shaft is estimated by the dependence:
[image:2.595.183.414.542.693.2](a) (b)
Figure 1. The tight joint (a) and the tight joints press fitting
(
)
(
)
2 2
2 2
1
1 II t
d d p
d d σ = +
− (3)
The largest equivalent stresses according Lame method are located on the inner surface of a hub:
II II
B t r
σ
=σ
−σ
(4)The considered Lame dependences are simple and convenient. However, they are received making assump-tions that the mating parts have an ideal forms and excluding the phenomena and loads that are arising during the process of the tight joints assembly or operation.
3.2. Finite Element Method
Finite Element Method (FEM) allows solving the problem of determining the stress state of parts with the com-plex construction under various boundary conditions. To establish regularities of the stresses distribution in the contact region of mechanically as sembled couples it is necessary to solve two independent problems: the as-sembled tight joint modeling without taking into account assembly method, and modeling of the process of the shaft and the hub assembling by press fitting.
The components were modeled using solid elements. The contact was modeled using with Coulomb friction. For static modeling of the tight joint in the assembled state (Figure 2(a)) the grid consists from 453 axisymme-tric element. For the tight joint modeling during the process of mechanical pressing the grid consists from 443 axisymmetric elements (Figure 2(b)). In supposed areas of stress concentrations and their gradients (contact surface and detail faces zones) the finite element mesh is a thickened (Figure 2).
Boundary conditions are represented by symmetry condition along Y axis and lower hub face fixing, that re-strict all nodes displacement along X and Y axes. The 10 mm displacement of the shaft upper face is specified for the tight joint modeling during the process of mechanical pressing.
4.
Results
4.1.
Results of
Analytical Calculation
[image:3.595.182.409.467.672.2]The results of analytical calculation of components stress state by means of Lame relationships are presented on Figure 3 in the form of radial and tangential stress distribution and in Table 1 in the form of numerical values.
Figure 2. Finite element model of the tight joint: 1. the shaft, 2. the hub; А: characteristic point on the hub: (a) Static modeling of the tight joint in the assembled state; (b) The tight joint
Figure 3. Radial and tangential stress distribution obtained by means of lame relationships.
Table 1. Results of stresses calculation by different method in the region of coupling length centre.
Lame relationship FEM without assembly
method consideration
FEM with considering press fitting process
Radial stresses 45.61 45.86 47.38
Tangent stresses on the inner
surface of the hub 57.01 51.73 51.11
The maximum radial stresses are located on the contact surface. The maximum tangential stresses of the shaft are shimming and located on the inner surface. The maximum shimming tangential stresses of the hub are ten-sile and located on the inner surface of the hub.
4.2.
Results of FEM
Calculation
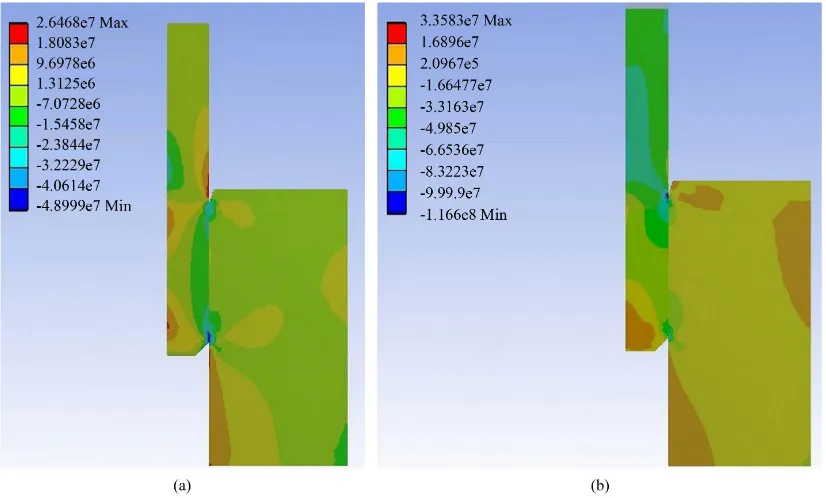
4.2.1. Stress IntensityStress intensity distributions are commonly the same for calculation without considering assembly method and for calculation with considering press fitting process (Figures 4(a)-(b)).
However, in results of the calculation with considering press fitting process (Figure 4(b)) there is an area of low stresses (up to 14.98 MPa), that sharply comes to area of high (up to 82 MPa) stresses. The shaft stresses are lower than the hub stresses.
From Figure 4(b) one can see that, for the given initial condition the inner surface of the shaft is the more stressed (up to 128 MPa). Such stresses on the hub appear only near the coupling faces. Stress intensity in mid-dle of the contact zone of hub inner surface varies around 100 MPa.
In the contact zone according to the length (Figure 5) the stress intensities of the covering part vary in the range from 93.45 MPa to 124.72 MPa for the calculation without considering assembly method and in the range from 95.07 MPa to 128.42 MPa for the calculation with considering press fitting process. Covered part in the contact zone has less stress state: the stress intensities vary according to the length in the range from 38.19 MPa to 91.41 MPa for the calculation without considering assembly method and in the range from 14.99 MPa to 95.93 MPa for the calculation with considering press fitting process.
The largest difference in numerical values of the stress intensity on the shaft and hub is observed at the dis-tance of 0.50 mm from the top face of coupling. The phenomenon of wave formation on the chart of the stress intensity distribution on the shaft and hubwave (Figure 5, line 2) can be explained as a result of deformation that is arisedat the moment of the contact formation by the mating surfaces.
The additional stresses caused by mechanical assembly weaken the stress state of the shaft on the contact sur-face, and increase of the hub. The level of additional stresses caused by mechanical assembly reaches −62.38% of stress level calculated without considering assembly method on the shaft (Figure 5(а)) and 16.54% on the hub (Figure 5(b)).
[image:4.595.88.540.265.323.2]Figure 4. Stress intensity distributions: (a) Static modeling of the tight joint in the assembled state; (b) The tight joint
mod-eling during the process of mechanical pressing.
[image:5.595.99.533.393.558.2](a) (b)
Figure 5. The stress intensity in contact zone along coupling length on the shaft (а) and hub (b): 1. The calculation without considering assembly method; 2. For the calculation with considering press fitting process; 3. The level of additional stresses
caused by mechanical assembly.
Table 2. Stress intensity concentration factors.
FEM without considering assembly method
FEM with considering press fitting process
Difference of Concentration factors
Shaft Top face 1.27 1.83 44.09%
Bottom face 2.04 2.14 0.49%
Hub Top face 1.23 1.26 2.43%
Bottom face 1.12 1.26 12.50%
-40 -200 20 40 60 80 100 120 140
0 1 2 3 4 5 6 7 8 9 10
Stress Intetsity, МPа
2
1
Contact Length, mm
3
SHAFT
0 20 40 60 80 100 120 140
0 1 2 3 4 5 6 7 8 9 10
Stress Intetsity, МPа
2
1
Contact Length, mm
[image:5.595.87.538.621.720.2]4.2.2. Axial Stresses in the Contact Zone
Axial stress distribution in the tight joint parts provokes particular interest in consideration of longitudinal scheme of press fitting (Figure 6).
The axial stress distribution is more or less symmetry with respect to the contact length centre for static mod-eling of the tight joint in the assembled state. There is small nonsymmetry near the faces of the coupling, which is caused by different bevels. Thus, the maximum shimming stresses (48.9 MPa) are near the 45˚ bevel of bot-tom face of the coupling.
The transition of axial stress concentration zone from the bottom coupling face to top face is observed when comparing the results of two calculations (Figures 6(a)-(b). Maximum shrimping stresses (up to 116 MPa) are located on the shaft near the top face of coupling.
[image:6.595.90.503.242.491.2]The greatest interest is the axial stress distribution directly in the contact zone, that is very different for calcu-lation with and without assembly method consideration (Figure 7).
Figure 6. The axial stress distribution. (a) Static modeling of the tight joint in the assembled state; (b) The tight joint modeling during the process of mechanical pressing.
(a) (b)
Figure 7. The axial stress in contact zone along coupling length on shaft (a) and hub (b): 1. The calculation without considering assembly method; 2. For the calculation with considering press fitting process; 3. The level of addi-tional stresses caused by mechanical assembly.
-140.00 -120.00 -100.00-80.00 -60.00 -40.00 -20.000.00 20.00 40.00
0 1 2 3 4 5 6 7 8 9 10
Axial stress,МPа
Contact Length, mm
2
1
SHAFT
3
-80.00 -60.00 -40.00 -20.00 0.00 20.00 40.00
0 1 2 3 4 5 6 7 8 9 10 Axial stress,МPа
Contact Length, mm
2 1
HUB
[image:6.595.93.507.531.684.2]On the hub maximum divergence of results (up to 29.6 MPa) is observed near the bottom face of the coupling and is 66% from values of axial stress calculated without assembly method consideration. On the shaft maxi-mum level of additional stresses caused by mechanical assembly (up to 96.54 MPa) is observed near the top face of the coupling and is 481% from values of axial stress calculated without assembly method consideration.
Axial stress concentration factors near the faces of coupling has higher values when they are calculated with considering press fitting then when they are calculated without considering assembly method they are (Table 3). The maximum difference (205.43%) of concentration factors is observed near the top face of the hub.
4.2.3. Contact Pressure
Contact pressures have higher values when calculated with considering press fitting then when calculated with-out considering assembly method (Figure 8).
Maximum level of additional contact pressure caused by mechanical assembly (up to 40.58 MPa) is observed near the top face of the coupling and is 31.85% from values of contact pressure calculated without assembly method consideration.
Contact pressure concentration factors near the top face of the coupling are 2.88 and 2.42 for the calculation with considering press fitting process and the calculation without considering assembly method respectively (Table 4).
The maximum difference (19.08%) of concentration factors is observed near the top face of the hub.
Figure 8. The contact pressure along coupling length: 1. The calculation without considering assembly method; 2. For the calculation with consi-dering press fitting process; 3. The level of additional stresses caused by
[image:7.595.166.432.318.466.2]mechanical assembly.
Table 3. Axial stress concentration factors.
FEM without considering assembly method
FEM with considering press fitting process
Difference of Concentration factors
Shaft Top face 0.92 2.81 205.43%
Bottom face 1.18 1.29 9.32%
Hub Top face 1.27 2.26 77.95%
Bottom face 1.90 3.01 58.42%
Table 4. Contact pressure concentration factors.
FEM without considering assembly method
FEM with considering press fitting process
Difference of Concentration factors
Top face 2.42 2.88 19.08%
[image:7.595.86.538.539.637.2]4.2.4. Tangent Stresses
Мaximum divergence of results calculated with and without assembly method consideration is 41.18% оn the hub and 54.67% on the shaft from values of tangent stresses calculated without assembly method consideration (Figure 9).
The additional tangent stresses caused by mechanical assembly (Figure 10, line 3) possess the negative val-ues near the top face of the coupling and possess the positive valval-ues near the bottom face.
5. Adequacy of Calcula
tion Results
[image:8.595.116.482.245.500.2]The divergence of results calculated by Lame relationship and FEM without assembly method consideration in the region of coupling length centre is 0.5%. The divergence of the results in the region of coupling length cen-tre calculated be Lame relationship and FEM with considering press fitting process is 3.8%. That confirms the adequacy of carried out research (Table 1).
Figure 9. The tangent stress distribution. (a) Static modeling of the tight joint in the assembled state;
(b) The tight joint modeling during the process of mechanical pressing.
[image:8.595.119.478.538.684.2](a) (b)
Figure 10. The tangent stresses on shaft (a) and hub (b): 1. The calculation without considering as-sembly method; 2. For the calculation with considering press fitting process; 3. The level of
addi-tional stresses caused by mechanical assembly.
-120.00 -110.00 -100.00-90.00 -80.00 -70.00 -60.00 -50.00 -40.00 -30.00 -20.00 -10.000.00 10.00 20.00 30.00
0 1 2 3 4 5 6 7 8 9 10
Tangent Stress,МPа
Contact Length, mm
2 1
SHAFT
3
-20 -10 0 10 20 30 40 50 60
0 1 2 3 4 5 6 7 8 9 10
Tangent Stress,МPа
Contact Length, mm
2 1
HUB
6. Conclusions
1) Current research has found that mechanical assembly of the tight joint greatly affects the parts stress state. The level of additional stresses caused by mechanical assembly reaches −62.38% of stress level calculated without considering assembly method on the shaft. Stress concentration factors divergence is 44.09% near the top face of the shaft.
2) The tight joint parts stress state calculation with considering press-fitting process allows taking into ac-count additional axial stresses arising in the course of mechanical assembly. Level of additional axial stresses in contact zone can reach 48.1% from values of axial stress calculated without assembly method consideration.
3) The tight joint parts stress state calculation with considering press fitting process allows estimating level of acting stresses and stress concentration factors more reliably because of taking into account additional stresses arising during assembly process. Therefore for tight joints reliability enhancement, the stress state calculation is recommended to do with considering assembly method.
4) The proposed approach to estimation of press-fitting influence on parts stress state is appropriate to use in their design and in CAD/CAM systems. That will lead to a more rational prescribing of geometrical dimensions of the mating parts and to the choice of their materials.
References
[1] Ast, M., Rosle, H. and Schenk, R. (1998) Finite Element Analysis of Shrink-Fit Shaft-Hub Connections. Voith Turbo Antriebstechnik GmbH, 1-15.
[2] Abramov, I.V., Abramov, A.I., Sinitsyn, A.N. and Sinitsyna, V.V. (2010) Stress-Strain State of Tight Joints under a Bending Moment. Russian Engineering Research, 8, 759-762.http://dx.doi.org/10.3103/S1068798X10080022 [3] Abramov, I.V., Abramov, A.I., Sinitsyn, A.N., Sinitsyna, V.V. and Petrov, A.V. (2011) Experimental Plant for Inter-
ference Fit Disassembling. 14th International Symposium on Mechatronika, 1-3 June 2011, Trencianske Teplice, 90- 92.
[4] Abramov, I.V., Abramov, A.I., Sinitsyn, A.N. and Sinitsyna, V.V. (2011) Theoretical Study of New Methods of As-sembly and DisasAs-sembly of the Tight Joints. Assembly in Mechanical and Instrument Engineering, 3, 11-15.
[5] Abramov, I.V., Abramov, A.I., Sinitsyn, A.N. and Sinitsyna, V.V. (2014) Mechanical Assembly Method Influence on Tight Joint Parts Stress State. Mechanical Engineering Bulletin, 10.