M-FISH Image Segmentation and Classification using
Fuzzy Logic
Lijiya A
Department of CSE
National Institute of Technology
Calicut, Kerala, India.
Sreejithlal G S
Department of CSE
National Institute of Technology
Calicut, Kerala, India.
Govindan V K
Department of CSE
National Institute of Technology
Calicut, Kerala, India.
ABSTRACT
Karyotyping has an important role in identifying genetic disorders due to structural changes in chromosomes. Multiplex fluorescence in-situ hybridization (M-FISH) technique provides more precise karyotyping. The new classification method, proposed in this paper, automates karyotyping, based on Fuzzy c-means (FCM) algorithm combined with a labeling chart. Classification results show that the proposed method improves accuracy and running time. It is also observed that the accuracy of classification can further be improved, using a new Reclassification algorithm which reduces the chance of wrongly classified chromosome pixels.
General Terms
Image Processing, Pattern Recognition.
Keywords
Karyotyping, Multiplex fluorescence in-situ hybridization (M-FISH), Fuzzy c-means (FCM), Labeling chart, Reclassification.
1.
INTRODUCTION
Chromosomes are thread-like structures located inside a nucleus and comprises of DNA and proteins. They carry hereditary information, which means, each pair of homologous chromosomes consists of a maternal and a paternal chromosome. They are visible only in the mitosis phase, under an electron microscope. Each chromosome differs in length and position of the centromere. Diploid is two complete sets of chromosomes, one from each parent. Human diploid number is 46 (2n), 23 from each parent. Out of the 46, 44 (22 pairs) are autosomes and two (XX or XY) are sex chromosomes.
Genetic disorders are caused by extra/missing chromosomes or abnormal position of chromosomes, which can affect growth and development of a human being. These problems can be identified by karyotyping, which identifies and studies the size, shape and number of chromosomes. The final result is called a karyotype, which is an image with 22 pairs of autosomes arranged in non-decreasing order of their lengths, followed by a pair of sex chromosomes. From a karyotype, the following information can be observed:
• differences in number of chromosomes (missing/additional chromosomes or arms)
• chromosomal mutations (inversions, deletions, trans-locations, etc.)
Karyotyping is simplified by the use of M-FISH [1, 2] technique. This simple and effective technique has
revolutionized cytogenetics. Each M-FISH image is captured with a fluorescent microscope, using a dye. A total of six images are captured with six different dyes. When DAPI (4',6-diamidino-2-phenylindole)is used as dye, all chromosomes will be visible in the image produced. For each of the other five different dyes, different subsets of chromosomes will be visible in the respective images produced. With this six set of images, all chromosomes can be uniquely identified. Thus M-FISH can be used to visualize the 22 human autosomes and the 2 sex chromosomes.
2.
RELATED WORKS
This section provides insights into some of the existing research works in the area of M-FISH karyotyping.
Sampatet al. [3] used a pixel-by-pixel classification based on Bayesian classifier. Bayesian classifier classifies images by finding posterior probabilities using prior probabilities. Yu-Ping Wang [4] showed that, with preprocessing, classification accuracy increases. This method uses multi-resolution image registration, which selects the DAPI image as the reference image and registers the other 5 images to it. Hyohoon Choi et al. [5] proposed a method which uses color compensation, filtering and normalization as preprocessing steps. Here, classification is carried out using maximum likelihood and FCM classifier.
An image segmentation and classification method was proposed by P S Karevelis et al.[6]. In this approach, segmentation is carried out using watershed transform which gives homologous regions. The errors are removed using a binary mask. Bayesian classifier is then used to classify regions. Karevelis and Dimitrios [7] improved the accuracy of classification in the above method, with the help of decorrelation stretching after segmentation. Decorrelation stretch is applied to enhance color differences in the image. Sreejini K S et al. [8] proposed an automated method for M-FISH chromosome segmentation and classification. Here, classification is done using Bayesian classifier, with mean and standard deviation of each region used as the feature vector. A post processing step reclassifies small (misclassified) segments to the most likely class of one of its neighbors. Results show that it has higher accuracy compared to pixel-by-pixel classification.
Least-Angle Regression (LARS). Homotopy method gives the highest accuracy among the three methods. SRC method has a higher classification ratio compared to other methods. Later, Jingyao Li et al. [11] combined structural information along with Sparse Representation which outperforms the above method.
A Fazel et al.[12] proposed Gaussian Mixture Model (GMM) which is a weighted sum of Gaussian probability density functions, which is capable of providing a more flexible, and thus possibly, a more accurate model of the M-FISH image data. Results show that it has improved performance in comparison with pixel-by-pixel classification. Sampat et al. [13] described different methods like maximum likelihood, nearest neighbor and k-nearest neighbor methods for classification. Among these methods, k-nearest neighbor (with k = 7) has the highest accuracy.
P S Kareveliset al. [14] presented a Semi-unsupervised classification method. For the set of M-FISH images, a feature vector is extracted by checking the presence/absence of chromosome pixels in each image. Classification is done using k-means algorithm with a labeling chart. The problem is modeled as a 25 class problem. Yu-Ping Wang and A. K. Dandpat [15] used FCM algorithm for classification. Accuracy is further increased with data normalization, which is done using image registration and color compensation. Hongbao Cao et al. [16] improves Adaptive FCM (AFCM) algorithm (which uses gain field as proposed by Pham and Prince [17, 18] for MRI images). Improved AFCM uses a new objective function which is more effective in controlling the shape of the gain field. Improved AFCM has lower error rate and this method avoids large differential equations. Lijiya A et al. [19] use median and low pass filters to remove noise. A dilation operation follows, which reduces intensity inhomogeneities. Then three different methods are carried out in order to segment the image. By Majority voting on the three methods, the best method is selected. Classification is carried out using FCM. Results show that FCM algorithms outperform pixel-by-pixel classification technique.
Karyotyping needs very high accuracy, and it is observed that fuzzy logic algorithms have higher accuracy compared to other methods. Also, fuzzy classifiers are unsupervised. This paper uses the concept of fuzzy logic classification. The proposed algorithm uses FCM with labeling chart for classification. The algorithm has been tested on an M-FISH database.
The rest of the paper is organized as follows: M-FISH Image Segmentation is discussed in Section 3, and classification of chromosomes is presented in Section 4. Section 5 introduces the reclassification algorithm. The Section 6deals with the comparative study of results. And finally the approach is concluded in Section 7.
3.
M-FISH IMAGE SEGMENTATION
M-FISH image segmentation is carried out using spatial FCM algorithm, which uses a new objective function that gives equal importance to fuzzy membership and spatial relationship [20]. This is used because in M-FISH images neighboring pixels are correlated. For a pixel, if it has highly correlated neighbors,there is a very high chance that this pixel and neighboring pixels of the same value belong to the same cluster. Segmentation using spatial FCM is highly accurate.
4.
M-FISH IMAGE CLASSIFICATION
Classification correctly identifies and marks each chromosome pixel as one of the 24 (22 plus sex chromosomes) chromosomes.
[image:2.612.317.541.248.680.2]Classification is done using standard FCM algorithm [21, 22]. Classification problem is modeled as a 24 class problem (22 pairs of autosomes and 2 sex chromosomes). The feature vector is constructed from a set of six M-FISH images. Pixels from the same position at all six images are extracted. If it is a chromosome pixel then the value of the corresponding field in the feature vector is marked as 1, and otherwise 0. Feature vector extraction is carried out for all chromosome pixels. A standard FCM algorithm is run on the extracted feature vectors.
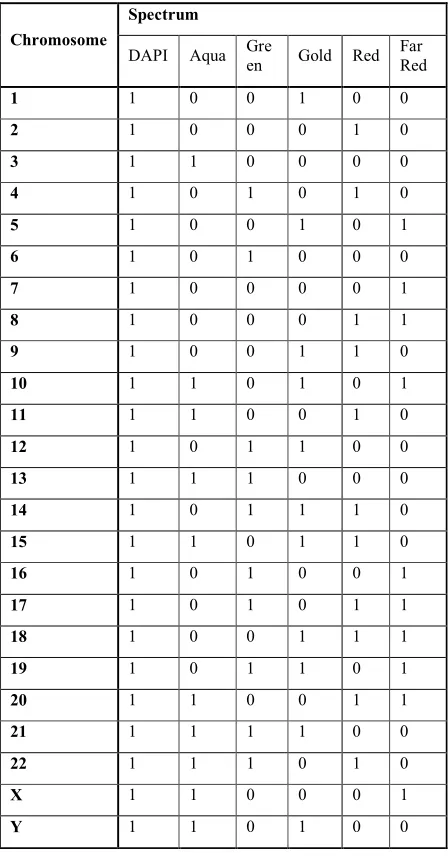
Table 1.Chromosome labeling chart for Vysis M-FISH probe
Chromosome
Spectrum
DAPI Aqua Gre
en Gold Red Far Red
1 1 0 0 1 0 0
2 1 0 0 0 1 0
3 1 1 0 0 0 0
4 1 0 1 0 1 0
5 1 0 0 1 0 1
6 1 0 1 0 0 0
7 1 0 0 0 0 1
8 1 0 0 0 1 1
9 1 0 0 1 1 0
10 1 1 0 1 0 1
11 1 1 0 0 1 0
12 1 0 1 1 0 0
13 1 1 1 0 0 0
14 1 0 1 1 1 0
15 1 1 0 1 1 0
16 1 0 1 0 0 1
17 1 0 1 0 1 1
18 1 0 0 1 1 1
19 1 0 1 1 0 1
20 1 1 0 0 1 1
21 1 1 1 1 0 0
22 1 1 1 0 1 0
X 1 1 0 0 0 1
Y 1 1 0 1 0 0
A fluorescent microscope with multiple optical filters captures an M-FISH image. Use of a particular dye for a particular image, makes some of the chromosomes visible in the image. Five different dyes are used to produce five different images, and each image will have a different combination of visible chromosomes. A sixth dye (DAPI) produces an image in which, all chromosomes are visible. All pairs of chromosomes can be uniquely represented in a labeling chart as a six dimensional vector, depending on the visibility of that pair in these six images. If a chromosome is visible in an image, then the corresponding field in the vector is marked as 1, otherwise 0. The list of vectors corresponding to all chromosomes constitutes the labeling chart. Table 1 represents the labeling chart for Vysis M-FISH probe.
5.
RECLASSIFICATION
Misclassification of pixels in M-FISH images can occur due to various reasons like electronic noise, chromosomal overlap, weak intensity at chromosome perimeter and weak staining of centromeres and telomeres.
From the study of size and structure of chromosomes and individual regions in the segmented image, the following were observed:
1. A region is a cluster of chromosomes, if the total number of pixels in it is greater than 4% of the total chromosome pixels. Within this region, if the pixel-count of a particular chromosome is less than 1% of the total pixel-count of the region, then those pixels will be error pixels.
2. The ratio of the largest chromosome to the smallest chromosome is about 9:1. Therefore, if pixels of chromosome icomprise 95% (90% + 5% for error) of pixels in a region, then that complete region can be marked as chromosome i. Note: A set of pixels (classified as a particular chromosome) will be marked as error iff there exists two other sets of pixels (classified as the same chromosome) which do not fall into categories 1 and 2 above.
From the above observations a Reclassification algorithm is proposed in Algorithm 1.
Algorithm 1: ReclassificationAlgorithm
1. Select the Segmented DAPI Image, and find all the regions in it.
2. For each region, calculate the number of pixels marked as chromosome i (i = 1..24).
3. If no of pixels in a region is > 4% of the total number of chromosome pixels then
a. the region consists of more than one chromosome. b. within the region, set pixels classified as chromosome i (i=1..24) as error pixels, if they form < 1% of the total number of pixels in that region.
4. Else
a. within the region, set pixels classified as chromosome i (i=1..24) as error pixels, if they form < 5% of the total number of pixels in that region
5. If a region comprises entirely of pixels classified as a single chromosome (without considering pixels marked as error, if any) then mark that region as classified.
6. Find all pairs of classified regions which have same chromosomes. Mark those chromosomes as identified. 7. If an identified Chromosome is present in a non-classified region, then set them as error pixels.
8. Repeat steps 5 through 7 until no more chromosomes can be identified.
9. Classify error pixels to the nearest chromosome pixel.
6.
RESULTS
M-FISH images from an M-FISH database [23] of 45 cells were tested, and the results of image classification were compared over the standard FCM algorithm, modified FCM algorithm and the proposed reclassification algorithm. M-FISH image classification is carried out using standard FCM and modified FCM algorithms. The value of fuzziness index was taken as 2. The performance is measured as classification ratio (CR), which is given by
= # ℎ
# ℎ
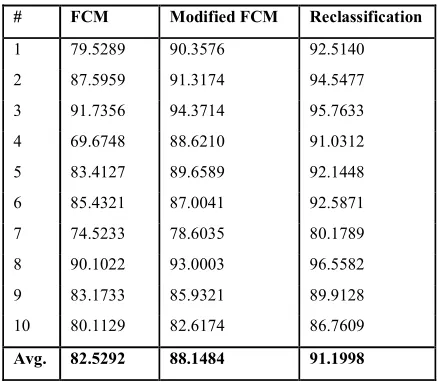
[image:3.612.319.538.456.647.2]Table 2 shows comparison of CR between the two classification algorithms and the reclassification algorithm. Results indicate that modified FCM improves standard FCM in terms of CR. And reclassification algorithm further improves CR.Table 3 comparesthe accuracies of the proposed method and the existing works in M-FISH image classification using FCM classifier. It is observed that the proposed method hasa higher accuracyamong FCM based classifiers. Table 4 shows the comparison of the accuracy figures of proposed method and non-FCM based classifiers.It is seen that the proposed method gives results that are more accurate than the other methods.
Table 2. Classification Results using FCM, Modified FCM and Reclassification
# FCM Modified FCM Reclassification
1 79.5289 90.3576 92.5140
2 87.5959 91.3174 94.5477
3 91.7356 94.3714 95.7633
4 69.6748 88.6210 91.0312
5 83.4127 89.6589 92.1448
6 85.4321 87.0041 92.5871
7 74.5233 78.6035 80.1789
8 90.1022 93.0003 96.5582
9 83.1733 85.9321 89.9128
10 80.1129 82.6174 86.7609
Table 3. Comparison of accuracy of FCM based classifiers
Methods Accuracy (%) #Image-sets
Hyohoon Choi et al. [5] 88.00 10 Yu-Ping Wang and A.
K. Dandpat [15] 89.59 10
Lijiya A et al. [19] 90.70 10
Proposed Method 91.19 40
It is also observed that average number of iterations (about 7) required to minimize the objective function in the modified FCM algorithmis lesser when compared to that in the standard FCM algorithm (about 19). The output of standard FCM will vary (although small) with each execution, even when the same input image set is used, as the initial centroids are chosen randomly. But since the modified FCM algorithm uses a labeling chart for initial centroid selection, the output produced will be the same for all executions with a given input image set.
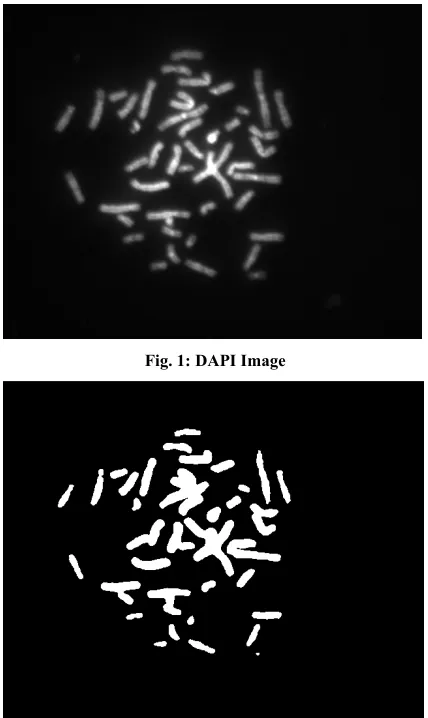
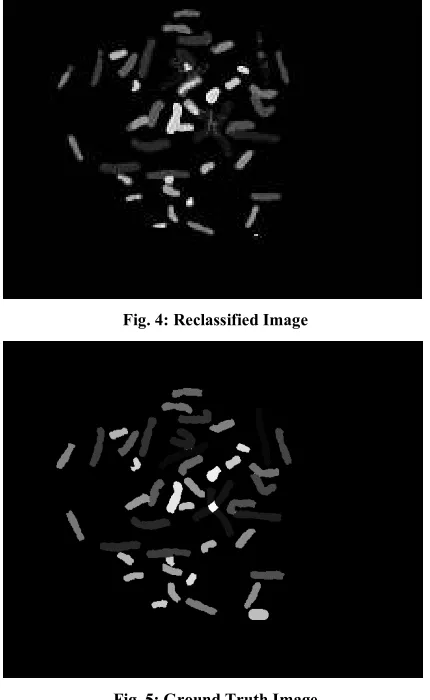
[image:4.612.78.289.83.171.2]The visual demonstration of the performance of the algorithm on the DAPI image is shown in Figures 1 to 5.Fig. 1gives the original DAPI image. Fig. 2 is the result of segmentation. Fig. 3 is the classified image. Fig. 4 is the result of running the reclassification algorithm on Fig. 3. The ground truth image is shown in Fig. 5.
Table 4. Comparison of accuracy of Non-FCM based classifiers and Proposed method
Methods Accuracy (%) #Image-sets
Yu-Ping Wang [4] 60.36 06
P S Karevelis et al. [14] 72.48 -- Karevelis and Dimitrios [7] 79.63 15 Sreejini et al. [8] 84.21 40 Hongbao Cao et al. [16] 88.50 20 A Fazel et al. [12] 89.17 06
Sampatet al. [13] 90.50 05
Proposed Method 91.19 40
7.
CONCLUSION
M-FISH technique is used for color karyotyping permitting simultaneous analysis of structural and numerical abnormalities of whole human chromosomes. Though there are a number of attempts to improve the accuracy of karyotyping, the performance is still constrained by the chromosome image quality. Classification of M-FISH images was carried out using the standard FCM algorithm and FCM algorithm with a labeling chart. The modified FCM algorithm is found to give better CR and to take lesser running time. Reclassification further improves the accuracy by 3%, by correctly classifying a few misclassified pixels
Fig. 1: DAPI Image
[image:4.612.73.293.394.552.2]Fig. 2: Segmented Image
[image:4.612.320.535.473.640.2]Fig. 4: Reclassified Image
Fig. 5: Ground Truth Image
8.
REFERENCES
[1] T. Ried, A. Baldini, T. C. Rand, and D. C. Ward. "Simultaneous visualization of seven different DNA probes by in situ hybridization using combinatorial fluorescence and digital imaging microscopy", Proc Natl Acad Sci U S A, 89(4):1388 – 1392, 1992.
[2] M. R. Speicher, S. Gwyn Ballard, and D. C. Ward. "Karyotyping human chromosomes by combinatorial multi-fluor FISH", Nature genetics, Vol. 12, No. 4. (April 1996), pp. 368-375.
[3] M. P. Sampat, K.R. Castleman, and A.C. Bovik. "Pixel-by-pixel classification of MFISH images", In Engineering in Medicine and Biology, 2002. 24th Annual Conference and the Annual Fall Meeting of the Biomedical Engineering Society EMBS/BMES Conference, 2002. Proceedings of the Second Joint, volume 2, pages 999 – 1000, 2002.
[4] Yu-Ping Wang. "M-FISH image registration and classification", In Biomedical Imaging: Nano to Macro, 2004. IEEE International Symposium on, pages 57 – 60, April 2004.
[5] Hyohoon Choi, K.R. Castleman, and A.C. Bovik. "Joint segmentation and classification of M-FISH chromosome images", In Engineering in Medicine and Biology Society, 2004. IEMBS ’04. 26th Annual International
Conference of the IEEE, volume 1, pages 1636 – 1639, September 2004.
[6] P.S. Karvelis, D.I. Fotiadis, A. Tzallas, and I. Georgiou. "Region Based Segmentation and Classification of Multispectral Chromosome Images", In Computer-Based Medical Systems, 2007. CBMS ’07. Twentieth IEEE International Symposium on, pages 251 – 256, June 2007.
[7] P.S. Karvelis and D.I. Fotiadis. "A region based decorrelation stretching method: Application to multispectral chromosome image classification", In Image Processing, 2008. ICIP 2008. 15th IEEE International Conference on, pages 1456 – 1459, October 2008.
[8] Sreejini K S, Lijiya A, V K Govindan, “M-FISH Karyotyping – A New Approach Based on Watershed Transform,” International Journal of Computer Science, Engineering and Information Technology (IJCSEIT), vol. 2, pp. 105-117, 2012.
[9] Yu-Ping Wang; Dandpat, A.K., "Classification of multi-spectral florescence in situ hybridization images with fuzzy clustering and multiscale feature selection", Genomic Signal Processing and Statistics, 2006. GENSIPS '06. IEEE International Workshop on , vol., no., pp.95,96, 28-30 May 2006.
[10]Hongbao Cao; Hong-Wen Deng; Li, M.; Yu-Ping Wang, "Classification of Multicolor Fluorescence In Situ Hybridization (M-FISH) Images With Sparse Representation", NanoBioscience, IEEE Transactions on, vol.11, no.2, pp.111,118, June 2012
[11]Jingyao Li; Dongdong Lin; Hongbao Cao; Yu-Ping Wang, "Classification of multicolor fluorescence in-situ hybridization (M-FISH) image using structure based sparse representation model", Bioinformatics and Biomedicine (BIBM), 2012 IEEE International Conference on , vol., no., pp.1,6, 4-7 Oct. 2012. [12]A. Fazel, R. Derakhshani, and Yu Ping Wang.
"Classification of multicolor fluorescence in situ hybridization images using gaussian mixture models", 2006.
[13]M. P. Sampat, A. C. Bovik, J. K. Aggarwal, and K. R. Castleman. "Supervised parametric and non-parametric classification of chromosome images", Pattern Recogn. 38, 8 (August 2005), 1209-1223.
[14]P. Karvelis, A. Likas, and D.I. Fotiadis. "Semi unsupervised M-FISH chromosome image classification", In Information Technology and Applications in Biomedicine (ITAB), 2010 10th IEEE International Conference on, pages 1 – 4, November 2010.
[15]Y.-P. Wang and Ashok Kumar Dandpat. "Classification of M-FISH images using fuzzy C-means clustering algorithm and normalization approaches", In Signals, Systems and Computers, 2004. Conference Record of the Thirty-Eighth Asilomar Conference on, volume 1, pages 41 – 44, November 2004.
Macro, 2011 IEEE International Symposium on, pages 1442 – 1445, 30 2011-april 2 2011.
[17]D. L. Pham and J. L. Prince, “An adaptive fuzzy c-means algorithm for image segmentation in the presence of intensity inhomogeneities,” Pattern Recog. Lett., vol. 20, pp. 57–68, 1998.
[18]D. L. Pham and J. L. Prince, “Adaptive fuzzy segmentation of magnetic resonance images,” IEEE Trans.Med. Imag., vol. 18, no. 9, pp. 737–752, Sep. 1999.
[19]Lijiya A, Sangeetha M.K., and V.K. Govindan. "Segmentation and Classification of M-FISH Human Chromosome Images", In The second International Conference on Advances in Computing and Communications (ACC-2012), August 2012.
[20]Lijiya A, Sreejithlal G S, and Govindan V K. "M-FISH Image Segmentation Using Fuzzy Logic and Spatial Information", International Journal of Computer Science and Information Technology & Security (IJCSITS), Vol. 2, No. 6,Pages 1249{1253, December 2012.
[21]J.C. Dunn. "Some recent investigations of a new fuzzy partition algorithm and its application to pattern classification problems", In Cybernetics, pages 1 – 15, 1974.
[22]J.C. Bezdek. "Pattern Recognition with Fuzzy Objective Function Algorithms", Plenum, New York, 1981. [23]The ADIR M FISH Image Database.