Design and Development of a Sensor Sole for Stroke
Patients
N.Manikandan
Associate Professor School of Allied Health Science, Manipal University,Manipal-576104(KA), India
Sumit Chakraborty
School of Information Science Manipal University, LG-02,AB-5, MIT campus, Manipal-576104(KA), India
Pratik Shetty
School of Information Science Manipal University, LG-02,AB-5, MIT campus, Manipal-576104(KA), India
ABSTRACT
The paper presents an application of a wearable system capable of measuring the amount of pressure applied on different sections of the foot. The main aim of this system is to investigate a real time therapeutic feedback using the display obtained through the mobile phone for stroke patients. The analysis of pressure is done using piezoelectric force sensors (FlexiForce sensors). The sensors are mounted on various positions of the sole according to the pressure distribution under symptom-free feet [1].
General Terms
Hemiplegia, Neurological, Hemiparesis, Metatarsal, Threshold, Wireless
Keywords
Stroke, Weight bearing, Piezoelectric, RISC, Havard
1.
INTRODUCTION
Stroke is defined as a sudden neurological deficit caused by vascular lesion in the brain [2]. The Neurological function which are involved can range from mild motor deflect to gross involvement of various functions like Sensorimotor, Behavioral, Intelligence etc. The two main presentations after any hemorrhagic or ischemic stroke can be either hemiplegia or hemiparesis. Hemiplegia is total paralysis of the arm, leg and trunk on the same side of the body and Hemiparesis is partial weakness on one side of the body.
According to World Health Organization (WHO) 15million people suffer from Stroke worldwide and in each year 5million of these die and another 5million are permanently disabled. Stroke is the Third largest killer in INDIA after heart attack and cancer according to WHO. The diseases has turned out to be the most common cause of disability and with more than 70% survivors remain in vocationally impaired and more than 30% requiring assistance with activities of daily living.
The purpose of this project is to design, analyze and test a wearable system capable of measuring the amount of pressure applied in different section of the foot and transmit it wirelessly to mobile phone for display. The system will collect data in a standing position, over a long period of time. It will be built to be worn in shoe or sandal.
The main use of the system is to collect real time data from the sensors and compare the data with the threshold values and display it on mobile phone or computer.
The sensors will be embedded at first metatarsal, second metatarsal, lateral metatarsal, medial heeland lateral heel [1].
The objective of this project is to obtain the amount of pressure /weight borne by the patient in different areas of the foot. Once the area of abnormal weight bearing is identified,
the physical therapist will instruct the patient to bear the required amount of weight in the particular area thus helping the patient to improve the weight bearing in different areas of the foot. This required amount of the weight can be calculated according to the patient weight and can be used to set as the threshold level for the particular sensor.
The system will be tested on both normal people and stroke patients for accurate results. The testing will focus on the forces exerted on each piezoelectric sensor (FlexiForce sensors) that are placed on the sole. An android application will also be developed for displaying the real time sensors values along with the corresponding threshold values.
2.
LTERATURE REVIEW
Many researchers have shown interest in the field of designing shoes and platforms for training and treatment of patients who have problems in symmetrical weight bearing. They have carried out numerous laboratory experiments and field observation to meet the requirements of neurological and orthopedic condition like fracture of lower limbs, diabetics, strokes etc. Some of the researches are as followed:
S.J.Morris (2004) [3] developed a wireless on-shoe system for continuous monitoring of gait. His system included a sole with five different kinds of sensors which provided information about the motion, position as well as pressure distribution of the foot. However, cost of the system was more than twenty thousand rupees. Also, since the outputs generated were graphical it was not user friendly.
Timo J. Salpavaara, Jarmo A.Verho, Jukka O. Lekkala and Jouko E. Halttunen (2008) [4] worked on Embedded Capacitive Sensor System for Hip Surgery Rehabilitation.
They developed an embedded system to measure force between the foot and the insole of a shoe using a capacitive matrix sensor to train a hip surgery patient to apply a suitable force with his operated leg. However the use of capacitive sensors generated a drift during the initial hours of use. It would also limit the measurement over the entire foot. If large number of matrix sensors were to be used that would turn out to be costly.
Since the basic problem faced with capacitive sensors was with compression over a period of time and of drifts in the sensors. S.L. Partil, Madhuri A. Thatte, U.M Chaskar (2009)
[5]
developed a Planter Foot Distribution System Using FlexiForce Sensors. These ultra-thin piezoelectric sensors were designed for the purpose of measurement of the foot pressure.
these devices were low cost but it was based on mainly graphical display.
Nantawat Pinkam and Itthisek Nilkhamhang developed Wireless Smart Shoe for Gait Analysis with Automated Thresholding using PSO(2013)[7]. This system uses sensors and Xbee wireless protocol that is used for gait analysis. This system doesn’t show the proper weight distribution on the foot and it uses PCs to save the data.
The main aim of our project is to build a device that can be used for mainly posture analysis which would be cost effective, user friendly and can be easily interfaced with mobile phones (Android).
3.
METHODS AND PROCEDURE
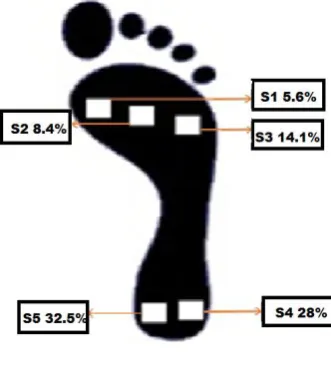
[image:2.595.61.227.344.531.2]According to the research the sensors are placed at first metatarsal, second metatarsal, lateral metatarsal, medial heel and lateral heel. The body weights are distributed equally between the two foots. The weight bearing in first metatarsal is 50% of 5.6% of body weight, the second metatarsal will bear 50% of 8.4% of body weight, the lateral metatarsal will bear 50% of 14.1% of body weight, the medial heel will bear 50% of 28.0% of body weight and the lateral heel will bear 50% of 32.5% of body weight [1]. The sensor placements on the sole are shown in following figure.
Fig 1: Sensor Placement on Sole
S1, S2, S3, S4 and S5 in Fig 1 represent five FlexiForce sensors.
The system is required to provide real time weight measurement of stroke patient in standing position over a period of time. The main components of this system are five FlexiForce sensors (for measuring weight), controller (for computation), bluetooth module (for wireless communication) and a mobile phone (for display).
Once the patient is made to wear the sole, the system will be turned ON. The pairing of mobile phone and Bluetooth module connected to the controller will take place. Once the pairing is completed the real time sensor values will be compared with threshold values calculated in controller and will be displayed on the mobile phone along with audio feedback.
The android application on the phone will have two modes:
1. Evaluation Mode
2. Training Mode
The physical therapist will have an option of selecting any one of the above modes.
In evaluation mode all the sensors will be turned ON and the values of all the sensors will be displayed on the mobile. If any of the sensor value is less or more then the threshold value then the physician can train the patient to apply adequate pressure on that part of foot and thus helping the patient to stand properly.
In training mode the physician will have an option of selecting a particular sensor and train the patient for that particular sensor only. Once the physician is satisfied with that particular sensor results then he can switch to another sensor and so on.
3.1
Hardware Environment
Equipment’s being used is listed as follows:
FlexiForce sensor ATMEGA328 controller
RN-42 Bluetooth module Android phone
3.1.1
FlexiForce Sensor
The FlexiForce sensors use resistive-based technology. The diameter of the sensing area of the FlexiForce sensor is 9.9mm.This sensor results in a change in the resistance is inversely proportional to the force applied. Five FlexiForce sensors will be present on the sole at different predefined positions and will measure the weight distribution on the foot of the patient. The data from the sensors will be feed to the controller.
Fig 2: FlexiForce Sensor
3.1.2
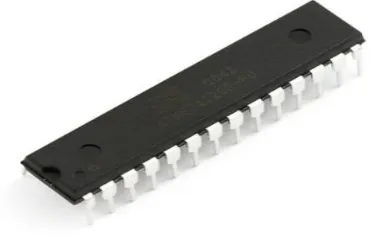
Atmega328 ControllerThe Controller used in the system is ATMEGA328 from Atmel Corp. The ATMEGA328 family is of 8bit, low-power microcontrollers. It has six sleep modes which is used to achive extended battery life in portable measurement applications. This controller supports 8-bit RISC CPU and it’s a Havard architecture. It is having 32x8 general purpose working registers.
[image:2.595.317.543.440.507.2]Fig 3: Atmega328 Controller
3.1.3
RN 42 Bluetooth Module
The Bluetooth Module RN42 is a small form factor, low power Bluetooth radio for adding wireless capability to the system. The RN42 delivers up to 3 Mbps data rate for distances to 20Meters.
The job of the bluetooth module is to transmit the real time weight information from sensors through the controller to the
[image:3.595.317.545.98.200.2]mobile unit wirelessly. This module will be connected to ATMEGA328 through UART pins.
Fig 4: RN 42 Bluetooth module
4.
BLOCK DIAGRAM AND
FUNCTIONAL SYSTEM
The model will have five sensors on the sole in the proposed areas and the data that is acquired from these sensors is fed into the microcontroller. The data is further processed and the analog data is converted into digital form and is send through the Bluetooth to android phone, where the weight bearing is been displayed against the threshold value.
[image:3.595.66.379.357.534.2]4.1 Functional Flowchart
Measure the weight of the patient on weighing machine
Power ON the device
Open android application on mobile phone
Pair the device with mobile through Bluetooth
Enter patient name, ID, Gender, Age, Weight etc.
Mode Selection
Evaluation Mode Training Mode
Select left or right foot.
Display all sensor values along with corresponding threshold values
Provide visual and audio indication if sensor values are less or more then threshold values
Exit Back
Select one of the five sensors
Compare selected sensor value with corresponding threshold value
Display selected sensor value
5.
RESULTS
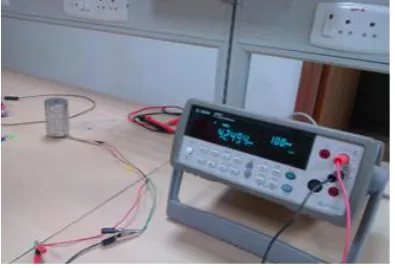
[image:5.595.64.271.135.514.2]The sensors were calibrated using precision multimeter and the results were obtained by applying known weights on the sensors. The graph shown below is the average of all the five sensors and the graph drawn is resistance vs. weight.
Table 1: Calibration Result
Kg Resistance
0.5 3.57
0.8 2.64
1.3 1.65
1.7 1.33
1.8 1.1
[image:5.595.69.267.571.705.2]Fig 6: Calibration Graph (Resistance vs. Weight)
Fig 7: Agilent Multimeter Used For Sensor Calibration
6.
CONCLUSION AND FUTURE WORK
The device was tested for several times and the system provided reliable readings on repetitive measurements. The FlexiForce sensors have repeatability < ± 2.5% of full scale which make these sensors more superior as compared to other sensors. This device will help the physical therapist to evaluate the weight asymmetry found in stroke patients and it will also pave the way towards training and rehabilitation of these patients ultimately leading to improvement in their quality of life. It can also be used to record the data in the server for future reference.
The future work includes creating GUI in android phone and displaying the threshold values and the obtained values from the sensors and their comparison using proper GUI.
7.
ACKNOWLEDGEMENT
We would like to acknowledge Ms. Sonia Khuranna (PhD Scholar in SCHOOL OF ALLIED HEALTH SCIENCES), Mr. Manjunath Maiya (SENIOR MANAGER in BOP), Mr. Harishchandra Hebbar (DIRECTOR OF SCHOOL OF INFORMATION SCIENCE), Mr. Mohan Kumar J (ASSISTANT PROFESSOR - SELECTION GRADE in SCHOOL OF INFORMATION SCIENCE) and Mr. Samarendranath Bhattacharya (ASSISTANT PROFESSOR in SCHOOL OF INFORMATION SCIENCE) for their prime inspiration to us to make this project a successful endeavor.
8.
REFERENCE
[1] Peter R. Cavanagh (Ph.D.), Mary M. Rodgers (Ph.D.), and Akira liboshi (M.S) 1989 “Pressure Distribution Under Symptom-Free Feet during Barefoot Standing”, By American Orthopaedic Foot and Ankle Society, Inc.
[2] O’Sullivan B. Susan, Thomas J. Schimitz, 2006, Physical Rehabilitation, Jaypee Brothers Medical Publishers Limited, 5th edition, page 705-708.
[3] Stacy J. Morris, Joseph A. Paradiso 2002, “Shoe- integrated sensor system for wireless gait analysis and real time feedback”, procrding of the second joint EMBS/BMES Conference, Houston TX, USA.
[4] Salpavaara Timo J., Jarmo A. Verho, Jukka O. Lekkala and Jouko E. Halttunen, 2008, “Embedded Capacitive Sensor system for Hip Surgery Rehabilitation: Online Measurment and Long term Stability”, 30th
Annual International IEEE EMBS Conference Vancouver, British Columbia, Canada.
[5] Patil S.L., Madhuri A. Thatte and U.M Chaskar, 2009, “Development of Planter Foot Pressure Distribution System Using Flexi Force Sensors”, Sensors and Transducers Journal vol. 108, pp. 73-79.
[6] Lim Zhi Yuan, Ong Chu Chung, Leong Wai Yie developed Designing of Foot Imbalance Scanning System ,2012, “Designing of Foot Imbalance Scanning System” 2012, International Symposium on Robotics and Intelligent Sensors.
[7] Nantawat Pinkam and Itthisek Nilkhamhang 2013, “Wireless Smart shoe for Gait Analysis with Automated Thresholding using PSO”, Electrical and Information Technology (ECTI-CON), 10th International Conference. 0
0.5 1 1.5 2 2.5 3 3.5 4
0 0.5 1 1.5 2
Resis
ta
nce
in M
o
hm
s
Weight in Kg