Munich Personal RePEc Archive
Floss (Free/Libre Open Source Software):
A Theme For Cultural Differences Study
Ramanujam, Padmanabha
Institute of Law and Economics and NLSIU
16 July 2007
FLOSS (FREE/LIBRE OPEN SOURCE SOFTWARE): A THEME
FOR CULTURAL DIFFERENCES STUDY
Ramanujam Padmanabha*
ABSTRACT:
Geert Hofstede presented statistical evidence purporting to identify intercultural
co-operation and its importance for survival in his scholarship work “cultures and
organizations”. This article presents a study, which describes how differences in national
culture can affect or influence the participation of programmers who produce open source
software (OSS). The four important dimensions of national cultures considered by
Hofstede model namely Power Distance Index (PDI), Individualism Index (IAV),
Masculinity-Feminity Index (MAS) and Uncertainty Avoidance Index (UAI) are selected
and correlated with the Geographical Distribution of Developers Index (GDD) for testing
the above hypothesis. It is suggested that there exists some correlation between the
cultural factors and the demographics of programmers who participate in the open source
movement. Finally, the manner in which these cultural factors impinge on the incentives
of the programmers who are engaged in open source movement by writing codes for free
are also discussed.
Key Words: Open Source Movement, FLOSS, Culture Difference and Hofstede Model
* The author is a Ph.D. candidate, specializing in Intellectual Property and Competition law at the Institute of Law and Economics, University of Hamburg (as part of Asia Link Program). The intended paper is a part of the Ph.D. thesis, the working title being “Law and Economics analysis of regulating technology platforms, with specific regard to computer software industry”. The Ph.D. thesis is supervised by Prof. Thomas Eger, Institute of Law and Economics, University of Hamburg, Germany.
I. INTRODUCTION
The terms free/libre or open source software refers to software products which are
distributed with the source codes under terms that allow users to: (i) use the software, (ii)
modify the software and (iii) redistribute the software in any comportment1 they like without requiring to pay the authors of the software a royalty or a fee for engaging in the
listed activities. In contrast, most commercial software is proprietary software, and is
distributed only with the object code so that competitors are prevented from reusing the
source code2to develop software.3From an economic point of view open source software production is viewed as a new radical process of producing software based on
unconstrained access to source code as opposed to traditional closed and property-based
approach of commercial world.4
In recent years there has been an enormous surge of interest in open source software
development, which involves developers from many different locations, organizations
and countries participating in the open source movement by sharing source code to
develop and refine computer programs. The transformation of production of software
from traditionally closed and property-based approach to open source production has
altered the basic nature of software industry from both the supply and demand side.5 On the supply side, fundamental changes have occurred in the development process, reward
mechanisms and distribution of development work and on the demand side, the
alternatives traditionally available to organizations to buy or build have been
supplemented with another credible alternative namely open source.6 The body of scholastic literature on open source is rapidly growing concentrating on the following
questions: (i) why do programmers write open source software’s for free? (ii) How do
1 See
, Joseph Feller et al., “Perspectives on Free and Open Source Software” (Cambridge: MIT Press, 2005) pp. xvi-xxxi.
2
The original format in which the software developers write software codes, which is easy for trained programmers to read and understand is referred to as source code.
3See
, Jhy-An Lee, “New Perspectives on Public Goods Production: Policy Implications of Open Source Software”, 9 Vand. J. Ent. & Tech. L. 45
4See
, Andrea Bonaccorsi & Cristina Rossi “Why Open Source Software can Succeed”, 32 Research Policy (2003), pp. 1243-1258.
5See
, Brian Fitzgerald, “The Transformation of Open Source Software”, MIS Quarterly Vol. 30 No. 3 pp. 587-598 (September 2006)
6
hundreds of programmers who are dotted around the world effectively co-ordinate with
each other to produce open source software in absence of any hierarchical structure? (iii)
How is it possible to increase the diffusion of new technology given the presence of well
established standard?
However, the question of asymmetrical distribution of developers amongst nation states
who participate in the open source movement has received very less or no attention at all
in the literature. This article tries to fill this gap by using Geert Hofstede model7, which is being extensively used in social psychology to study and understand the national and
organizational cultural differences. Drawing on Hofstede’s model this article tests the
hypothesis as to whether differences in national/regional culture affects or influences the
participation of programmers in producing Open Source Software. In other words, how
does national/regional cultural distance between nation states answer or influence the
distribution and participation of programmers in open source movement?
In Section II, this article evaluates the importance of open source movement by capturing
the market share of open source software, highlighting the policy implications of various
governments and finally by underlining the geographical distribution of developers who
participate in production of open source software. In Section III, this article introduces
Geert Hofstede model and its four important components namely Power Distance Index
(PDI), Individualism Index (IAV), Masculinity-Feminity Index (MAS) and Uncertainty
Avoidance Index (UAI). The four mechanisms for measuring cultural differences are
explained in detail from formation to application mode. In Section IV, this paper tests
the hypothesis using Geert Hofstede model by carrying out data analysis using well
established statistical measures and consequently discussing the results. Section V
concludes identifying the importance of this study and possible future extensions of this
study.
7
II. IMPORTANCE OF OPEN SOURCE MOVEMENT (OSM)
FLOSS MARKET SHARE:The open source movement taking shape of creative commons8 has been very successful in developing software products like Linux, Apache and
Sendmail, which are now serious competitors to conventional proprietary software’s.
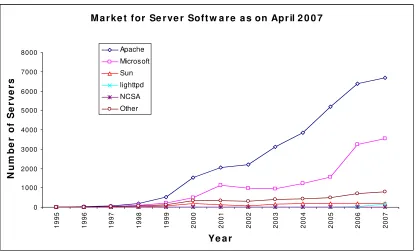
Apache web server is a leading open source project and accordingly delivers majority of
web pages viewed by internet users around the world. As per the most recent survey by
Netcraft9 more than 60 percent of total servers employ Apache, rather than commercial alternatives from Microsoft and other firms (see, Figure I). During June 2007, the
[image:5.612.93.510.310.561.2]survey expanded the graph of server software publishers to include Google10.
Figure I: Market for Server Software*
M a r ke t for Se r ve r Soft w a r e a s on Apr il 2 0 0 7
0 1000 2000 3000 4000 5000 6000 7000 8000 1 9 9 5 1 9 9 6 1 9 9 7 1 9 9 8 1 9 9 9 2 0 0 0 2 0 0 1 2 0 0 2 2 0 0 3 2 0 0 4 2 0 0 5 2 0 0 6 2 0 0 7
Ye a r
N u m b e r o f S e r v e r s Apache Microsoft Sun lighttpd NCSA Other
* Source: Netcraft Web Server Search
8
Creative commons is a non-profit organization dedicated to free disseminations of copyrighted works, which attaches a notice to books and other materials that it distributes stating that, while users are free “to copy, distribute, display and perform the work”; See, Catherine L. Fisk, “Credit Where Its Due: The Law and Norms of Attribution”, 95. Geo. L. J. 49
9See
, http://news.netcraft.com (last visited on June 25, 2007)
10
Linux11 which is an open source operating system has garnered much of the commercial investment in the open source approach. In 1991, about ten people were using and
modifying Mr. Torvald’s original 10,000 lines of code; today there are an estimated
seven million people using Linux and the code has grown to approximately 1.5 million
lines.12 Accordingly this open source operating system covers nearly 23 percent of the sever operating system market.13 Furthermore Linux is rapidly outstripping Microsoft’s Windows program as the operating system most frequently embedded into products
ranging from mobile phones to video recording devices.14
The open source projects namely Linux and Apache have forced proprietary softwares to
respond vigilantly to ever-increasing commercial interest in the open source approach.
The Forrester15 research finds that European firms have been actively adopting open source software over the last two years, and the overall share of companies using such
systems amounted to 40 percent. The IDC’s 2005 Western European Software End-User
Survey of 625 firms also shows a significant increase in use, with over 40 percent
showing “significant, some or limited” use of open source in operating systems sector
and nearly 60 percent showing considerable use of open source in databases. The IDC
survey was followed by the European Commission study16 on the economic impact of FLOSS on the European ICT sector. This study ascertains that open source software is of
great importance to the digital industry in Europe and several other parts of the world. It
recapitulates that open source software’s have considerable market share in several fields,
11
In 1991, a young Finish student named Linus Torvalds shared with the world his operating system “kernel”. Torvalds openly shared the source code of his kernel and eventually decided to license the project using the open source GPL. Programmers across the globe became interested in Torvalds kernel and integrated it with existing programs to create a complete functioning operating system-GNU/Linux popularly known as Linux.
12 See
, Patrick K. Bobko, “Linux and General Public Licenses: Can Copyright Keep ‘open Source’ Software free?” 28 AIPLA Q.J. pp. 81-85 (2000)
13See
, Josh Lerner and Jean Tirole, “The Economics of Technology Sharing: Open Source and Beyond”, Journal of Economic Perspectives Volume 19 (2) pp. 99-120 (2005)
14See
, Matthew D. Stein, “Rethinking UCITA: Lessons From The Open Source Movement”, 58 Me. L. Rev. 157 (2006)
15See
, Forrester Study on OSS at http://forrester.com/Research/Document/Excerpt/0,7211,34231,00.html
(last visited on June 27, 2007)
16
including web servers and operating systems. The report further determines that the
existing base of quality FLOSS applications with reasonable quality control and
distribution would cost firms almost Euro 12 billion to reproduce internally and this code
base is being doubled every 18-24 months over the past eight years. The notional value of
Europe’s investment in FLOSS software today is Euro 22 billion (36 billion in the US)
representing 20.5% of total software investment (20% in the US).17
The EU study18 also shows that there has been considerable increase in the use of open source software in Asian countries19. In Japan, Linux servers have mainly been adopted by the insurance and services sector, however the adoption of the Linux on the desktop is
much lower than the respective rates for servers. In Malaysia, the EU report identifies
that 74 percent of the public sector organizations implement open source solutions. In
China, 80 percent of the Chinese organizations use open source solutions.20
POLICY IMPLICATIONS OF OSS: Stephen Walli21 in his report demonstrates that a majority of U.S. companies and government institutions are turning to open source
software instead of using commercial software packages. Accordingly Jhy-An Lee22 in his scholarship provides empirical evidence as to how governments around the world
have begun to think about both fostering the use of OSS in private sectors and
encouraging OSS in public sectors by adopting various legislative and administrative
strategies, which support development of OSS. In his empirical work he scrutinizes that
as of September 4, 2006; at least forty-four countries have undertaken administrative or
17
Ibid at 46
18
Ibid at 25
19
According to IDC report for OSDL, Linux accounted for 14 percent of servers and 5 percent PCs in 2004 and is expected to grow to 25 percent and 9 percent respectively by 2008.
20
ICBS, which is China’s biggest bank serving 100 million individuals and 8.1 million corporate accounts through 20,000 branch offices across China, is assessing applications hosted on Linux servers on a daily basis.
21See
, Stephen Walli, Dave Gynn and Bruno Von Rotz, “The growth of software in organizations” (Boston: Optaors Publications, 2005); See also, Luc Hatlestad, “LinuxWorld Showcases Open Source Growth, Expansion” (http://www.informationweek.com/story/showArticle.jhtml) (last visited on June 27, 2007). Phillips' keynote of the tradeshow was most remarkable. He outlined how much Oracle has come to depend on Linux, and how the company plans to keep developing and deploying the technology, primarily in its grid-computing initiatives. Phillips also said open source experienced 32 percent unit growth and 31 percent revenue growth in 2004 as it began to move more deeply into the data center.
22
legislative action in support of OSS development. These countries are geographically
dispersed on different continents. Out of forty-four countries which have undertaken
pro-OSS government policies, thirty three have had pro-OSS-friendly policy announcements,
eighteen have had OSS legislative action23 and twenty countries have allocated public subsidies24 for OSS development with considerable overlapping in both legislative and administrative actions. Even though different countries OSS policies have varying
implications, the penchant to support OSS has become an international phenomenon.
DEMOGRAPHICS OF OSS DEVELOPERS:The combined FLOSS (MERIT) and
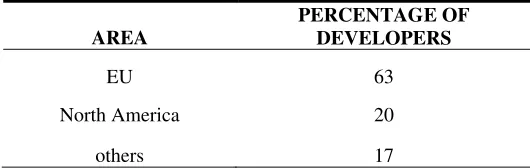
FLOSS-US (Stanford) report25 was the first of its kind to document the geographical distribution of developers. According to this survey more than three fifth of the worldwide FLOSS
developer community live in the EU, one fifth in North America and another one fifth or
[image:8.612.131.396.374.458.2]so live in other countries (see,Table I).
Table I: Geographical distribution of Developers (FLOSS Survey)*
* Source: International Institute of Infonomics, University of Maastricht and Berlecon Research
23
Brazil has led the way in global regulation movement toward requiring government use of OSS. The national legislatures of Belgium, Bulgaria, Chile, Colombia, Costa Rica, France, Italy, Peru, Spain and Ukraine also have bills mandating the use of OSS in all government offices and government owned companies; See, Jyn-An Lee, Supra note 3, at 61. The Bundestag of Germany passed a resolution regarding “Germany’s Economy in the Information Society” on November 9, 2001, promoting the use of OSS in the federal administration; See, David S. Evans & Bernard J. Reddy, “Government Preferences for Promoting Open Source Software: A solution in search of a Problem”, 9 Mich. Telecom. Tech. L. Rev. 313 at 322-23 (2003).
24
Governments provide tax deductions or other grants to indirectly subsidize OSS projects. For example Singapore government has offered economic incentives, such as tax breaks for Linux related projects; See, Evans and Reddy, Ibid, at 378. Governments may also in encouraging OSS projects subsidize institutions or projects that co-ordinate OSS development or OSS adoption. For example, BerliOS, a mediator for OSS developers and customers, is co-funded by German federal government and private companies; See Klaus M. Schmidt & Monika Schnitzer, “Public Subsidies for Open Source? Some Economic Policy Issues of the Software Market”, 16 Harv. J. L. & Tech. 473 (2003).
25
See, Rishab Ghosh et al., “Free/Libre and Open Source Software: Survey and Study”, the document is available at http://www.infonomics.nl/FLOSS/report/ (last visited June, 27, 2007)
AREA
PERCENTAGE OF DEVELOPERS
EU 63
North America 20
It is pertinent to note that surveys are not in every respect the precise method for
determining geographic distribution of OSS developers as they are unsystematic samples
which could have been subject to geographical biases.26 Accordingly the EU study adopted the “census-type” approaches27 by capturing the IP address of developers, which are physical Internet numbers mapped to geographical locations. SourceForge.Net28, the world’s largest portal for OSS development was considered for determining the
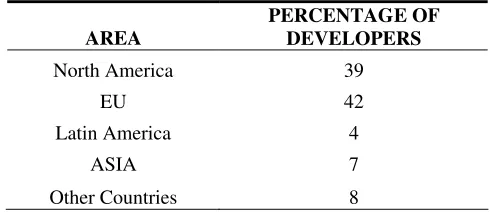
demographic distribution of developers. According to this study thirty nine percent of the
developers who participate in OSS development are from North America, four percent of
the participants are from Latin America, seven percent of the participants are from Asia,
forty two percent of the participants are from EU and eight percent of the participants are
[image:9.612.111.356.339.445.2]from other countries (see, Table II).
Table II: Demographics of OSS developers (EU Study)*
AREA
PERCENTAGE OF DEVELOPERS
North America 39
EU 42
Latin America 4
ASIA 7
Other Countries 8
*Source: EU Study on ICT Sector (January, 2007)
Although SourceForge.Net may under represent Asian participation in absolute numbers,
they nevertheless provide a precise depiction of the global influence on FLOSS
development from Asia.29 Moreover from an economic point of view it is useful to examine the supply of developers in global projects and portals such as SourceForge.Net
26See
, Jane Greenberg et al., “Open source software development and Lotka's law: bibliometric patterns in programming”, Journal of the American Society for Information Science and Technology Vol. 54 (2) (2003), pp. 169-178.
27
Census type approaches provide information on all case; see Supra note 16 at 37.
28
SourceForge.net which is owned by SourceForge, Incorporation world's largest OSS development web site, hosting more than 100,000 and over 1,000,000 registered users with a centralized resource for managing projects, issues, communications, and code. SourceForge.net has the largest repository of Open Source code and applications available on the Internet, and hosts more Open Source development products than any other site or network worldwide. SourceForge.net provides free hosting to Open Source software development projects; See, “What is SourceForge.Net?” at http://sourceforge.net/docs/about (last visited June 27, 2007)
29See
as they are good indicators of the population of globally active developers. From the
above explanations it is ascertainable as to why the data collated by the EU study is
selected for testing the very hypothesis of this paper.
III. GEERT HOFSTEDE’S THEORY ON NATIONAL CULTURES
IMPORTANCE OF STUDYING NATIONAL CULTURES: A key issue for organization
science for many years has been the influence of national cultures on organizational and
national behaviors.30 Individuals from different countries, generations, social class, jobs or organizations often think and act in ways, which puzzle others. What separates one
from another is the culture in which he or she has grown up. As Hofstede summarizes,
“culture in this sense is not the same as civilization; it encompasses much more deeply
rooted unconscious values”.31 Accordingly what some consider as normal is considered to be abnormal by others, as to what some consider polite is considered to be rude by
others and as to what is rational to some is irrational to others.
There are many ways to describe and define a culture. Ferraro32 in his scholarship defines culture in terms of its parts or its components to include economic system, the family,
education and the social control. Culpan33 talks about culture in terms of economy, polity, religion and family. For Hall and Hall34 culture is communication. This paper adheres to Hofstede’s definition on culture35, “Culture is the collective programming of the mind which distinguishes the members of one group or category of people from
another”. Culture in this sense is a collective phenomenon, because it is partly shared
with people who live or lived within the same social environment. Accordingly culture is
learned and not inherited. It derives from social environment and not from one’s genes.
30See
, Nancy J. Adler, “A Typology of Management Studies Involving Culture”, Journal of International Business Studies, Vol. 14 (2) (1984), pp. 29-47; See also, “Richard W. Wright et al., “A Cross-Cultural Comparative Study of Managerial Job Attitudes”, Journal of International Business Studies, Vol. 14 (2) (1983), pp. 115-129.
31 See
, Geert Hofstede, “Cultures and Organizations”, Supra note 7 at 2.
32
See, Gary P. Ferraro, “The Cultural Dimension of International Business”, (New Jersey: Prentice Hall, 1990)
33See
, R. Culpan, “Institutional Model of Comparative Management”, Advance International Comparative Management Vol. 6 (1991), pp. 127-142.
34
See, Edward T. Hall and Mildred Reed Hall, “Hidden Differences”, (New York: Anchor Press, 1987)
35See
Furthermore, Hofstede also distinguishes culture from human nature on one side and an
individual personality on the other. According to him human nature is what all human
beings have in common; it is inherited with one’s genes; the human ability to feel fear,
anger, love, joy, sadness, the need to associate with others, to play and exercise all
belongs to this level of mental programming. In what ways one expresses fear, joy and
happiness is tailored by culture. The personality of an individual on the other hand, is
his/her unique qualities which he/she does not share with any other human being. It is
based upon traits which are partly inherited with the individuals unique set of genes and
partly learned.
DIMENSIONS OF NATIONAL CULTURE: American anthropologists namely Ruth
Benedict (1887-1948) and Margaret Mead (1901-1978) popularized the message that all
societies, modern or traditional, face the same problems; only the answers differ.
Accordingly Alex Inkeles and Daniel Levinson36 published a broad survey of the English language literature on national culture. The survey suggested issues, which qualify as
common basic problems worldwide, with consequences for the functioning of societies,
of groups within those societies, and of individuals within those groups, namely: (i)
relation to authority (ii) conception of self, in particular: (a) the relation between
individual and society, and (b) the individual’s concept of masculinity and femininity (iii)
ways of dealing with conflicts.37
The four basic problems defined by Inkeles and Levinson and empirically found in the
IBM data38 formed the dimensions of cultures39 for Hofstede. Accordingly Hofstede named the dimensions as Power Distance (from small to large), Collectivism versus
36 See
, Alex Inkeles and Daniel Levinson, “National Character: The Study of Modal Personality and Socio-Cultural Systems”, in the Handbook of Social Psychology, 2nd edition, Vol. 4 (Reading MA: Addison-Wesley, 1954)
37See
, Geert Hofstede, “Cultures and Organizations”, Supra note 7 at 13
38
Hofstede studied the values of people in over 50 countries around the world, by collecting the survey data of individuals who worked in the local subsidiaries of one large multinational corporation IBM. From one country to another the survey almost perfectly matched the sample size. The individuals who participated in the survey are similar in all respects expect nationality, which makes the effect of nationality differences in their answers stand out unusually clear; See, Geert Hofstede, “Cultures and Organizations”, Supra note 7 at 13
39
Individualism, Femininity versus Masculinity and Uncertainty Avoidance (from weak to
strong) for his study.
1. Power Distance Index (PDI): According to Hofstede Power Distance40 is defined as “the extent to which the less powerful members of institutions41 and organizations42 within a country expect and accept that power is distributed unequally”. For measuring
the degree of inequality in society, Hofstede constructed the Power Distance Index for
each of seventy four and three regions from the IBM data. The PDI was calculated for
each country from the answers of IBM employees in the same kind of positions on the
same survey questions.43
The three survey questions used for creating the PDI index were: (i) how frequently, in
your experience do the following problem occur; employees being afraid to express
disagreement with their managers? (Answered by non-managerial employees, with mean
score on a 1-5 scale from ‘very frequently’ to ‘very seldom’) (ii) Subordinates perception
of their boss’s actual decision-making style (choices include description of an autocratic
or of a paternalistic style or none of these alternative) (iii) subordinates preference for
their boss’s decision-making style (percentage preferring autocratic or of a paternalistic
or on the contrary, a style based on majority vote).44 The PDI scores thus composed and because of the way they were calculated represents relative and not absolute positions.
In summary PDI scores inform us about dependence relationships in a country. In small
power distance countries there is limited dependence of subordinates on bosses and a
preference for consultation that is, interdependence between boss and subordinate.45 In large power distance countries there is considerable dependence of subordinates on
40See
, Geert Hofstede, “Cultures and Organizations”, Supra note 7 at 28
41
Institutions are the basic elements of society like family, school and the community.
42
Organizations are the places where people work.
43See
, Geert Hofstede, “Cultures and Organizations”, Supra note 7 at 23-29
44
A statistical procedure called factor analysis was used to sort the survey questions into groups, called factors or clusters for which mean scores or percentages appeared to vary together. This mean that if a country scored high on one questions from the cluster, it also could be expected to score high on the others, or not high but low for questions carrying the opposite meaning See, Geert Hofstede, “Cultures and Organizations”, Supra note 7 at 23-47
45See
bosses.46 Large power distance countries thus show a pattern of polarization between dependence and counter dependence. In these cases, the emotional distance between
subordinates and their bosses is large; subordinates are unlikely to approach and
contradict their bosses directly.47
2. Individualism Index (IDV): According to Hofstede this new dimension is defined as
follows, “Individualism pertains to societies in which the ties between individuals are
loose: everyone is expected to look after himself or herself and his or her immediate
family. Collectivism as its opposite pertains to societies in which people from birth
onwards are integrated into strong, cohesive in-groups, which throughout people’s
lifetime continue to protect them in exchange for unquestioning loyalty”.48
The survey questions on which individualism index was constructed was based on a set
of fourteen ‘work goals’, of which the most important work goals includes (i) Personal
time (whether the job leaves sufficient time for your personal and family life) (ii)
Freedom (whether the job leaves considerable freedom to adopt ones own approach to the
job) (iii) Challenge (whether the job includes challenging work to do) (iv) Training
(whether the job gives sufficient opportunities to improve and learn new skills (v)
Physical conditions (whether the job provides with good physical working conditions)
(vi) Use of Skills (whether the job fully uses ones skills and abilities).49 Although, the above questions from the IBM questionnaire do not totally cover the distinction between
individualism and collectivism in a society. The correlations of the IBM Individualism
country scores with non- IBM data about other characteristics of societies and countries
wealth50 confirm or validate the claims that this dimension from the IBM data, which covers seventy four countries and three regions, does, indeed, measure individualism.51
In summary IDV scores inform us about the prevalence of individual interest. The
countries with high IDV scores represent people living in societies, where individual
46
See, Geert Hofstede, “Cultures and Organizations”, Supra note 7 at 27
47See
, Geert Hofstede, “Cultures and Organizations”, Supra note 7 at 28
48See
, Geert Hofstede, “Cultures and Organizations”, Supra note 7 at 52
49See
, Geert Hofstede, “Cultures and Organizations”, Supra note 7 at 49-77
50
See, Geert Hofstede, “Cultures and Organizations”, Supra note 7 at 49-77
51See
interest prevails over the interests of the group and countries with low IDV scores
represent people living in societies where the interest of group prevails over the interests
of the individual. Even though, both the individualist and collectivist society are
integrated wholes, but the individualist society is loosely integrated and collectivist
society is tightly integrated.
3. Masculinity Index (MAS): Hofstede labeled this dimension as Masculinity and
Femininity because it was in this dimension that the men and women among the IBM
employees scored consistently different across fifty countries and three regions in the
IBM data.52 Based on the information about the distinctions between the societies this dimension is defined as follows, “Masculinity pertains to societies in which social gender
roles are clearly distinct (i.e., men are supposed to be assertive, tough and focused on
material success, whereas women are supposed to be more modest, tender and concerned
with the quality of life); femininity pertains to societies in which social gender roles
overlap (i.e., both men and women are supposed to be modest, tender and concerned with
the quality of life)”53.
In summary MAS scores informs us as to whether the societies try to minimize or
maximize the social sex role division. Hofstede explains societies with maximized social
sex role division “Masculine” and those with a relatively small sex role division
“Feminine”.54Although this index forms an integral part of Hofstede’s study, the present study finds the MAS index irrelevant for testing the hypothesis.
4. Uncertainty Avoidance Index (UAI): Hofstede defines Uncertainty avoidance as the
extent to which the members of a culture feel threatened by uncertain or unknown
situations.55 This was the fourth dimension of culture captured from the IBM project. Each country and region in this project was assigned UAI scores.
The UAI scores were computed with close scrutiny of following questions which
produced stable country differences, namely (i) Job Stress (mean score on a scale 1-5) (ii)
52See
, Geert Hofstede, “Cultures and Organizations”, Supra note 7 at 82
53See
, Geert Hofstede, “Cultures and Organizations”, Supra note 7 at 83
54
See, G. Hofstede, “The Cultural Relativity of Organizational Practices and Theories”, Supra note 7 at 85
55See
Agreement with the statement that company rules should not be broken (this question
was labeled ‘rule orientation’ with mean score on a scale 1-5) (iii) percentage of
employees expressing their intent to stay with the company for a long-term career.56Even though the interpretation of the association between questions 1-3 at the country level is
not logical, Hofstede assumes that all three questions are expressions of the level of
anxiety that exists in a particular society in the face of an uncertain future.57
In summary UAI scores informs us as to how society deals with the reality question of
future, because the future is unknown and uncertain. Accordingly, the countries with
weak UAI score socialize their members into accommodating the uncertainty and also
tend to accept each day as it comes. They will also take risks easily, they will not work
very hard, and they will be relatively tolerant of behavior and opinions; whereas in
countries with strong UAI scores societies socialize their people in trying to beat the
future, because the future remains essentially unpredictable. In these societies, there will
be a higher level of anxiety, emotional quotient and aggressiveness. It is also witnessed
that countries with large UAI scores have institutions that try to create security and avoid
risk.58 Furthermore in countries with strong UAI scores, societies find religions which claim absolute truth and there also a scientific tradition looking for ultimate and absolute
truths, as opposed to a more relativist and empiricist tradition.59
From the above study it becomes apparent, that although culture is integrated it is
identifiable by its logical components or dimensions. In this paper culture is viewed as a
key determinant of the values, preferences and beliefs of individuals and societies and,
consequently the argument persists that differences in these values, beliefs and
preferences play a key role in shaping up informal institutions. It is also reviewed by
Greif60 that different cultures generate different sets of beliefs and preferences regarding how people behave, which can alter the set of equilibrium for a given specification of
institutions. In the next chapter an attempt is being made to study as to what beliefs,
56
See, Geert Hofstede, “Cultures and Organizations”, Supra note 7 at 109-137
57See
, Geert Hofstede, “Cultures and Organizations”, Supra note 7 at 110
58See,
G. Hofstede, “The Cultural Relativity of Organizational Practices and Theories”, Supra note 7 at 83
59See,
G. Hofstede, “The Cultural Relativity of Organizational Practices and Theories”, Supra note 7 at 87
60
values or preferences allow programmers from a given country to participate in the open
source movement and what beliefs, preferences and values disallow programmers from
participating in the ever increasing market for OSS. In other words what components of
culture encourage participation in open source movement?
IV. FLOSS: A THEME FOR CULTURAL DIFFERENCES STUDY
DATA AND METHODOLODY: There are very few studies61 which have actually measured the cultural distance between countries with perceptible scores and the most of
the work in this area is survey based. I have selected the Hofstede model and accordingly
the scores computed in his model for more than one reason; firstly Hofstede’s work has
been the first of its kind and the most extensive one with persuasive conclusions covering
seventy four countries and eighty eight thousand survey samples; secondly, the
components or dimensions for measuring the cultural distance used by Hofstede has been
accepted by many scholars62 in the field of socio psychology; lastly the seventy four countries so studied and selected by Hofstede for different countries matches the EU
study on the demographic distribution of developers for different regions.
The scores for seventy four countries recognized by Hofstede’s study is selected,
analyzed and grouped into four regions encompassing thirty four countries by capturing
their mean averages. The four regions so grouped for this study includes; North America
(USA and Canada); Latin America (Argentina, Brazil, Chile, Costa Rica, Equador,
61 See
, Kluckhohn, F. and Strodtbeck, F., “Variations in Value Orientations”, (Illinois: Row Peterson Publishing Co., 1961); See also Ronen, S. and Shenkar, O., “Clustering Countries on Attitudinal Dimensions: A Review of and Synthesis”, Academy of Management Review 10(3) (1985) pp. 435–54; See also, Hall, E.T. and Hall, M.R. “Understanding Cultural Differences”(Massachusetts: Intercultural Press, 1990); See also, Schwartz, S.H., “Beyond Individualism/Collectivism: New Cultural Dimensions of Values”, in U. Kim, H.C. Triandis, C. Kagitcibasi, S.-C. Choi and G. Yoon (eds.) Individualism and Collectivism: Theory, Method, and Applications, (London: Sage Publications, 1994) pp. 85–119; See also Martha L. Maznevski et al., “Cultural Dimensions at the Individual Level of Analysis”, International Journal of Cross Culture Management, Vol. 2(3) (2002) pp. 275-295.
62 See
Guatemala, Mexico, Panama, Peru, Salvador, Uruguay and Venezuela); Europe
(Austria, Belgium, Denmark, Finland, France, Germany, Greece, Ireland, Italy,
Netherlands, Portugal, Spain, Sweden and United Kingdom) and Asia (India, Japan,
China and Korea). This method of grouping of scores is adopted for all four dimensions
and even though they may not represent the regions conclusive positions, it is argued that
the computed scores establish some relative positions as to the cultural distance across
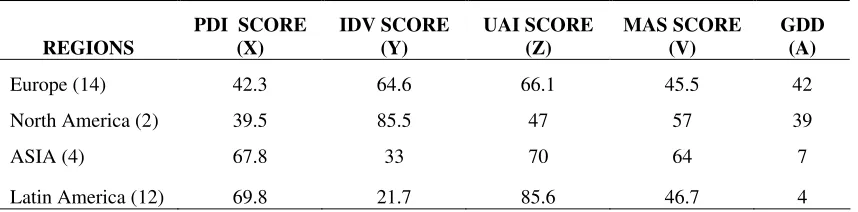
four regions (see, Table III). Accordingly the grouped data is then correlated with
[image:17.612.85.514.278.384.2]demographic63 distribution of developers.
Table III: PDI, IDV, UAI and MAS values for 4 Regions*
REGIONS
PDI SCORE (X)
IDV SCORE (Y)
UAI SCORE (Z)
MAS SCORE (V)
GDD (A)
Europe (14) 42.3 64.6 66.1 45.5 42
North America (2) 39.5 85.5 47 57 39
ASIA (4) 67.8 33 70 64 7
Latin America (12) 69.8 21.7 85.6 46.7 4
* Scores grouped and computed from Hofstede’s model
HYPOTHESIS: Cultural differences amongst the programmers from different regions lead
to measurable differences in their participation in the open source movement. In other
words national cultural differences influence the participation of programmers in
development of OSS.
National cultures distinguish similar people, institutions and organizations in different
countries. The present study demonstrates what dimensions of national culture affects or
influences the developers to participate in the open source development.
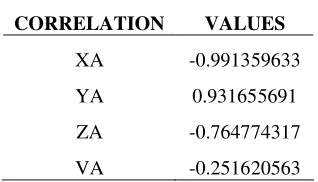
RESULTS: The Purpose of the study was to compare the geographical distribution of
developers from four regions with their respective scores on dimensions of culture. The
regions which score high on the PDI score low on programmer’s participation. In other
words the dimensions namely PDI and GDD tend be strongly negatively correlated
63See
(-0.99) (see, Table IV); the regions which score high on the IDV score high on the
programmer’s participation as well. In other words the dimensions namely IDV and GDD
are strongly positively correlated (0.93) (see, Table IV); the regions which score low on
UAI score high on the programmer’s participation. In other words the dimensions namely
UAI and GDD are strongly negatively correlated (-0.76) (see, Table IV); the relation
[image:18.612.113.272.238.329.2]between the MAS and GDD are ignored for discussion.
Table IV: Correlation Values
CORRELATION VALUES
XA -0.991359633
YA 0.931655691
ZA -0.764774317
VA -0.251620563
DISCUSSION: Previous researches on open source development have been very reluctant
to capture or provide answers for the disproportionately low degree of participation by
Asian and Latin American countries compared to Europe and North American countries
in the global open source projects. The present study contributes to this gap by directly
comparing the dimensions of cultural distance between regions which encourage
developers to participate in the open source development on regions with their relatively
low level of participation in the global open source projects. The most relevant
dimensions for understanding individual’s participation in open source movement are
Power Distance, Individualism and Uncertainty Avoidance index.
Power distance is considered as the most decisive dimension of culture measuring power
inequalities between regions across organizations and accordingly providing answer as to
what organizational set up is preferred for the prevalence of open source development in
the present study. Individualism and Uncertainty Avoidance index are important national
cultural dimensions for understanding the theories of motivation amongst the
programmers across the regions, which accordingly have a tendency to influence or affect
out below by studying each national cultural dimensions and its effect on the
participation of open source movement.
1. Organization Level (Power Inequalities): To explain the strong negative correlation
(-0.99) that exists between the power distance index and geographic distribution of
developers one needs to understand the organizational and work characteristics of
developing open source software.
The FLOSS survey64 on developers establishes that the development of open source software is not a matter of leisure work at home. Accordingly the survey broadly
classifies the pool of developers into employed and unemployed programmers. The
survey also makes available that fifty two percent of the open source software developers
also develop proprietary software. This finding is also consistent with the study of Karim
R. Lakhani65, which records that fifty eight percent of the programmers who participated in the survey were directly involved with the information technology industry. The
recently concluded EU study66 also makes an attempt to capture the contribution coming from organizational level which includes software companies, universities, foundations
and development groups. What is perhaps predictable and consistent with the above
findings and study is that, large amount of contribution to the open source development
are coming from organizations be it software companies, universities, foundations or
developmental groups.
From the above discussion it becomes more important to understand as to what
organizational set up motivates programmers to participate in the open source movement.
Many studies67 have concluded that, although open source projects display a setup of hierarchical organization, there seems to be no direction from the entrepreneurs towards
64See
, Supra note 25
65See
, Karim R. Lakhani and Robert G. Wolf, “Why Hackers do what they do” in Perspectives on Free and Open Source Software, edited by Joseph Feller et al., (Massachusetts: MIT Press, 2005); See also, Karim R. Lakhani and Eric Hippel, “How Open Source Software Works: Free User-to-User Assistance”, 32 Research Policy 923 (2003)
66See
, Supra note 16 at 51
67See
the agents, on the contrary what happens in the open source paradigm is that the role
within the hierarchical organization are not strictly assigned and enforced. In other words
it looks like FLOSS developers enjoy to work independently in a highly modularized
self-organizing structure where the hierarchical system is just an inequality of roles,
established for convenience. This production and distribution of OSS, where large
numbers of programmers invest their time in developing the software and who are
generally not paid for the work and take no directions from their entrepreneurs provide
interesting notions to the conventional theory of firm68.
What culture dimensions influence such organizational set-up? It is argued that the power
distance dimension provides us with some direction in finding the answer. In summary
the PDI scores at the work place inform us about dependence relationships prevalent at
the organizational level in a country. In large power distance situation superiors and
subordinates consider each other as existentially unequal; the hierarchical system is felt to
be based on this existential inequality. In small power distance situation subordinates and
superiors consider each other as existentially equal; the hierarchical system is just an
inequality of roles, established for convenience. The present study provides us with some
results to this extent. From the results it very clear that the countries within EU and North
American region supply more number of programmers to participate in the open source
development compared to countries in regions Asia and Latin America. In other words
the regions which score high on the power distance score low on programmer’s
participation and vice-versa (see, Table III).
From this study it can be understood that the prevalence of strong power distance (culture
dimension) in the hierarchical organizational of countries does not encourage
programmers to participate in the open source movement and further they would end up
68
depressing the intellectual, aesthetic and pleasure based motivation, which seems intrinsic
and driving factors for the programming community to participate in the open source
movement. From this we get to culture dimensions which influence the motivational
factors of programmers and accordingly persuade the participation in the open source
movement.
2. Individual Level (Motivational Factors): In proprietary software development, profits
provide a sufficient incentive to innovate, which does not exist in the open source
community. So why do programmers write open source software’s for free? There has
been a growing body of literature69 which demonstrates that software developers have sufficient incentives or rewards to participate in OSS development. Following the
theoretical perspectives of Maslow70, the incentives to participate in the open source movement has been classified to include intrinsic71 and extrinsic motivation72. Having fun or enjoying one-self when taking part in an activity is at the core of the idea of
intrinsic motivation.73 Accordingly, Jurgen Bitzer74 et al., study show how intrinsic
69 See
, Alexander Hars and Shaosong Ou, “Working For Free? Motivations for Participating in Open Source Projects”, 6 Int’l J. Electronic Comm. 25 (2002) (this paper categorizes internal and external motivations through a survey research) ; See also, Guido Hertel et al., “Motivation of Software developers in Open Source Projects: An Internet-Based Survey of Contributors to the Linux Kernel”, 32 Research Policy, pp. 1159-1177 (2003) (the paper explores the motives of 141 contributors to the Linux kernel);See also, Justin Pappas Johnson, “Open Source Software: Private Provision of Public Good”, 11 Journal of Economy and Management Strategy 637 (2002) (this papers shows why programmers participate in OSS development using economic models); See also Karim R. Lakhani and Eric Hippel, “How Open Source Software Works: Free User-to-User Assistance”, 32 Research Policy 923 (2003); See also Josh Lerner and Jean Tirole, “Some Simple Economics of Open Source”, 50 Journal of Industrial Economics 197 (2002) (this paper captures signaling incentives and motives behind OSS development); See also, Andrea Bonaccorsi and Cristina Rossi, “Why Open Source Software can Succeed”, 32 Research Policy 2003, pp 1243-1258
70 See
, Maslow. A. H., “Motivation and Personality” 2nd edition (New York: Harper, 1970); See also, Deci, E.L., “Effects of Externally Mediated Rewards on Intrinsic Motivation”, Journal of Personality and Social Psychology, Vol. 18 (1971) 105-115; See also, Deci. E.L., “Intrinsic Motivation, Extrinsic Reinforcement and Inequality”, Journal of Personality and Social Psychology, Vol. 22 (1972) 113-120; See also, Dyer. L. and Parker D. F., “Classifying Outcomes in Work Motivation Research: An Examination of the Intrinsic Extrinsic Dichotomy”, Journal of Applied Psychology, Vol. 2 (1975), 455-458; See also, Lawler. E. E., “Job Design and Employee Motivation”, Personnel Psychology, Vol. 22 (1969), 426-435.
71
Intrinsic rewards are obtained when activities are “engaged in for their own sake or when activities are engaged in for includes no apparent reward except the activity itself”; See, Murray. E.J., “Motivation and Emotion” (New Jersey: Prentice Hall,1964) at 64
72
Extrinsic rewards, on the other hand, are those rewards for which “there is no inherent connection between the activity and the reward”; See, Supra note 71 at 64
73See
, Deci, E.L., “Effects of Externally Mediated Rewards on Intrinsic Motivation”, Supra note 70 at 114
74
motives play value or homo ludens payoff and gift culture benefits play a very important
role in the development of open source software.
What culture dimensions encourage such intrinsic motives in an individual? It is argued
that there seems to be some connection between the factors of motivation and the
Individualism dimension of culture. In summary IDV scores inform us about the
prevalence of individual interest. This is also discernible from our study; the highest
number of programmers stem from countries within regions, where individuals find a
need to full fill their obligations towards themselves (see, Table III).
Other cultural dimensions relevant for discussing factors of motivation are Uncertainty
avoidance index. Uncertainty avoidance originally deals with a society's tolerance for
uncertainty and ambiguity; it indicates to what extent a culture programs its members to
feel either uncomfortable or comfortable in unstructured situations. Countries with low
UAI scores tend to let people to achieve something by giving them challenges and
enriching their jobs if they contain no challenges. The idea of achievement implies two
things: a willingness to take some risks and need to perform, which are basically drawing
factors of UAI scores. Interestingly the present study finds that countries with low UAI
score tend to encourage programmers to participate in open source movement and
vice-versa (see, Table III). From the above discussion it can be suggested that there exists
some relationship between the cultural factors and the demographics of programmers
who participate in the open source movement.
LIMITATIONS AND OBSERVATIONS: The present study has several limitations that
should be considered when interpreting the results. The index so constructed for four
different regions is a rather simplistic aggregate of Hofstede’s scores on thirty two
countries and hence are subject to same criticisms75 which are leveled against Hofstede model, e.g., non-exhaustiveness, reliance on single company data, four dimensions being
75
insufficient to measure culture difference and that nations are not the best units for
studying cultures. This study also makes the assumption of homogeneity and equivalence
of countries culture dimension within regions. This assumption is required firstly,
because the study at the first place is to capture the asymmetrical distribution of
programmers between EU and North American region in one side and Asia and Latin
American region on the other side; secondly, the scores of countries within region show a
similar proclivity in the scores and hence taking there mean averages is the best method
for studying the culture dimensions of a given region; lastly, there seems to be very less
variance between the average score of the region and the countries score within the
region.
In spite of these limitations, this study is amongst the very few that has tested the
influence of national cultural distance on participation of programmers in open source
movement. In this paper, the direct and indirect influence of cultural differences on
participation of programmers has been examined by capturing their behavioral process in
the open source development. As such it provides interesting results which could have
important research and practical implications for understanding and managing the
development of open source software.
V. CONCLUSION
This paper very clearly exemplifies the importance of open source movement and
explains, that open source movement will sustain in a long run not because of the
incentive paradigm but because of the strong culture dimensions embedded in the
development of the open source software. Going forward what will be very interesting is
to study how these strong culture dimensions formulate informal institutions to support
the ever increasing surge of open source movement. Lastly studying the culture
dimensions by individual country wise could supply us with better results and better
BIBLIOGRAPHY
Alex Inkeles and Daniel Levinson, “National Character: The Study of Modal Personality and Socio-Cultural Systems”, in the Handbook of Social Psychology, 2nd edition, Vol. 4 (Reading MA: Addison-Wesley, 1954)
Alexander Hars and Shaosong Ou, “Working For Free and Motivations for Participating in Open Source Projects”, 6 Int’l J. Electronic Comm. 25 (2002)
Andrea Bonaccorsi & Cristina Rossi “Why Open Source Software can Succeed”, 32 Research Policy (2003), pp. 1243-1258
Andrea Bonaccorsi and Cristina Rossi, “Why Open Source Software can Succeed”, 32 Research Policy 2003, pp 1243-1258
Avner Greif, “Cultural Beliefs and the Organization of Society: A Historical and Theoretical Reflection on Collectivist and Individualist Societies”, 102 Journal of Political Economy (1994) pp. 912-950
Brian Fitzgerald, “The Transformation of Open Source Software”, MIS Quarterly Vol. 30 No. 3 pp. 587-598 (September 2006)
Catherine L. Fisk, “Credit Where It’s Due: The Law and Norms of Attribution”, 95. Geo. L. J. 49
Chao C. Chen et al., “How Can Co-operation be Fostered? The Cultural Effects of Individualism and Collectivism”, The Academy of Management Review, Vol. 23 (2) (1998), pp. 285-304
David McGowan, “Legal Implications of Open Source Software”, University of Illinois Law Review Vol. 1 (2001) pp. 241-304
David S. Evans & Bernard J. Reddy, “Government Preferences for Promoting Open Source Software: A solution in search of a Problem”, 9 Mich. Telecom. Tech. L. Rev. 313 at 322-23 (2003)
Deci, E.L., “Effects of Externally Mediated Rewards on Intrinsic Motivation”, Journal of Personality and Social Psychology, Vol. 18 (1971) 105-115
Deci, E.L., “Intrinsic Motivation, Extrinsic Reinforcement and Inequality”, Journal of Personality and Social Psychology, Vol. 22 (1972) 113-120
Dyer, L. and Parker D. F., “Classifying Outcomes in Work Motivation Research: An Examination of the Intrinsic Extrinsic Dichotomy”, Journal of Applied Psychology, Vol. 2 (1975), 455-458
Edward T. Hall and Mildred Reed Hall, “Hidden Differences”, (New York: Anchor Press, 1987)
Forrester Study on OSS, the document is available at,
http://forrester.com/Research/Document/Excerpt/0,7211,34231,00.html
(Last visited on June 27, 2007)
Gary P. Ferraro, “The Cultural Dimension of International Business”, (New Jersey: Prentice Hall, 1990)
Geert Hofstede et al., “Measuring Organizational Cultures: A Qualitative and Quantitative Study across Twenty Cases”, Administrative Science Quarterly, Vol. 35 (2), pp. 286-316 (1990)
Geert Hofstede, “Cultures and Organizations” (Glasgow: McGraw-Hill Publications, 1991)
Geert Hofstede, “The Cultural Relativity of Organizational Practices and Theories”, Journal of International Business Studies, Vol.14 (2) pp. 75-89 (1983)
Georg Krogh and Eric Hippel, “Special Issue on Open Source Software Development”, 32 Research Policy (2003), pp. 1149-1157
Goodstein, L.D., and Hunt, J. W., “Commentary: Do American Theories apply abroad?” Organizational Dynamics, Vol. 10 (1), pp. 49-62
Guido Hertel et al., “Motivation of Software developers in Open Source Projects: An Internet-Based Survey of Contributors to the Linux Kernel”, 32 Research Policy, pp. 1159-1177 (2003)
Hall, E.T. and Hall, M.R. “Understanding Cultural Differences” (Massachusetts: Intercultural Press, 1990)
Helmy H. Baligh, “Components of Culture: Nature, Interconnections, and Relevance to the decisions on the Organization Structure”, Management Science, Vol. 40 (1) (1994), pp. 14-27
Jhy-An Lee, “New Perspectives on Public Goods Production: Policy Implications of Open Source Software”, 9 Vand. J. Ent. & Tech. L. 45
John J. Lawrence et al., “Individualism and Confucian Dynamism: A note on Hosftede’s Cultural Root on economic growth”, Journal of International Business Studies, Vol. 26 (3), (1995), pp. 655-669
Joseph Feller et al., “Perspectives on Free and Open Source Software” (Cambridge: MIT Press, 2005)
Josh Lerner and Jean Tirole, “Some Simple Economics of Open Source”, 50 Journal of Industrial Economics 197 (2002)
Josh Lerner and Jean Tirole, “The Economics of Technology Sharing: Open Source and Beyond”, Journal of Economic Perspectives Volume 19 (2) pp. 99-120 (2005)
Justin Pappas Johnson, “Open Source Software: Private Provision of Public Good”, 11 Journal of Economy and Management Strategy 637 (2002)
Karim R. Lakhani and Eric Hippel, “How Open Source Software Works: Free User-to-User Assistance”, 32 Research Policy 923 (2003)
Klaus M. Schmidt and Monika Schnitzer, “Public Subsidies for Open Source, Some Economic Policy Issues of the Software Market”, 16 Harv. J. L. & Tech. 473 (2003)
Kluckhohn, F. and Strodtbeck, F., “Variations in Value Orientations”, (Illinois: Row Peterson Publishing Co., 1961)
Lawler, E. E., “Job Design and Employee Motivation”, Personnel Psychology, Vol. 22 (1969), pp. 426-435
Luc Hatlestad, “LinuxWorld Showcases Open Source Growth, Expansion”
(http://www.informationweek.com/story/showArticle.jhtml)
(last visited on June 27, 2007).
Martha L. Maznevski et al., “Cultural Dimensions at the Individual Level of Analysis”, International Journal of Cross Culture Management, Vol. 2(3) (2002) pp. 275-295
Maslow, A. H., “Motivation and Personality” 2nd edition (New York: Harper, 1970)
Matthew D. Stein, “Rethinking UCITA: Lessons from the Open Source Movement”, 58 Me. L. Rev. 157 (2006)
Nancy J. Adler, “A Typology of Management Studies Involving Culture”, Journal of International Business Studies, Vol. 14 (2) (1984), pp. 29-47
Netcraft web server search http://news.netcraft.com (last visited on June 25, 2007)
Patrick K. Bobko, “Linux and General Public Licenses: Can Copyright Keep ‘open Source’ Software free?” 28 AIPLA Q.J. pp. 81-85 (2000)
R. Culpan, “Institutional Model of Comparative Management”, Advance International Comparative Management Vol. 6 (1991), pp. 127-142.
Richard W. Wright et al., “A Cross-Cultural Comparative Study of Managerial Job Attitudes”, Journal of International Business Studies, Vol. 14 (2) (1983), pp. 115-129
Rishab A. Ghosh et al., “The Impact of Free/Libre/Open Source Software on innovation and competitiveness of the European Union” the document is available at,
(http://ec.europa.eu/enterprise/ict/policy/ doc/2006-11-20-flossimpact.pdf)
(Last visited on June 27, 2007)
Rishab A. Ghosh et al., “Free/Libre and Open Source Software: Survey and Study”, the document is available at
http://www.infonomics.nl/FLOSS/report/
(last visited June, 27, 2007)
Ronald. H. Coase, “The Nature of Firm”, Economica Vol. 4 (16) (1937), pp.386-405
Ronen, S. and Shenkar, O., “Clustering Countries on Attitudinal Dimensions: A Review of and Synthesis”, Academy of Management Review 10(3) (1985) pp. 435–54
Schwartz, S.H., “Beyond Individualism/Collectivism: New Cultural Dimensions of Values”, in U. Kim, H.C. Triandis, C. Kagitcibasi, S.-C. Choi and G. Yoon (eds.)
Individualism and Collectivism: Theory, Method, and Applications, (London: Sage Publications, 1994) pp. 85–119
Schwartz, S.H., and Bilksy, W., “Towards a Theory of the Universal Content and Structure of Values: Extensions and Cross-Cultural Replications, Journal of Personality and Social Psychology, Vol. 58 (5), pp. 878-891
Sivakumar and Cheryl Nakata, “The Stampede towards Hofstede’s Framework: Avoiding the Sample Design Pit in Cross-Cultural Research”, 32 Journal of International Business Studies 2001 pp. 555-574
Vijay Pothukuchi et al., “National and Organizational Culture Differences and International Join Venture Performance”, Journal of International Business Studies, Vol. 33 (2) (2002), pp. 243-265
“What is SourceForge.Net?” at http://sourceforge.net/docs/about (last visited June 27, 2007)