SSM-DENCLUE: Enhanced Approach for Clustering of
Sequential Data: Experiments and Test Cases
K.Santhi Sree,
Ph.D Professor of CSEJawaharLal Nehru Technological University Kukatpally, Hyderabad
ABSTRACT
Clustering web usage data is useful to discover interesting patterns related to user traversals, behavior and their characteristics, which helps for the improvement of better Search Engines and Web personalization. Clustering web sessions is to group them based on similarity and consists of minimizing the Intra-cluster similarity and maximizing the Inter-group similarity. The other issue that arises is how to measure similarity between web sessions. There exist multiple similarity measures in the past like Euclidean , Jaccard ,Cosine and many. Most of the similarity measures presented in the history deal only with sequence data but not the order of occurrence of data. A novel similarity measure named SSM(Sequence Similarity Measure) is developed that shows the impact of clustering process ,when both sequence and content information is incorporated while computing similarity between sequences. SSM (Sequence Similarity measure) captures both the order of occurrence of page visits and the page information as well , and compared the results with Euclidean, Jaccard and Cosine similarity measures. Incorporating a new similarity measure, the existing Density clustering technique DENCLUE is enhanced and the new named as SSM-DENCLUE for Web personalization. The Inter-cluster and Intra-cluster distances are computed using Average Levensthien distance (ALD) to demonstrate the usefulness of the proposed approach in the context of web usage mining. This new similarity measure has significant results when comparing similarities between web sessions with other previous measures , and provided good time requirements of the newly developed SSM- DENCLUE algorithms. Experiments are performed on MSNBC.COM website ( free online news channel), in the context of Density based clustering in the domain of Web usage mining.
General Terms
Sequence Mining, Clustering .Density Based Clustering
Keywords
Data Mining, Clustering, similarity measures, Web Personalization, DENCLUE, SSM-DENCLUE.
1. INTRODUCTION
1.1 Data Mining
Data mining, called Knowledge Discovery in Databases(KDD) an interdisciplinary subfield of computer science is the process of identifying knowledge / patterns in large heterogeneous data sets .The goal of the Data mining process is to extract information from a data set , preprocess and transform it into an understandable structure for further use. Various stages of Data mining are Selection, Preprocessing , Transformation , Data mining, Interpretation and evaluation. The various Data mining techniques are
[image:1.595.320.538.496.609.2]Classification, Clustering, Prediction, Association and Discrimination.
Figure 1: Data Mining Architecture
1.2 Clustering
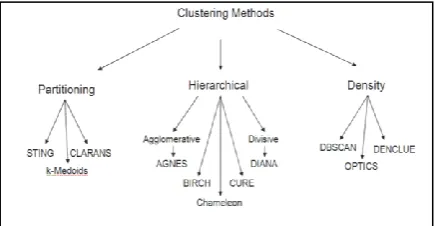
Is a process of categorizing the data into multiple clusters where all the patterns lying in one cluster are similar to one another and dissimilar when compared to the patterns lying in the other cluster . Different types of clustering techniques are partitioning ,Hierarchical, Density-based ,Grid-Density-based and Model–Based algorithms. In Density-based clustering, clusters are defined as areas of higher density than the remainder of the dataset .The most popular Density based clustering method is DBSCAN, OPTICS and DENCLUE. They start with an arbitrary starting point P that has not been visited and its e-neighborhood is retrieved, and if it contains sufficient number of points, a cluster is started. Otherwise, the point is labeled as noise.
Figure 2: Types of clustering techniques
1.3 Sequence Mining
on string based algorithms and itemset mining which is typically based on association rule mining.
1.4 Web Personalization
Web personalization is the process of identifying what users are exactly looking for on the web, their traversals and their behavior. Due to the continuous growth of the Web data , Web personalization has become one of the challenging task for the researchers and commercial areas. The steps of a Web personalization process include: the collection of Web data, modeling and categorization of these data (preprocessing phase), the analysis of the collected data, the determination of the actions that should be performed. Web data are collected and used in the context of Web personalization. These data are classified in four categories .web Structure data represent how pages are linked to one another. Web usage data represents what users are exactly looking for on the Web and their characteristics such as a visitor’s IP address, time and date of access, complete path (files or directories) accessed, referrers’ address, and other attributes that can be included in a Web access log.
1.5 Similarity Measures
Similarity measure are used to find out how similar are two sequences are. In the history many similarity measures exist, and they are Euclidean, Jaccard, Cosine, Manhanttan and Minkowski measures. These similarity measures are vector based. Euclidean distance measure is frequency based similarity measures for two sequences S1 and S2 in an N- dimensional space. It is defined as the square root of the sum of the corresponding dimensions of the vector. The Euclidean distance between sequences S1=(p1, p2,..., pn) and S2=(q1, q2,..., qn) is defined as
Jaccard similarity measure is defined as the ratio of the intersection of items between the two sequences to the union of items of the two sequences.
Cosine similarity measure is the angle between two vectors. The cosine measure is given by
1.6 SSM-Sequence Similarity Measure
In this work a novel similarity measure [2] is used that captures both the order of information as well as content(information) called the SSM( sequence similarity measure).
2. EXISTING METHODOLOGY
Usually when dealing with sequences, the data is converted into n-dimensional frequency vectors. The vector representation can be either indicating presence or absence of symbol in a sequence, or, indicating frequency of symbol within a sequence. While computing similarity between sequences they either consider the content /information or the order information. In the existing work the sequences are converted to intermediate representations and the similarity between any two sequences is calculated using any of the similarity measures like Euclidean, Jaccard, Cosine. DENCLUE can be applied for clustering. Similarity are calculated which illustrates the similarity between the sequences. And the Inter cluster similarity has to be maximized and Intra cluster similarity has to be minimized.
Procedure:
Data set with N sequences
Vector representation of sequences
Similarity between sequences
DBSCAN /OPTICS Clustering Euclid
ean Jaccard Cosine Fuzzy
Inter
cluster Intra cluster
Figure 3: Exiting Work Procedure
3. PROPOSED WORK
The work concentrates on Clustering technique on the domain of web usage data . A new similarity measure [6] is used to measure similarity/distance between two sequences and experiments are conducted on Density -based clustering using existing clustering called DENCLUE and the enhanced Density clustering algorithm like SSM-DENCLUE respectively .In all the experiments the running time of the new similarity measure is as accurate as the best compared to the earlier similarity measures . An experimental framework for sequential data stream mining on clustering on web usage data is built.
3.1 Experimental Results
3.1.1 Web Navigation dataset used for Testing
MSNBC is a joint venture between Microsoft and NBC(National Broad casting) is a famous online news website with has different news subjects. There are 17categories of news like
‘tech’ as 3, etc. Web Navigational dataset is considered in Table 5.1
Table 1. Web Navigational Dataset T1 on-air misc misc misc on-air misc T2 news sports tech local sports ,sports T3 Sports bbs bbs bbs bbs bbs bbs
T4 frontpage frontpage sports news news local T5 on-air weather weather weather sports,sports T6 on-air on-air on-air on-air tech bbs
T7 frontpage bbs bbs frontpage frontpage news T8 frontpage frontpage frontpage frontpage frontpage
bbs
T9 news news travel opinion opinion msn-news T10 frontpage business frontpage news news bbs
Table 2. Converted Web Navigational dataset Sequence Order of page visists
T1 6,15,15,15,6,15 T2 2,11,3,4,11,11 T3 11,13,13,13,13,13 T4 1,1,11,2,2,4 T5 6,7,7,7,11,11 T6 6,6,6,6,3,6 T7 1,13,13,1,1,2 T8 1,1,1,1,1,13 T9 2,2,14,5,5,16 T10 1,10,1,2,2,13
3.2
DENCLUE
and
SSM-DENCLUE
Clustering Technique
3.2.1 Experiments on Synthetic web Navigational
Dataset for DENCLUE
Consider arbitrarily 200 records of web transactions from MSNBC.COM website. The transactions are converted to vector representation, and a 200 X 200 similarity matrix is computed using any of the existing similarity measures mentioned above. In the step two after applying existing Denclue clustering technique the clusters formed are 17. Table 7.4, 17 X 17 matrix which shows the inter cluster distance using Euclidean distance measure. For example, the inter cluster distance (C1,C2) =0.15. and inter cluster distance between the clusters (C3,C16)=0.31. That is the patterns lying in the cluster C3 are more dissimilar when compared to the patterns lying in the cluster C16.
Table 3: Inter Cluster Distance Using Euclidean Distance Measure for Denclue
C i X C i C 1 C 2 C 3 C 4 C 5 C 6 C 7 C 8 C 9 C 1 0 C 1 1 C 1 2 C 1 3 C 1 4 C 1 5 C 1 6 C 1 7 C 1 -
0 . 1 7 0 . 2 5 0 . 2 5 0 . 3 1 0 . 2 5 0 . 2 1 0 . 2 5 0 . 2 6 0 . 2 1 0 . 2 1 0 . 2 5 0 . 2 2 0 . 2 4 0 . 2 4 0 . 2 6 0 . 2 4 0 . 1 9 -
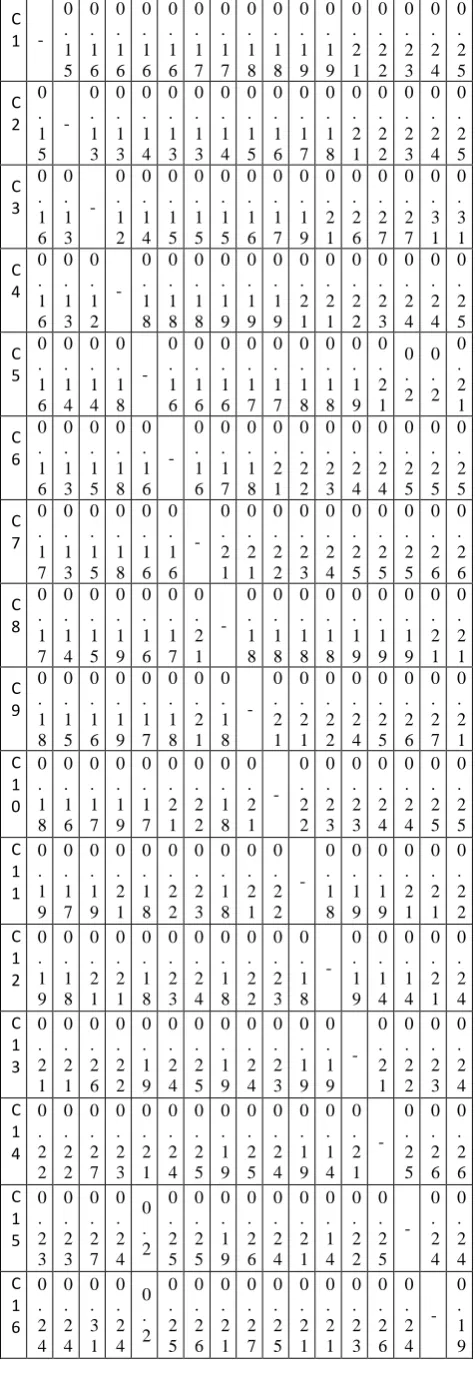
Table 4: Inter Cluster Distance Using Jaccard Distance Measure For Denclue
[image:4.595.300.546.330.771.2]J a c c a r d C 1 C 2 C 3 C 4 C 5 C 6 C 7 C 8 C 9 C 1 0 C 1 1 C 1 2 C 1 3 C 1 4 C 1 5 C 1 6 C 1 7 C 1 8 C 1 0 0 . 1 5 0 . 1 6 0 . 1 6 0 . 1 6 0 . 1 6 0 . 1 7 0 . 1 7 0 . 1 8 0 . 1 8 0 . 1 9 0 . 1 9 0 . 2 1 0 . 2 2 0 . 2 3 0 . 2 4 0 . 2 5 0 . 2 5 C 2 0 . 1 5 0 0 . 1 3 0 . 1 3 0 . 1 4 0 . 1 3 0 . 1 3 0 . 1 4 0 . 1 5 0 . 1 6 0 . 1 7 0 . 1 8 0 . 2 1 0 . 2 2 0 . 2 3 0 . 2 4 0 . 2 5 0 . 2 6 C 3 0 . 1 6 0 . 1 3 0 0 . 1 2 0 . 1 4 0 . 1 5 0 . 1 5 0 . 1 5 0 . 1 6 0 . 1 7 0 . 1 9 0 . 2 1 0 . 2 6 0 . 2 7 0 . 2 7 0 . 3 1 0 . 3 1 0 . 2 9 C 4 0 . 1 6 0 . 1 3 0 . 1 2 0 0 . 1 8 0 . 1 8 0 . 1 8 0 . 1 9 0 . 1 9 0 . 1 9 0 . 2 1 0 . 2 1 0 . 2 2 0 . 2 3 0 . 2 4 0 . 2 4 0 . 2 5 0 . 2 6 C 5 0 . 1 6 0 . 1 4 0 . 1 4 0 . 1 8 0 0 . 1 6 0 . 1 6 0 . 1 6 0 . 1 7 0 . 1 7 0 . 1 8 0 . 1 8 0 . 1 9 0 . 2 1 0 . 2 0 . 2 0 . 2 1 0 . 2 2 C 6 0 . 1 6 0 . 1 3 0 . 1 5 0 . 1 8 0 . 1 6 0 0 . 1 6 0 . 1 7 0 . 1 8 0 . 2 1 0 . 2 2 0 . 2 3 0 . 2 4 0 . 2 4 0 . 2 5 0 . 2 5 0 . 2 5 0 . 2 5 C 7 0 . 1 7 0 . 1 3 0 . 1 5 0 . 1 8 0 . 1 6 0 . 1 6 0 0 . 2 1 0 . 2 1 0 . 2 2 0 . 2 3 0 . 2 4 0 . 2 5 0 . 2 5 0 . 2 5 0 . 2 6 0 . 2 6 0 . 2 7 C 8 0 . 1 7 0 . 1 4 0 . 1 5 0 . 1 9 0 . 1 6 0 . 1 7 0 . 2 1 0 0 . 1 8 0 . 1 8 0 . 1 8 0 . 1 8 0 . 1 9 0 . 1 9 0 . 1 9 0 . 2 1 0 . 2 1 0 . 2 2 C 9 0 . 1 8 0 . 1 5 0 . 1 6 0 . 1 9 0 . 1 7 0 . 1 8 0 . 2 1 0 . 1 8 0 0 . 2 1 0 . 2 1 0 . 2 2 0 . 2 4 0 . 2 5 0 . 2 6 0 . 2 7 0 . 2 1 0 . 2 2 C 1 0 0 . 1 8 0 . 1 6 0 . 1 7 0 . 1 9 0 . 1 7 0 . 2 1 0 . 2 2 0 . 1 8 0 . 2 1 0 0 . 2 2 0 . 2 3 0 . 2 3 0 . 2 4 0 . 2 4 0 . 2 5 0 . 2 5 0 . 2 7 C 1 1 0 . 1 9 0 . 1 7 0 . 1 9 0 . 2 1 0 . 1 8 0 . 2 2 0 . 2 3 0 . 1 8 0 . 2 1 0 . 2 2 0 0 . 1 8 0 . 1 9 0 . 1 9 0 . 2 1 0 . 2 1 0 . 2 2 0 . 2 2 C 1 2 0 . 1 9 0 . 1 8 0 . 2 1 0 . 2 1 0 . 1 8 0 . 2 3 0 . 2 4 0 . 1 8 0 . 2 2 0 . 2 3 0 . 1 8 0 0 . 1 9 0 . 1 4 0 . 1 4 0 . 2 1 0 . 2 4 0 . 2 4 C 1 0 . 0 . 0 . 0 . 0 . 0 . 0 . 0 . 0 . 0 . 0 . 0 . 0 0 . 0 . 0 . 0 . 0 . 3 2 1 2 1 2 6 2 2 1 9 2 4 2 5 1 9 2 4 2 3 1 9 1 9 2 1 2 2 2 3 2 4 2 5 C 1 4 0 . 2 2 0 . 2 2 0 . 2 7 0 . 2 3 0 . 2 1 0 . 2 4 0 . 2 5 0 . 1 9 0 . 2 5 0 . 2 4 0 . 1 9 0 . 1 4 0 . 2 1 0 0 . 2 5 0 . 2 6 0 . 2 6 0 . 2 7 C 1 5 0 . 2 3 0 . 2 3 0 . 2 7 0 . 2 4 0 . 2 0 . 2 5 0 . 2 5 0 . 1 9 0 . 2 6 0 . 2 4 0 . 2 1 0 . 1 4 0 . 2 2 0 . 2 5 0 0 . 2 4 0 . 2 4 0 . 2 4 C 1 6 0 . 2 4 0 . 2 4 0 . 3 1 0 . 2 4 0 . 2 0 . 2 5 0 . 2 6 0 . 2 1 0 . 2 7 0 . 2 5 0 . 2 1 0 . 2 1 0 . 2 3 0 . 2 6 0 . 2 4 0 0 . 1 9 0 . 2 3 C 1 7 0 . 2 5 0 . 2 5 0 . 3 1 0 . 2 5 0 . 2 1 0 . 2 5 0 . 2 6 0 . 2 1 0 . 2 1 0 . 2 5 0 . 2 2 0 . 2 4 0 . 2 4 0 . 2 6 0 . 2 4 0 . 1 9 0 0 . 1 9 C 1 8 0 . 2 5 0 . 2 6 0 . 2 9 0 . 2 6 0 . 2 2 0 . 2 5 0 . 2 7 0 . 2 2 0 . 2 2 0 . 2 7 0 . 2 2 0 . 2 4 0 . 2 5 0 . 2 7 0 . 2 4 0 . 2 3 0 . 1 9 0
Table 5: Inter Cluster Distance Using Cosine Similarity Measure For Denclue
C o s i n e C 1 C 2 C 3 C 4 C 5 C 6 C 7 C 8 C 9 C 1 0 C 1 1 C 1 2 C 1 3 C 1 4 C 1 5 C 1 6 C 1 -
9 1 9 1 7 1 4 1 7 1 8 1 8 2 2 2 3 2 1 2 1 1 7 1 8 1 6 2 1 1 8 C 1 0 0 . 1 9 0 . 1 6 0 . 1 3 0 . 1 7 0 . 1 8 0 . 1 8 0 . 1 9 0 . 2 0 . 2 1 - 0 . 2 2 0 . 1 9 0 . 1 9 0 . 1 7 0 . 2 2 0 . 1 8 C 1 1 0 . 1 9 0 . 1 6 0 . 1 4 0 . 1 6 0 . 1 4 0 . 1 6 0 . 1 5 0 . 1 6 0 . 2 1 0 . 2 2 - 0 . 2 7 0 . 2 3 0 . 2 3 0 . 2 2 0 . 2 4 C 1 2 0 . 1 9 0 . 1 6 0 . 1 3 0 . 1 7 0 . 1 8 0 . 1 7 0 . 1 8 0 . 1 7 0 . 1 7 0 . 1 9 0 . 2 7 - 0 . 1 8 0 . 1 7 0 . 1 8 0 . 1 7 C 1 3 0 . 2 0 . 1 7 0 . 1 3 0 . 1 8 0 . 1 9 0 . 1 6 0 . 1 7 0 . 1 8 0 . 1 8 0 . 1 9 0 . 2 3 0 . 1 8 - 0 . 1 6 0 . 1 7 0 . 1 8 C 1 4 0 . 2 1 0 . 1 7 0 . 1 4 0 . 1 7 0 . 1 6 0 . 1 5 0 . 1 6 0 . 1 8 0 . 1 6 0 . 1 7 0 . 2 3 0 . 1 7 0 . 1 6 - 0 . 1 6 0 . 1 8 C 1 5 0 . 2 2 0 . 1 8 0 . 1 5 0 . 1 8 0 . 1 7 0 . 1 6 0 . 1 4 0 . 1 7 0 . 2 1 0 . 2 2 0 . 2 2 0 . 1 8 0 . 1 7 0 . 1 6 - 0 . 1 7 C 1 6 0 . 2 1 0 . 1 8 0 . 1 6 0 . 1 7 0 . 1 8 0 . 1 8 0 . 1 7 0 . 1 7 0 . 1 8 0 . 1 8 0 . 2 4 0 . 1 7 0 . 1 8 0 . 1 8 0 . 1 7 -
3.2.2 Experiments on Synthetic web Navigational
Dataset for SSM-Denclue
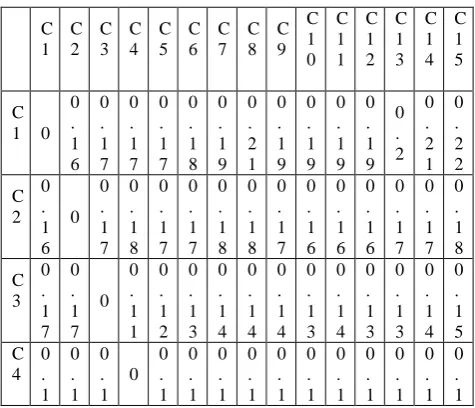
[image:5.595.48.286.566.770.2]Consider arbitrarily 200 records of web transactions from MSNBC.COM website. The transactions are converted to vector representation, and a 200 X 200 similarity matrix is computed using any of the existing similarity measures mentioned above. In the step two after applying SSM-DENCLUE clustering technique the clusters formed are 15 .Table 6 15 X 15 matrix which shows the inter cluster distance using Euclidean distance measure.
Table 6: Inter Cluster Distance Using Euclidean Distance for SSM-Denclue C 1 C 2 C 3 C 4 C 5 C 6 C 7 C 8 C 9 C 1 0 C 1 1 C 1 2 C 1 3 C 1 4 C 1 5 C 1 0 0 . 1 6 0 . 1 7 0 . 1 7 0 . 1 7 0 . 1 8 0 . 1 9 0 . 2 1 0 . 1 9 0 . 1 9 0 . 1 9 0 . 1 9 0 . 2 0 . 2 1 0 . 2 2 C 2 0 . 1 6 0 0 . 1 7 0 . 1 8 0 . 1 7 0 . 1 7 0 . 1 8 0 . 1 8 0 . 1 7 0 . 1 6 0 . 1 6 0 . 1 6 0 . 1 7 0 . 1 7 0 . 1 8 C 3 0 . 1 7 0 . 1 7 0 0 . 1 1 0 . 1 2 0 . 1 3 0 . 1 4 0 . 1 4 0 . 1 4 0 . 1 3 0 . 1 4 0 . 1 3 0 . 1 3 0 . 1 4 0 . 1 5 C 4 0 . 1 0 . 1 0 . 1 0 0 . 1 0 . 1 0 . 1 0 . 1 0 . 1 0 . 1 0 . 1 0 . 1 0 . 1 0 . 1 0 . 1
7 8 1 1 2 4 6 8 2 4 5 5 5 6
C 5 0 . 1 7 0 . 1 7 0 . 1 2 0 . 1 1 0 0 . 1 7 0 . 1 6 0 . 1 7 0 . 1 7 0 . 1 6 0 . 1 6 0 . 1 6 0 . 1 7 0 . 1 7 0 . 1 8 C 6 0 . 1 8 0 . 1 7 0 . 1 3 0 . 1 2 0 . 1 7 0 0 . 1 1 0 . 1 2 0 . 1 2 0 . 1 3 0 . 1 4 0 . 1 3 0 . 1 3 0 . 1 4 0 . 1 5 C 7 0 . 1 9 0 . 1 8 0 . 1 4 0 . 1 4 0 . 1 6 0 . 1 1 0 0 . 1 9 0 . 1 8 0 . 1 9 0 . 1 7 0 . 1 9 0 . 2 0 . 2 1 0 . 2 2 C 8 0 . 2 1 0 . 1 8 0 . 1 4 0 . 1 6 0 . 1 7 0 . 1 2 0 . 1 9 0 0 . 1 7 0 . 1 6 0 . 2 1 0 . 1 7 0 . 1 8 0 . 1 8 0 . 1 8 C 9 0 . 1 9 0 . 1 7 0 . 1 4 0 . 1 8 0 . 1 7 0 . 1 2 0 . 1 8 0 . 1 7 0 0 . 2 1 0 . 2 2 0 . 1 7 0 . 1 8 0 . 1 8 0 . 2 2 C 1 0 0 . 1 9 0 . 1 6 0 . 1 3 0 . 1 2 0 . 1 6 0 . 1 3 0 . 1 9 0 . 1 6 0 . 2 1 0 0 . 1 7 0 . 1 7 0 . 1 8 0 . 1 8 0 . 1 9 C 1 1 0 . 1 9 0 . 1 6 0 . 1 4 0 . 1 4 0 . 1 6 0 . 1 4 0 . 1 7 0 . 2 1 0 . 2 2 0 . 1 7 0 0 . 1 6 0 . 1 4 0 . 1 6 0 . 1 5 C 1 2 0 . 1 9 0 . 1 6 0 . 1 3 0 . 1 5 0 . 1 6 0 . 1 3 0 . 1 9 0 . 1 7 0 . 1 7 0 . 1 7 0 . 1 6 0 0 . 1 8 0 . 1 7 0 . 1 8 C 1 3 0 . 2 0 . 1 7 0 . 1 3 0 . 1 5 0 . 1 7 0 . 1 3 0 . 2 0 . 1 8 0 . 1 8 0 . 1 8 0 . 1 4 0 . 1 8 0 0 . 1 6 0 . 1 7 C 1 4 0 . 2 1 0 . 1 7 0 . 1 4 0 . 1 5 0 . 1 7 0 . 1 4 0 . 2 1 0 . 1 8 0 . 1 8 0 . 1 8 0 . 1 6 0 . 1 7 0 . 1 6 0 0 . 1 6 C 1 5 0 . 2 2 0 . 1 8 0 . 1 5 0 . 1 6 0 . 1 8 0 . 1 5 0 . 2 2 0 . 1 8 0 . 2 2 0 . 1 9 0 . 1 5 0 . 1 8 0 . 1 7 0 . 1 6 0
3.2.2 Experiments on Standard web Navigational
Dataset
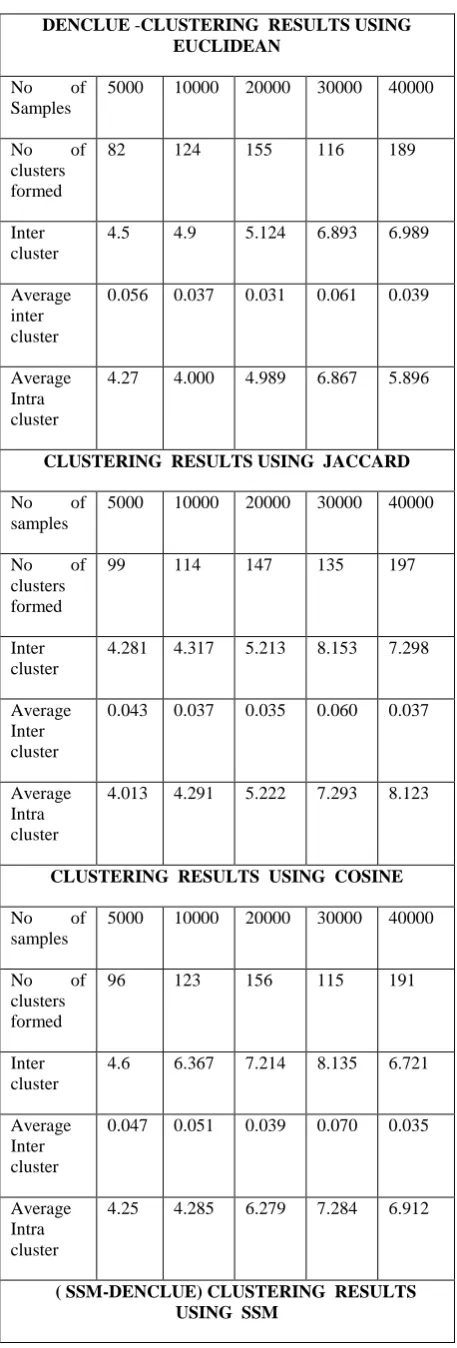
Table 7. Inter and Intra cluster distance for DENCLUE and SSM-DENCLUE
DENCLUE -CLUSTERING RESULTS USING EUCLIDEAN
No of Samples
5000 10000 20000 30000 40000
No of clusters formed
82 124 155 116 189
Inter cluster
4.5 4.9 5.124 6.893 6.989
Average inter cluster
0.056 0.037 0.031 0.061 0.039
Average Intra cluster
4.27 4.000 4.989 6.867 5.896
CLUSTERING RESULTS USING JACCARD No of
samples
5000 10000 20000 30000 40000
No of clusters formed
99 114 147 135 197
Inter cluster
4.281 4.317 5.213 8.153 7.298
Average Inter cluster
0.043 0.037 0.035 0.060 0.037
Average Intra cluster
4.013 4.291 5.222 7.293 8.123
CLUSTERING RESULTS USING COSINE No of
samples
5000 10000 20000 30000 40000
No of clusters formed
96 123 156 115 191
Inter cluster
4.6 6.367 7.214 8.135 6.721
Average Inter cluster
0.047 0.051 0.039 0.070 0.035
Average Intra cluster
4.25 4.285 6.279 7.284 6.912
( SSM-DENCLUE) CLUSTERING RESULTS USING SSM
Size of sequences
5000 10000 20000 30000 40,000
No of clusters
94 126 149 141 187
Inter cluster
4.681 4.317 5.213 8.153 7.298
Average Inter cluster
0.043 0.037 0.035 0.060 0.037
Average Intra cluster
4.013 4.291 5.222 7.293 8.123
4. TIME REQUIREMENTS
Experiments were performed on the above mentioned dataset of varying sizes ,to see the performance of proposed clustering algorithm. The number of clusters formed using DENCLUE for varying sizes of 5000, 10000, 20000, 30000 and 40000 transactions are recorded. The execution time taken for these varying sizes of samples are recorded.
Table 8 Time Requirements of DENCLUE And SSM-DENCLUE
DENCLUE Size of
sequences
5000 10000 20000 30000 40,000
No of clusters
83 123 156 115 191
Time taken in seconds
1566 2665 2785 3218 3196
SSM-DENCLUE Size of
sequences
5000 10000 20000 30000 40,000
No of clusters
94 126 149 141 187
Time taken in seconds
1085 1879 3643 1956 2498
5. CONCLUSIONS
value. For example in SSM-DENCLUE for 5000 samples ,the time taken for execution are 1085,1879,3643,1956,2498 respectively. The time taken to execute the algorithm SSM-DBSCAN is less when compare to other clustering techniques .
A variety of experiments are performed in the context of Density based clustering. A new similarity measure for sequential data (SSM) is devised and incorporated SSM with DENCLUE for Web Usage sequential data. Our results by the way of explanations and list of conclusions, finally showed behavior of clusters that made by enhanced SSM-DENCLUE clustering technique on a sequential data in a web usage domain. This new SSM-DENCLUE required less time complexity then the existing.. This experiment shows that, in addition to the content if Sequential Information is also added it improves the quality /accuracy of the clustering. So Sequential information is important as well as Content information is also important.
5.1 Future Work
we extend our work in future to other clustering techniques and to other domains as well.
• Developing new similarity measures for continuous and discrete sequential data.
• Applying these new clustering techniques to the domains like medical, defense, bioinformatics etc. • This work can be extended to sequences of unequal
length.
• The time complexities of the proposed algorithms can be improved further.
6. REFERENCES
[1] Aggarwal.C, Han.J, Wang.J, Yu.P.S, “A Framework for Projected Clustering of High Dimensional Data Streams”, Proc. 2004 Int. Conf. on Very Large Data Bases, Toronto, Canada, pp.(852-863), 2004.
[2] Aoying.Z, Shuigeng.Z, “Approaches for scaling DBSCAN algorithm to large spatial database”, Journal of Computer Science and Technology, Vol 15(6), pp.(509– 526), 2000.
[3] Chen Song-Yu, O'Grady2,O'Hare, Wei Wang, “A Clustering Algorithm Incorporating Density and Direction”, IAWTAC ,IEEE 2008.Deepak P, Shourya Roy IBM India Research Lab, OPTICS on Text Data: Experiments and Test Results.
[4] Cooley.R,Mobasher. B,Srivastava.J, “Web mining: Information and pattern discovery on the world wide web”, 9th IEEE Int. Conf. Tools AI .
[5] Guha.s, Mishra.n, Motwani.r, Callaghan.l, “ Clustering data streams”. In Proceedings of Computer Science. IEEE,November vol.16(10),pp(1391-1399), 2000.