Multilevel Thresholding using PSO Clustering
Prasannajit Dash
Assistant ProfessorDepartment of Information Technology Orissa Engineering College, Bhubaneswar, Odisha, India
Maya Nayak
, Ph.DProfessor-cum-HOD
Department of Information Technology Orissa Engineering College, Bhubaneswar, Odisha,
India
ABSTRACT
Thresholding algorithms are quite easy and effective for
bi-level thresholding but in case of multibi-level thresholding, the performance becomes unreliable due to complexity in computation because the complexity will exponentially increase. In this approach, multilevel thresholding is done for comparison by taking help of Otsu’s clustering method and PSO clustering method. A dendogram of gray levels is created based on histogram of an image. The bottom-up generation of clusters employing a dendogram by the proposed method yields good separation of the clusters and obtains a robust estimate of the threshold. Such cluster organization will yield a clear separation between object and background even for the case of nearly unimodal or multimodal histogram. Since the hierarchical clustering method performs an iterative merging operation, it is extended to multi-level thresholding problem by eliminating grouping of clusters when the pixel values are obtained from the expected number of clusters.Keywords
– segmentation, thresholding, pso-clustering, histogram, Otsu’s clustering, dendogram1.
INTRODUCTION
The objective of segmented image [2] is to extract the required objects from an input image. Image segmentation is one of the most difficult partition task. The more efficient solution depends on the output of segmentation process. In addition the task of computer vision, including feature extraction, model matching and object recognition, heavily depends on the quality of the image segmentation process. Image based thresholding is a simple but effective tool for image segmentation.
Due to its simplicity thresholding[3] is more practical for real-time implementation. The purpose of bilevel thresholding or multilevel thresholding operation is that objects and background are separated into non-overlapping sets. The output of the thresholding operation is a binary image and in many image processing applications, the use of binary images can decrease the computational cost of the compared to gray-level images.
Although the thresholding[3] appears simple, it is very important and fundamental with the wide applicability, as it is relevant not only for segmenting the original image data but also for segmenting its linear and non-linear image to image transforms.
Clustering is considered as a task to organize a data set into a number of groups such that patterns within a cluster are more similar to each other than the patterns or features belonging to different clusters. In other words, clustering is an important technique as clustering-based methods[4] where the gray level samples are clustered in two parts as background (object) and
foreground (object). In partioning based clustering, the algorithm arranges all the objects into various partitions, where total number of partitions is less than the total number of objects. For a database of “n” objects can be arranged into “k” partitions, where k < n. Here each partition represents a cluster. The partition depends upon a function, called as similarity function and this similarity function is the criteria based on which clusters are formed.
1.1 CLUSTERING THRESHOLDING OF
OTSU
Otsu[11]’s method implements by minimizing the weighted sum of within-class variances of the foreground and background pixels to establish an optimum threshold. Since minimization of within-class variances is tantamount to the maximization of between-class scatter, the choice of the optimum threshold can be formulated as :
(1)
The Otsu method gives satisfactory results when the numbers of pixels in each class are close to each other. The Otsu will remain one of the most referenced thresholding methods.
1.2
PARTICLE SWARM
OPTIMIZATION (PSO)
Particle Swarm Optimization (PSO) is a population-based stochastic search process, modeled after the social behavior of a bird flock. The algorithm maintains a population of particles, where each particle represents a potential solution to an optimization problem. In the context of PSO[5], a swarm refers to a number of potential solutions to the optimization problem, where each potential solution is referred to as a particle. The aim of the PSO[5] is to find the particle position that results in the best evaluation of a given fitness (objective) function. Each particle represents a position in Nd dimensional
space and is “flown” through this multidimensional search space, adjusting its position towards both.
the particle’s best position found so far
the best position in the neighborhood of that particle
Each particle i maintains the following information:
xi : the current position of the particle
vi : the current velocity of the particle
yi : the personal best position of the particle
The local best position of the i particle is obtained as :
2
))
(
)
(
)).(
(
1
).(
(
max
arg
P
T
P
T
m
T
m
T
The modified velocity and position of each particle at the time (t+1) can be calculated as
(4)
Two basic approaches to PSO exist based on the interpretation of the neighborhood of particles. Equation (3) reflects the gbest version of PSO[5] where, for each particle, the neighborhood is simply the entire swarm. The social component then causes particles to be drawn toward the best particle in the swarm. In the lbest PSO model, the swarm is divided into overlapping neighborhoods, and the best particle of each neighborhood is determined. For the lbest PSO model, the social component of equation (5) changes to
(5)
where
y
j^
is the best particle in the neighborhood of the i-th
particle.
The PSO is usually executed with repeated applications (2) to (5) until a specified number of iterations
have been exceeded.
1.3 PROPOSED CLUSTERING BASED
MULTICLASS THRESHOLDING
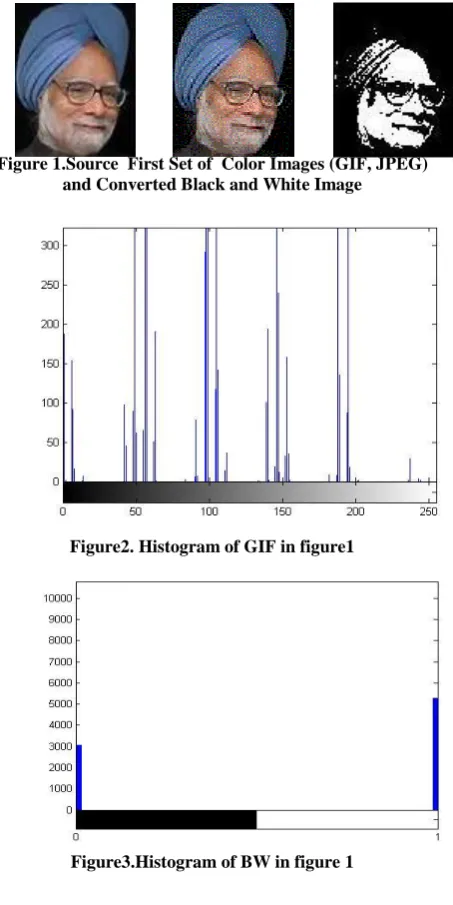
[image:2.595.322.549.176.629.2]In the approach, all dendograms have been developed from the gray level histograms. The bottom-up generation of clusters employing the dendograms by the proposed method i.e. Otsu’s method[6][7] yields a good separation of the clusters and obtains a robust estimate of the threshold. Such a type of clustering approach will yield a threshold to clearly separate the muti-modal objects (as below figures) and the background of the same. Since, this approach initially treats each non empty gray level in the histogram as a single cluster and then successively merges clusters until all points have been merged therefore, this approach is suitable for multi level thresholding problem. The images are scanned as colored images. Then Otsu’s method is applied to the scanned the multimodal colored images for Otsu’s threshold measurement. After that the output images are converted to
Figure 1.Source First Set of Color Images (GIF, JPEG) and Converted Black and White Image
Figure2. Histogram of GIF in figure1
Figure3.Histogram of BW in figure 1
)) ( .( . )) ( ) ( .( . ) ( ). ( . ) 1 ( 3 3 1 1 t x pos rand c t t x pbest rand c t v t w K t v i r i i i i i
)
(
)
(
)(
(
, , ^ , 22
r
t
y
t
x
t
Figure 4. Dendogram of images in figure1
Figure 5.Source Second Set of Color Images (GIF, JPEG) and Converted Black and White Image
Figure6.Histogram of GIF in figure5
Figure7.Histogram of BW in figure 5
[image:3.595.324.532.290.471.2]Figure8 Dendogram of images in figure 5
Figure 9 Source Third Set of Color Images (GIF, JPEG) and Converted Black and White Image
Figure11 Dendogram of images in figure 9
Figure12 Histogram of BW images in figure 9
[image:4.595.66.256.85.255.2]
Figure13 Source Fourth Set of Color Images (GIF, JPEG) and Converted Black and White Image
Figure 14 Histogram of GIF image in figure 13
Figure15 Histogram of BW images in figure 13
[image:4.595.69.268.304.461.2]Figure16 Dendogram of images in figure 13
Figure 18 Histogram of GIF image in figure 17
[image:5.595.335.523.86.239.2]Figure19 Histogram of BW image in figure 17
Figure 20 Dendogram of images in figure 17
[image:5.595.77.254.256.418.2]
Figure 21Source Sixth Set of Color Images (GIF, JPEG) and Converted Black and White Image
Figure 22 Histogram of GIF image in figure 21
Figure 23 Histogram of BW image in figure 21
Figure 24 Dendogram of image in figure 21
7. CONCLUSION
Otsu’s method for image segmentation is very time-consuming because of the inefficient formulation of the between-class variance. A faster version of Otsu’s[9][10][11] method is implemented for improving the efficiency of computation for the optimal thresholds. A criterion for maximizing a modified between-class variance that is equivalent to the criterion of maximizing the usual between –
class variance is proposed for image
[image:5.595.334.524.287.446.2] [image:5.595.347.537.474.606.2] [image:5.595.67.262.642.714.2]techniques, IEEE Trans. Systems, Man and Cybernetics, SMC-8(8), 627-629, 1978
[4] P.W. Palumbo, P. Swaminathan, S.N. Srihari, Document image binarization: Evaluation of algorithms, Proc. SPIE Applications of Digital Image Proc., SPIE Vol. 697, pp: 278-286, 1986
[5] M.Kamel, A. Zhao, Extraction of Binary Character/Graphics Images From Grayscale Document Images, Graphical Models and Image Processing, 55, No.3, 203-217, 1993
[6] P.K. Sahoo, S. Soltani, A.K.C. Wong , Y. Chen., A Survey of Thresholding Techniques, Computer Graphics and Image Process., 41, 233-260, 1988
[7] C.A. Glasbey, An analysis of histogram-based thresholding algorithms, Graphical Models and Image Processing, 55,532-537, , 1993
[12] K. S. Fu and J. K. Mui, “A survey on image segmentation,” Pattern Recogrt., vol. 13, no. 1, pp. 3-16, 1981
[13] P. K. Sahoo, S. Soltani, A. K. C. Wong, and Y. C. Chen, “A survey of thresholding techniques,” Compur. Vision, Graph., image processing, vol. 41, no. 2, pp. 233-260, Feb. 1988
[14] B. Bhanu. “Automatic target recognition: State of the art survey,” IEEE Trans. Aerosp. Electron. Syst., vol. AES-22, no. 4, pp. 364-379, July 1986