www.hydrol-earth-syst-sci.net/20/4223/2016/ doi:10.5194/hess-20-4223-2016
© Author(s) 2016. CC Attribution 3.0 License.
Analysis of the characteristics of the global virtual water trade
network using degree and eigenvector centrality, with a focus on
food and feed crops
Sang-Hyun Lee1, Rabi H. Mohtar1, Jin-Yong Choi2, and Seung-Hwan Yoo3
1Department of Biological and Agricultural Engineering, Texas A&M University, College Station, TX 77840, USA 2Department of Rural Systems Engineering and Research Institute for Agriculture & Life Sciences, Seoul National
University, Seoul, Republic of Korea
3Department of Rural and Bio-systems Engineering, Chonnam National University, Gwangju, Republic of Korea
Correspondence to:Rabi H. Mohtar ([email protected])
Received: 4 May 2016 – Published in Hydrol. Earth Syst. Sci. Discuss.: 23 May 2016 Revised: 22 August 2016 – Accepted: 19 September 2016 – Published: 18 October 2016
Abstract. This study aims to analyze the characteristics of global virtual water trade (GVWT), such as the connectiv-ity of each trader, vulnerable importers, and influential coun-tries, using degree and eigenvector centrality during the pe-riod 2006–2010. The degree centrality was used to measure the connectivity, and eigenvector centrality was used to mea-sure the influence on the entire GVWT network. Mexico, Egypt, China, the Republic of Korea, and Japan were clas-sified as vulnerable importers, because they imported large quantities of virtual water with low connectivity. In partic-ular, Egypt had a 15.3 Gm3year−1blue water saving effect through GVWT: the vulnerable structure could cause a water shortage problem for the importer. The entire GVWT net-work could be changed by a few countries, termed “influen-tial traders”. We used eigenvector centrality to identify those influential traders. In GVWT for food crops, the USA, Rus-sian Federation, Thailand, and Canada had high eigenvector centrality with large volumes of green water trade. In the case of blue water trade, western Asia, Pakistan, and India had high eigenvector centrality. For feed crops, the green water trade in the USA, Brazil, and Argentina was the most influen-tial. However, Argentina and Pakistan used high proportions of internal water resources for virtual water export (32.9 and 25.1 %); thus other traders should carefully consider water resource management in these exporters.
1 Introduction
Water scarcity is a local phenomenon that is sensitive to global food production, since agriculture has the largest share of the consumption of global freshwater resources (Molden, 2007; Biewald et al., 2014). Most water demand is derived from agriculture, and crop trade could be considered as the main consumer of water because crop production accompa-nies water consumption, which is embedded water in crops (Aldaya et al., 2010).
lead to a global redistribution of freshwater and water sav-ings (Konar et al., 2013).
Several studies have been conducted regarding the virtual water trade at different spatial scales, in order to evaluate VWT impacts on water savings (Chapagain et al., 2006). Early studies focused on the water footprint and VWT. Hoek-stra and Hung (2005) found that 13 % of the total water used for global crop production from 1995 to 1999 was traded in-ternationally, making the international crop trade the main water consumer in importing countries and causing several researchers to try to estimate virtual water trade. For exam-ple, Hanasaki et al. (2010) estimated the global virtual water trade for major crops and livestock products, and Van Oel et al. (2009) quantified the virtual water trade in the Nether-lands and evaluated the impact of VWT on water dependency in terms of external water footprint. Bulsink et al. (2010) explained that VWT could increase the resilience to water scarcity in Java, Indonesia. Fader et al. (2011) estimated the internal and external water footprint by VWT and evaluated the effect of VWT on national and global water savings. Therefore, virtual water trade could be the main issue for wa-ter security in importing countries such as the Middle East re-gion, and the vulnerable structure of virtual water trade could cause water and food scarcity.
Virtual water trade also has a water scarcity aspect in ex-porting countries, in terms of water “losses” by exex-porting commodity (Chapagain et al., 2006). Mubako et al. (2013) calculated water use intensities across economic sectors in California and Illinois, and quantified the water embodied in trade between several states (California, Illinois, and other US states) and the rest of the world. In addition, externalities such as climate change or population change could affect vir-tual water trade, because virvir-tual water is related to both crop production and water consumption, and the main issue in water resource management is climate change. For example, Konar et al. (2013) quantified the impacts of climate change on virtual water flow and found that the decrease in the total volume of virtual water trade is derived from climate change because of decreased crop trade and virtual water content.
Recently, several studies were conducted to analyze the temporal change of VWT structure using a network system. For example, Konar et al. (2012) analyzed the temporal dy-namics of virtual water trade networks and found that global food trade affects water savings and a specific crop network could be more efficient from a water resource perspective. Dalin et al. (2012) focused on the evolution of the GVWT network, considering the number of partners and the volume of virtual water.
Generally, studies related to virtual water trade considered more structural change in the entire trade network and the volume of trade in each country. However, we need to under-stand which countries are vulnerable or influential in GVWT, in order to set a sustainable food trade and water manage-ment plan. In addition, crops could be divided into food and feed crops, even if there is not an exact standard for
classi-fying them, because the trade structure of food crops, such as wheat, barley, and rice, have different characteristics from feed crops, such as maize (corn) and beans. The main ar-eas of production and consumption vary greatly according to whether they are food or feed crops. In addition, feed crops are hardly substituted by food crops, and their respective im-pacts on food security or water security might differ.
This study aims to analyze the characteristics of GVWT of food and feed crops, respectively, through the application of network centrality. Specific objectives are to
1. evaluate trade vulnerability for each importing country through the connectivity and volume of GVWT, 2. analyze the influential traders of GVWT who could
strongly affect the entire trade network.
The degree centrality of the GVWT network was computed to evaluate the connectivity of each country, and a vulner-able structure in importers indicated low connectivity with a large amount of virtual water imported, potentially caus-ing water shortage problems for importers. We also calcu-lated the eigenvector centrality for measuring the importance and influence of a trader on the whole network, and traders should give pay attention to changes of trade policy and wa-ter management of the influential traders.
2 Materials and methods
2.1 Water footprint and global virtual water trade Water footprint (WFP, m3t−1is the volume of water required to produce 1 t of crops in the region, and it consists of green and blue water (Hoekstra and Chapagain, 2008). The green water footprint indicates the volume of rainwater consumed, while the blue water footprint indicates the volume of irriga-tion water (surface and groundwater) consumed. The WFP of a crop indicates the crop water requirement (m3ha−1) per yield (kg ha−1). It was estimated using Eq. (1), as follows: WFP[c] = CWR[c]
production[c], (1)
where WFP (m3t−1) is the water required for the production of 1 t of a given cropc, CWR is the crop water requirement, and the production is the yield per year.
As the water footprint concept, VWT represents the amount of water embedded in products that are traded in-ternationally. Therefore, it was calculated by multiplying the international crop trade by their associated water footprint, and quantifying the global scale of VWT through the water footprint and crop trade using Eq. (2), as follows:
VWT [ne, ni, c, t]=CT[ne, ni, c, t] ×WFP[ne, c], (2)
and WFP represents the water footprint. In addition,candt indicate crop and year, respectively.
2.2 Degree centrality of GVWT by network analysis GVWT consists of numerous links among nations, and the network approach could be an appropriate method to ana-lyze the structural features of GVWT. In particular, the cen-trality concept was used to evaluate the main flows and the vulnerable countries. The degree of centrality is one of the simplest indices for evaluating network structure and is a count of the number of edges incident upon a given node (Freeman, 1979). A high level of degree centrality indicates the node has expended connections with various other nodes. The degree centrality has direction and, thus, is divided to in-degree and out-in-degree centrality. In-in-degree centrality means import in the GVWT network, while out-degree means the opposite. For example, a high level of in-degree centrality in GVWT indicates the country imports virtual water from var-ious exporters, while a high level of out-degree centrality in-dicates the country exports virtual water to various importers. In other words, a country that has a high level of degree cen-trality could be identified as a main country in the expanded GVWT network. Therefore, degree centrality could be ap-plied to quantify the connectivity of each country in GVWT. The degree centrality of each country in GVWT is calculated as
Ci=
XN
j VWTij/(N−1), (3)
whereCi is the degree centrality of countryi, andN is the number of total countries. VWTij indicates the virtual water trade between theith andjth country.
2.3 Eigenvector centrality of GVWT by network analysis
GVWT comprises a complex network, but some countries could affect the entire network system: it is important to de-termine these countries. Thus, we applied eigenvector cen-trality to the GVWT network in order to find the most in-fluential countries. Eigenvector centrality is used to measure the importance and influence of a node on the whole network (Ruhnau, 2000). The eigenvector centrality represents rela-tive centrality to all nodes in the network based on the prin-ciple that high-level centrality nodes could contribute more to connected nodes than low-level centrality nodes. In other words, the centrality of a country depends not only on the number of trade partners adjacent to it but also on their cen-trality values (Ruhnau, 2000). Accordingly, the eigenvector centrality could be used to determine influential countries and influence areas. Bonacich (1972) defined the centrality c(υi)of a nodeυi as the positive multiple of the sum of ad-jacent centralities, as follows:
λc(υi)= Xn
j=1αijc(υj) ∀i. (4)
In matrix notation, with c=(c(υi), . . .,c(υn)), the above equation yields
Ac=λc. (5)
This type of equation is solved using eigenvalues and eigen-vectors, whereAis a square matrix andλis a scalar, known as the eigenvalue associated with the eigenvector c by a column vector. An eigenvector of the maximal eigenvalue with only non-negative entries exists. We call a non-negative eigenvector(c≥0)of the maximal eigenvalue the principal eigenvector andc(υi)the eigenvector-centrality of node υi (Ruhnau, 2000). The eigenvector centrality of a node is pro-portional to the sum of eigenvector centralities of the con-nected nodes (Bonacich, 1972). In addition, eigenvector cen-trality indicates the principal eigenvector that has the largest eigenvalue among all eigenvectors. We used NetMiner 3.0 (http://www.netminer.com) to estimate the degree and the eigenvector centrality.
2.4 Data for international trade and water footprint of study crops
In this study, we compared the GVWT of food and feed crops, because food crops, such as wheat and rice, might have different trade characteristics from feed crops, such as maize and soybeans. For example, Konar et al. (2011) found the number of links and average degree of corn and soy were smaller than those of other food crops, such as wheat, barley, and rice.
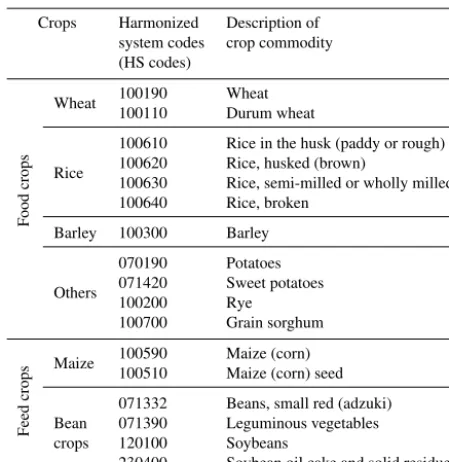
Although there is no exact classification for food and feed crops, food crops generally indicate crops for food, and rep-resentative crops are wheat, barley, and rice. Feed crops indi-cate crops that are cultivated primarily for animal feed, and the representative crops are maize (corn) and soybeans. In particular, eastern Asian countries such as China, Japan, and Republic of Korea have used maize and beans for animal feed. In this study, food crops included wheat, rice, barley, potatoes, sweet potatoes, rye, and grain sorghum. The feed crops included maize and bean crops. Table 1 lists specific crops.
Table 1.Study crops for food and feed crops.
Crops Harmonized Description of system codes crop commodity (HS codes)
F
ood
crops
Wheat 100190 Wheat
100110 Durum wheat
Rice
100610 Rice in the husk (paddy or rough) 100620 Rice, husked (brown)
100630 Rice, semi-milled or wholly milled 100640 Rice, broken
Barley 100300 Barley
Others
070190 Potatoes 071420 Sweet potatoes
100200 Rye
100700 Grain sorghum
Feed
crops
Maize 100590 Maize (corn) 100510 Maize (corn) seed 071332 Beans, small red (adzuki) Bean 071390 Leguminous vegetables crops 120100 Soybeans
230400 Soybean oil cake and solid residues
these seasons could be an important issue and collected inter-national trade data of food and feed crops during 2006–2010 from PC-TAS.
The water footprint is defined as the total volume of wa-ter consumed within the wa-territory of the nation. Mekonnen and Hoekstra (2011) quantified the average values of green and blue water footprints of crops and crop products at na-tional and sub-nana-tional levels from 1996 to 2005. The water footprint data indicated the representative index using aver-age value. Therefore, we applied the averaver-age value of wa-ter footprint during the period 1996–2005 from Mekonnen and Hoekstra (2011), even though this study focused on crop trade from 2006 to 2010.
3 Results and discussion
3.1 Estimation of the GVWT of food and feed crops The GVWT is dependent on the water footprint of each coun-try, and a few countries cultivate and export water-intensive crops. The different variability between green and blue wa-ter export was derived by the variance of wawa-ter footprint, which is dependent on the climate features in the exporting country. Mekonnen and Hoekstra (2011) also mentioned the difference of water footprint for each country; for example, relatively smaller water footprints of cereal crops were esti-mated in northern and western Europe than in most parts of Africa. In this study, we showed the variability of green and blue water export, respectively, in crop export during the pe-riod 2006–2010 (Fig. 1). The dispersion of scattered points of green water export and crop export was smaller than those
of blue water export. One of the reasons why a large disper-sion was shown in blue water export might be that the volume of blue water is much smaller than that of green water. Thus, a small amount of blue water might derive a large change in this plot. However, the main issue in Fig. 1 was that the blue water footprint differed more depending on the export-ing country, rather than on the green water footprint. There-fore, the variability of blue water export was larger than that of green water export, and crop export could bring differing impacts on irrigation water by country.
In addition, we calculated the total amount of green and blue water trade of each country from 2006 to 2010. For food crops such as wheat, rice, barley, etc., the total crop trade between 2006 and 2010 was 985.6 Mt, and the GVWT was 1631.0 Gm3(green water: 1453.1 Gm3, blue wa-ter: 177.9 Gm3). The GVWT of wheat had the highest pro-portion, totalling 1057.8 Gm3, but the largest amount of blue water was traded by rice. About 136.7 Gm3of blue water was traded through the rice trade, 4 times higher than that traded through wheat. Barley presented as a less water-intensive crop than either wheat or rice. Feed crops between 2006 and 2010, such as maize and bean crops, totaled 1243.8 Mt, with the GVWT at 1811.9 Gm3. The bean crops were representa-tive water-intensive crops, and about 1360.4 Gm3of virtual water was traded between 2006 and 2010. In contrast, the amount of maize traded was 531.2 Mt, but the virtual water that was involved was only 451.5 Gm3.
3.2 Analysis of the connectivity and intensity of GVWT using degree centrality
3.2.1 Analysis of connectivity in GVWT
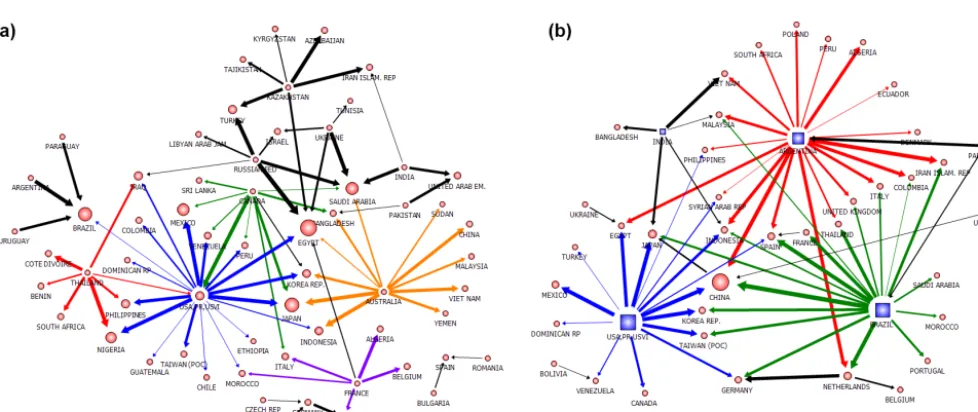
The GVWT network includes both the volume of virtual wa-ter and the connection among countries. Figure 2 shows only the main GVWT network of food and feed crops in 2010 us-ing the threshold value of virtual water trade, as we could not display these networks with all links, because it is impossi-ble to distinguish each connection between countries. There-fore, we showed the main links that were over a threshold value of 1.0 Gm3of total virtual water trade in 2010. Some countries were eliminated from the figure, because they only had connections of virtual water trade that were less than the threshold value. GVWT for food crops has a dispersed net-work, but GVWT for feed crops is more centralized with a few main exporters, such as the USA, Argentina, Brazil, and China. In other words, the food and feed crop trades have a different structure, and we need to consider not only volume but also the connectivity of the virtual water trade.
Figure 1.A comparison between virtual water export and crop export during the period 2006–2010 (wheat, barley, rice, rye, sorghum, maize, and bean crops).(a)Crop export and green water export and(b)crop export and blue water export.
Figure 2.The GVWT network through food and feed crop trade in 2010.(a)Food crops (wheat, barley, rice, rye, and sorghum) and(b)feed crops (maize and soybean).
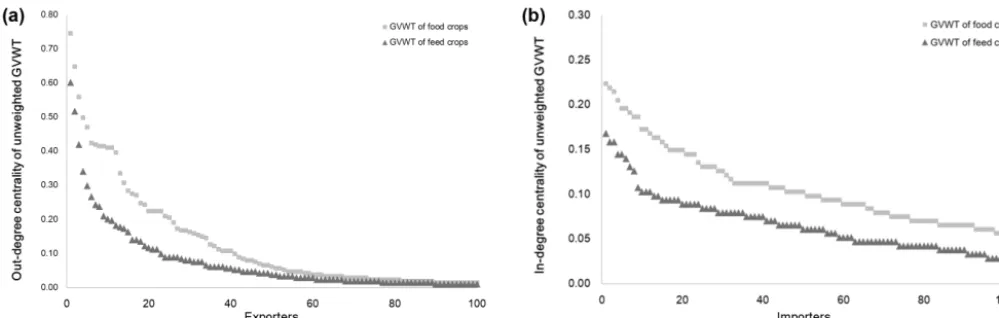
the results. The exporters in GVWT for food crops had more connectivity with expanded structure than the exporters in GVWT for feed crops. In addition, importers in the GVWT of the food trade had various connections with exporters.
Considering the out-degree centrality of GVWT for food crops, the USA displays expanded connectivity with various importers, followed by Asian countries, such as Thailand, Pakistan, Vietnam, and India. Ukraine also had high connec-tivity to various importers characterized by large amounts of virtual water export. These countries play the main role for virtual water supply in the GVWT. In contrast, the Russian Federation, Kazakhstan, and Australia had lower connectiv-ity, even though they exported a lot of virtual water by the
[image:5.612.56.545.299.505.2]Figure 3.Out- and in-degree centrality in connection network of GVWT for food and feed crops during the period 2006–2010.(a)Out-degree centrality and(b)in-degree centrality.
connections. On the other hand, China and Thailand were the only Asian countries in the top 15 exporters according to the number of connections. However, in this study, we found that Pakistan, India, and Vietnam also had high connectivity in virtual water export through food crops, because we ana-lyzed the connectivity of the virtual water trade of food and feed crops, respectively.
In-degree centrality indicated the connection of virtual wa-ter import according to the imporwa-ter’s perspective. There-fore, the importer with a high rank of in-degree centrality imports virtual water from various exporters, meaning that this importer has a robust trade structure. If the importer has a low rank of in-degree centrality with a larger volume of vir-tual water import, then this importer might be highly depen-dent on just a few exporters. For example, Egypt and Japan imported a lot of virtual water by food crop trade, but the rank of in-degree centrality was 21st and 33rd, respectively. Egypt imported over 50 % of wheat from only the USA and Russian Federation. In terms of feed crop trade, most vir-tual water was imported to China, but the connectivity was very low. In contrast, the Netherlands, Spain, and Germany had high ranks in both the volume and connectivity of vir-tual water import through the feed crop trade: results indicat-ing that these countries have robust trade structures. In fact, the European countries have a robust internal trade network with various connections among European countries. Konar et al. (2011) also found that the USA, UK, Germany, Canada, and Netherlands were the top five importers. On the other hand, Saudi Arabia and Hong Kong were the only Asian countries in the top 15 importers. These results are similar in this study; for example, European countries had higher con-nectivity than Asian countries.
3.2.2 Evaluation of vulnerability of virtual water importers through the connectivity and volume of GVWT
In the trend of the increase of crop trade, when the GVWT is concentrated in a few countries, the main exporters could dominate a few importers. This means that these importers might be dependent on a few exporters with a low resilience structure. Therefore, we evaluated the vulnerability of vir-tual water importers through the connectivity and volume of GVWT. Figure 4 shows the average virtual water import from one exporter. In terms of GVWT for food crops, Mexico imported an average of 8.1 Gm3from one exporter, meaning that Mexico is highly dependent on a few exporters. In the case of feed crop trade, China has the largest average quan-tity of virtual water imported from one exporter, followed by Mexico and Uruguay. Konar et al. (2011) analyzed the strength of each link in the VWT and found that the link be-tween the USA and Mexico was the second largest link. In these importers, virtual water import could be a main issue for sustainable water management, but the VWT, which is highly dependent on a few exporters, could be regarded as a vulnerable trade structure. Therefore, it is important to un-derstand the vulnerability of VWT with consideration of the connectivity and volume of virtual water import.
In this study, the importers of VWT were classified in terms of both connectivity and volume of virtual water im-port. Tables 2 and 3 classify importing countries according to the volume (I–III) and connectivity (A–C) of GVWT, re-spectively.
Figure 4.The intensive inflow of virtual water by food and feed crops import.(a)Food crops (wheat, barley, rice, rye, and sorghum) and (b)feed crops (maize and soybean).
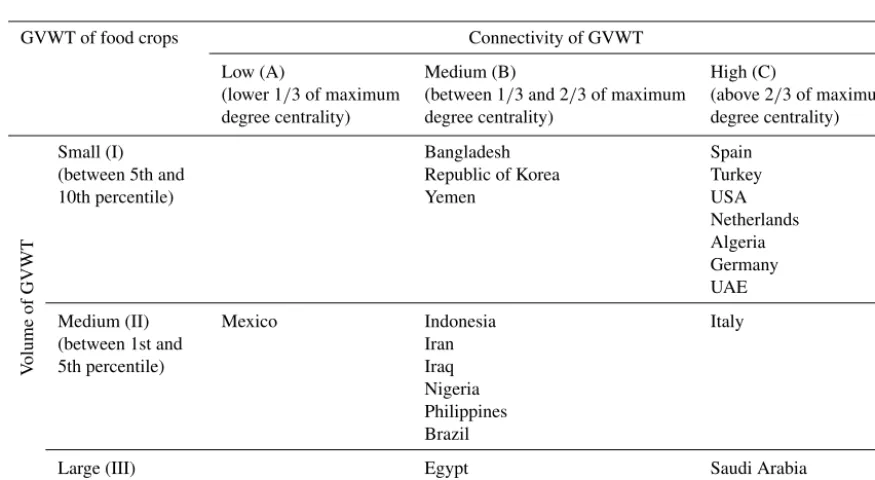
Table 2.Classification of importers by connectivity and volume of GVWT for food crops (wheat, barley, rice, and others).
GVWT of food crops Connectivity of GVWT
Low (A) Medium (B) High (C)
(lower 1/3 of maximum (between 1/3 and 2/3 of maximum (above 2/3 of maximum degree centrality) degree centrality) degree centrality)
V
olume
of
GVWT
Small (I) Bangladesh Spain
(between 5th and Republic of Korea Turkey
10th percentile) Yemen USA
Netherlands Algeria Germany UAE
Medium (II) Mexico Indonesia Italy
(between 1st and Iran
5th percentile) Iraq
Nigeria Philippines Brazil
Large (III) Egypt Saudi Arabia
(top 1st percentile) Japan
The small volume group (I) includes countries that im-ported above the top 10th percentile and below the top 5th percentile of total virtual water import; the medium group (II) includes the countries that imported over the top 5th per-centile and below the top 1st perper-centile of total virtual water import. Finally, the large volume group (III) includes coun-tries that imported over the top 1st percentile of total virtual water import.
In addition, the vulnerable virtual water trade could be related to the connectivity; therefore, we classified the im-porters into high, medium, and low-connectivity groups, us-ing the degree centrality of links. The importers who have
[image:7.612.78.516.307.547.2]Table 3.Classification of importers by connectivity and volume of GVWT for feed crops (maize and soybean).
GVWT of feed crops Connectivity of GVWT
Low (A) Medium (B) High (C)
(lower 1/3 of maximum (between 1/3 and 2/3 of maximum (above 2/3 of maximum degree centrality) degree centrality) degree centrality)
V
olume
of
GVWT
Small (I) Colombia Taiwan UK
(between 5th and Uruguay Iran 10th percentile) Thailand
Vietnam Egypt Malaysia
Medium (II) Mexico Indonesia Italy
(between 1st and Republic of Korea France
5th percentile) Spain
Germany
Large (III) China Netherlands
(top 1st percentile) Japan
classified into the A-III sector, we considered that they had intensive virtual water import with vulnerable structure.
In food crops, the upper 10 % of virtual water import, 25.1 Gm3was set as the threshold value, and the upper 1st and 5th percentiles of virtual water import were 37.3 and 72.9 Gm3, respectively. Therefore, the importers in the large volume group imported over 72.9 Gm3of virtual water dur-ing 2006–2010 through food crops. The maximum value of degree centrality was 0.22. Therefore, the high-connectivity group included those importers who had a degree central-ity between 0.15 and 0.22. The low-connectivcentral-ity group in-cluded those importers who had lower than 0.07 centrality. Mexico, which was located in the A-II sector, was a vulnera-ble importer in GVWT. In addition, the phenomenon of low in-degree centrality with links of GVWT was shown in Asia countries, even if they imported a lot of virtual water. For ex-ample, Iran and the Philippines were classified into B-II sec-tor, and even Japan was classified into B-III. However, Euro-pean countries, such as Spain, Turkey, and the Netherlands, were classified into C-I sector. These results represented that the Asian countries imported a lot of virtual water from just a few exporters, and the European countries were connected to various exporters, even if they imported a comparable quan-tity of virtual water.
In feed crops, the upper 10 % of virtual water import, 23.8 Gm3was set as the threshold value, and the upper 1st and 5th percentiles of virtual water import were 42.3 and 103.6 Gm3, respectively. Therefore, the importers in the large volume group imported over 103.6 Gm3of virtual water dur-ing 2006–2010 through food crops. The maximum value of degree centrality was 0.17. Therefore, the high-connectivity group included importers who had a degree centrality be-tween 0.11 and 0.17. The low-connectivity group included the importers who had lower than 0.06 centrality. Mexico, the
Republic of Korea, and Germany were in sector II, but Mex-ico (A-II sector) and the Republic of Korea (B-II sector) had lower connectivity than that of Germany (C-II sector); that is, Mexico and the Republic of Korea imported large amounts of virtual water from a few countries and had a vulnerable GVWT structure. In addition, China was regarded as an ex-clusive importer in the GVWT network. In contrast, Euro-pean countries, such as the Netherlands, Spain, France, Italy, and Germany, had a more distributed structure than eastern Asian countries, who imported large volumes of virtual water by feed crop trade.
3.2.3 GVWT impacts on water savings in importing countries
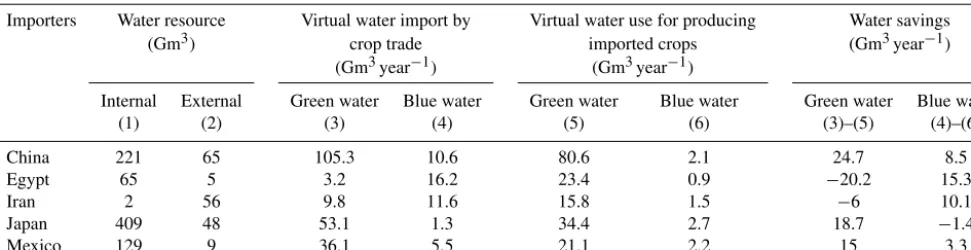
Virtual water trade could help the importers save water re-sources by crops import. For example, if the importing coun-try replaces crop import with domestic production, this will be accompanied by additional water use. Table 4 shows the water savings by virtual water import in main importers from 2006 to 2010. China and Japan, respectively, saved 24.7 and 18.7 Gm3year−1of green water by crops import, while Egypt and Iran, respectively, saved 15.3 and 10.1 Gm3year−1 of blue water by crops import, depending on irrigation water for domestic crop production. In particular, Egypt and Iran have few water resources; therefore, the virtual water impacts on water resource savings in these countries might be larger than on other importers.
ex-Table 4.Water resource and virtual water savings by importing crops.
Importers Water resource Virtual water import by Virtual water use for producing Water savings (Gm3) crop trade imported crops (Gm3year−1)
(Gm3year−1) (Gm3year−1)
Internal External Green water Blue water Green water Blue water Green water Blue water
(1) (2) (3) (4) (5) (6) (3)–(5) (4)–(6)
China 221 65 105.3 10.6 80.6 2.1 24.7 8.5
Egypt 65 5 3.2 16.2 23.4 0.9 −20.2 15.3
Iran 2 56 9.8 11.6 15.8 1.5 −6 10.1
Japan 409 48 53.1 1.3 34.4 2.7 18.7 −1.4
Mexico 129 9 36.1 5.5 21.1 2.2 15 3.3
port on global and local areas in terms of economic impacts (Welton, 2011). Wheat import in Egypt has a high depen-dency on the Russian Federation’s export, which we regarded as a vulnerable structure, and the insufficient import of crops due to the export ban in the Russian Federation could bring not only economic impacts but also serious water consump-tion for increasing domestic food producconsump-tion. Chapagatin et al. (2006) found the import of wheat in Egypt contributed to a national water saving of 3.6 Gm3year−1during 1997–2001, which according to the 1959 agreement was about 7 % of the total volume of water to which Egypt was entitled. Fader et al. (2011) also found that some water-scarce countries, such as China, Mexico, the Netherlands, and Japan, would need relatively high amounts of water to produce the goods they otherwise import: meaning that they save high amounts of water by importing goods. Therefore, if they stopped im-porting and exim-porting agricultural products, these countries would need to use more water in their agricultural sectors (Fader et al., 2011). In other words, a vulnerable trade struc-ture with low connectivity could be one of the main reasons for water shortage problems.
3.3 Analysis of influential countries in GVWT using eigenvector centrality
GVWT is complicated to understand and it is difficult to es-timate the influence of each trader on GVWT. A country that has relationships with main exporters and importers could influence the GVWT, even if the volume of trade is small. Apart from degree centrality, such a country would have distinctive centrality in terms of the influence on the entire GVWT network.
Accordingly, we estimated the eigenvector centrality of green and blue water trade in GVWT and used degree and eigenvector centrality to analyze the influential importers and exporters. The degree centrality shows the connectivity and volume of the VWT, and the eigenvector centrality shows the influence of countries on the entire GVWT network struc-ture. Therefore, the most influential traders have a high de-gree and eigenvector centrality at the same time, and the
other traders should pay attention to changes of trade policy and water management of the influential traders.
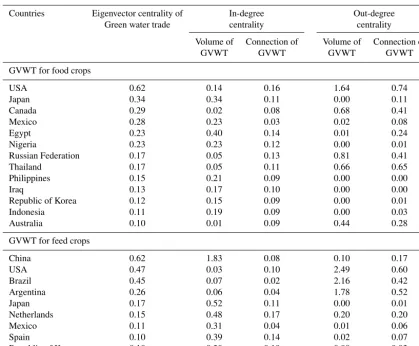
Tables 5 and 6 indicate the eigenvector centrality in green and blue water trade, and the degree centrality in connec-tion and volume of the GVWT network, respectively. The USA showed high out-degree centrality and high eigenvec-tor centrality, which indicates the USA was the most influen-tial exporter in the green water trade through the food crop trade. The green water trade also had secondary influential exporters, such as Canada, the Russian Federation, Thailand, and Australia. In terms of import, Japan, Mexico and Egypt represented the influential importers for green water trade, and the influence importing area of green water trade was distributed between South America, Europe, western Asia, and eastern Asia.
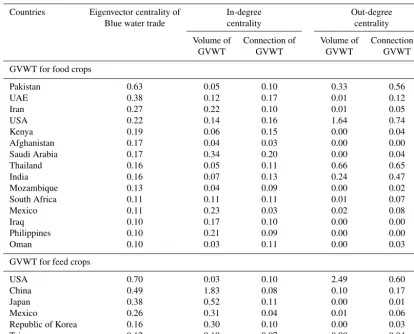
In contrast, the influential exporters and importers of the blue water trade differed from the green water trade. The in-fluential global blue water exporters by food crops were the USA, Pakistan, India, and Thailand, while global blue water import was dominated by western Asia, including Iran, Saudi Arabia, and the UAE.
For feed crops, the green water in the USA, Brazil, and Argentina was exported to eastern Asian countries, such as China, the Republic of Korea, and Japan. In particular, Brazil and Argentina were dependent on green water. However, the USA overwhelmingly used a lot of blue water to ex-port maize and bean crops. The USA, Mexico, China, and Japan constructed influential lines from the Americas to east-ern Asia.
[image:9.612.54.540.86.211.2]Table 5.Eigenvector centrality of green water trade and degree centrality of GVWT.
Countries Eigenvector centrality of In-degree Out-degree Green water trade centrality centrality
Volume of Connection of Volume of Connection of
GVWT GVWT GVWT GVWT
GVWT for food crops
USA 0.62 0.14 0.16 1.64 0.74
Japan 0.34 0.34 0.11 0.00 0.11
Canada 0.29 0.02 0.08 0.68 0.41
Mexico 0.28 0.23 0.03 0.02 0.08
Egypt 0.23 0.40 0.14 0.01 0.24
Nigeria 0.23 0.23 0.12 0.00 0.01
Russian Federation 0.17 0.05 0.13 0.81 0.41
Thailand 0.17 0.05 0.11 0.66 0.65
Philippines 0.15 0.21 0.09 0.00 0.00
Iraq 0.13 0.17 0.10 0.00 0.00
Republic of Korea 0.12 0.15 0.09 0.00 0.01
Indonesia 0.11 0.19 0.09 0.00 0.03
Australia 0.10 0.01 0.09 0.44 0.28
GVWT for feed crops
China 0.62 1.83 0.08 0.10 0.17
USA 0.47 0.03 0.10 2.49 0.60
Brazil 0.45 0.07 0.02 2.16 0.42
Argentina 0.26 0.06 0.04 1.78 0.52
Japan 0.17 0.52 0.11 0.00 0.01
Netherlands 0.15 0.48 0.17 0.20 0.20
Mexico 0.11 0.31 0.04 0.01 0.06
Spain 0.10 0.39 0.14 0.02 0.07
Republic of Korea 0.10 0.30 0.10 0.00 0.03
Canada, and Paraguay. In addition, Thailand and Paraguay used 39.5 and 54.2 % of domestic virtual water use, respec-tively, for virtual water export, and the dependence on inter-nal water resources was over 10 % in both countries. There-fore, virtual water export of these countries could be strongly affected by internal water resources, and this could have a negative impact on importers.
4 Conclusions
Crop production is accompanied by water consumption; thus the water resource status in the exporting country could also affect the crop trade. The virtual water trade could help im-porters save national water resources by importing crops. For example, if the importing country replaced imported crops with domestic production, this would be accompanied by ad-ditional water use. National water savings achieved by the virtual water trade are equal to the import volume multi-plied by the volume of water required to domestically pro-duce the commodity. However, the virtual water trade could cause water “losses” for the exporting countries (Chapagain et al., 2006). For example, countries whose major industry is
agriculture spend their water resources on the food trade. In addition, the available global freshwater is decreasing due to climate change, suggesting that water should be considered a precious natural resource.
connec-Table 6.Eigenvector and degree centrality of blue water trade and degree centrality of GVWT.
Countries Eigenvector centrality of In-degree Out-degree Blue water trade centrality centrality
Volume of Connection of Volume of Connection of
GVWT GVWT GVWT GVWT
GVWT for food crops
Pakistan 0.63 0.05 0.10 0.33 0.56
UAE 0.38 0.12 0.17 0.01 0.12
Iran 0.27 0.22 0.10 0.01 0.05
USA 0.22 0.14 0.16 1.64 0.74
Kenya 0.19 0.06 0.15 0.00 0.04
Afghanistan 0.17 0.04 0.03 0.00 0.00
Saudi Arabia 0.17 0.34 0.20 0.00 0.04
Thailand 0.16 0.05 0.11 0.66 0.65
India 0.16 0.07 0.13 0.24 0.47
Mozambique 0.13 0.04 0.09 0.00 0.02
South Africa 0.11 0.11 0.11 0.01 0.07
Mexico 0.11 0.23 0.03 0.02 0.08
Iraq 0.10 0.17 0.10 0.00 0.00
Philippines 0.10 0.21 0.09 0.00 0.00
Oman 0.10 0.03 0.11 0.00 0.03
GVWT for feed crops
USA 0.70 0.03 0.10 2.49 0.60
China 0.49 1.83 0.08 0.10 0.17
Japan 0.38 0.52 0.11 0.00 0.01
Mexico 0.26 0.31 0.04 0.01 0.06
Republic of Korea 0.16 0.30 0.10 0.00 0.03
[image:11.612.89.504.103.437.2]Taiwan 0.12 0.19 0.07 0.00 0.04
Table 7.Water resource and virtual water use for production and exporting crops.
Exporters Water resource Virtual water use for Virtual water export Proportion of virtual (Gm3) crop production by crop trade water export
(Gm3year−1) (Gm3year−1) (%)
Internal External Green Blue Green Blue {(5)+(6)}/ {(5)+(6)}/ (1) (2) water water water water (1) {(3)+(4)}
(3) (4) (5) (6)
Argentina 276 538 140.6 1.2 90.5 0.4 32.9 64.1
Brazil 5418 2815 213.5 0.1 92.8 0.0 1.7 43.5
Canada 2850 52 42.5 0.2 28.7 0.1 1.0 67.5
France 200 11 34.2 1.6 15.4 0.6 8.0 44.9
Pakistan 55 192 21.2 53.2 3.2 10.6 25.1 18.6
Paraguay 94 242 19.1 0.0 10.4 0.0 11.0 54.2
Russian Federation 4313 195 168.5 4.2 33.9 0.5 0.8 19.9
Thailand 226 214 59.4 12.1 23.4 4.8 12.6 39.5
Ukraine 53 86 48.1 0.7 9.9 0.4 19.4 21.1
[image:11.612.57.540.504.701.2]tivity and imported a lot of virtual water. VWT could bring national water savings, but the vulnerable structure of VWT could cause problems of water security for importers. For ex-ample, Egypt had 15.3 Gm3year−1blue water saving effects through GVWT; thus its vulnerable structure could cause wa-ter shortage problems.
A few countries that we term influential countries could change the entire GVWT network. In addition, if the influ-ential countries have water shortages, it becomes not only a national-scale problem but also a global threat. Therefore, we classified the influential countries in GVWT using eigenvec-tor centrality, which is generally used to measure influence on an entire network. For the food crop trade, the influential traders were distinguished by green and blue water trades. For example, the USA, Russian Federation, Thailand, and Canada were classified as influential traders in green water trade. However, western Asia, Pakistan, and India were clas-sified as influential traders in blue water trade. The feed crop trade was much more dominated by green water than by blue water, and the USA, Brazil, and Argentina were classified as the most influential traders. In particular, Argentina and Pak-istan used a high proportion of internal water resources for virtual water export (32.9 and 25.1%, respectively); thus the other traders should consider the water resource management in these exporters carefully. This study could provide infor-mation for an integrated global water strategy and arouse the main importers’ attention to the risk of serious dependency on foreign water resources.
5 Data availability
The international trade data are available via a Personal Com-puter Trade Analysis System (PC-TAS), produced by the United Nations Statistics Division (UNSD). The results data for this study are freely available by contacting the corre-sponding author.
The Supplement related to this article is available online at doi:10.5194/hess-20-4223-2016-supplement.
Acknowledgements. The international trade data are available via a Personal Computer Trade Analysis System (PC-TAS), produced by the United Nations Statistics Division (UNSD). The results data for this study are freely available by contacting the corresponding author.
Edited by: L. Wang
Reviewed by: two anonymous referees
References
Aldaya, M. M., Allan, J., and Hoekstra, A. Y.: Strategic importance of green water in international crop trade, Ecol. Econ., 69, 887– 894, 2010.
Allan, J. A.: Fortunately there are substitutes for water otherwise our hydro-political futures would be impossible, in: Priorities for water resources allocation and management, ODA, London, UK, 13–26, 1993.
Biewald, A., Rolinski, S., Camoen, H., Schmitz, C., and Dietrich, J.: Valuing the impact of trade on local blue water, Ecol. Econ., 101, 43–53, 2014.
Bonacich, P.: Factoring and weighting approaches to status scores and clique identification, J. Math. Sociol., 2, 113–120, 1972. Bulsink, F., Hoekstra, A. Y., and Booij, M. J.: The water footprint
of Indonesian provinces related to the consumption of crop prod-ucts, Hydrol. Earth Syst. Sci., 14, 119–128, doi:10.5194/hess-14-119-2010, 2010.
Chapagain, A. K., Hoekstra, A. Y., and Savenije, H. H. G.: Wa-ter saving through inWa-ternational trade of agricultural products, Hydrol. Earth Syst. Sci., 10, 455–468, doi:10.5194/hess-10-455-2006, 2006.
Dalin, C., Konar, M., Hanasaki, N., Rinaldo, A., and Rodriguez-Iturbe, I.: Evolution of the global virtual water trade network, P. Natl. Acad. Sci. USA., 109, 5989–5994, 2012.
Fader, M., Gerten, D., Thammer, M., Heinke, J., Lotze-Campen, H., Lucht, W., and Cramer, W.: Internal and external green-blue agri-cultural water footprints of nations, and related water and land savings through trade, Hydrol. Earth Syst. Sci., 15, 1641–1660, doi:10.5194/hess-15-1641-2011, 2011.
Freeman, L. C.: Centrality in social network: conceptual clarifica-tion, Soc. Networks, 1, 215–239, 1979.
Hanasaki, N., Inuzuka, T., Kanae, S., and Oki, T.: An estimation of global virtual water flow and sources of water withdrawal for major crops and livestock products using a global hydrological model, J. Hydrol., 384, 232–244, 2010.
Hanjra, M. A. and Qureshi, M. E.: Global water crisis and future food security in an era of climate change, Food Policy, 35, 365– 377, 2010.
Hoekstra, A. Y. (Ed.): Virtual water trade, in: Proceedings of the International Expert Meeting on Virtual Water Trade, UNESCO-IHE, Delft, the Netherlands, Value of Water Research Report Se-ries No. 12, 248 pp., 2003.
Hoekstra, A. Y. and Chapagain, A. K.: Globalization of Water: Shar-ing the Planet’s Freshwater Resources, Blackwell Publ., Oxford, UK, 224 pp., 2008.
Hoekstra, A. Y. and Hung, P. Q.: Globalisation of water resources: international virtual water flows in relation to crop trade, Global Environ. Chang., 15, 45–56, 2005.
Hoekstra, A. Y., Chapagain, A. K., and Aldaya, M. M.: The water footprint assessemnt manual, Earthscan, London, UK, 2011. Konar, M., Dalin, C., Suweis, S., Hanasaki, N., Rinaldo A.,
and Rodriguez-Iturbe, I.: Water for food: The global vir-tual water trade network, Water Resour. Res., 47, W05520, doi:10.1029/2010WR010307, 2011
Konar, M., Hussein, Z., Hanasaki, N., Mauzerall, D. L., and Rodriguez-Iturbe, I.: Virtual water trade flows and savings un-der climate change, Hydrol. Earth Syst. Sci., 17, 3219–3234, doi:10.5194/hess-17-3219-2013, 2013.
Mekonnen, M. M. and Hoekstra, A. Y.: The green, blue and grey water footprint of crops and derived crop products, Hy-drol. Earth Syst. Sci., 15, 1577–1600, doi:10.5194/hess-15-1577-2011, 2011.
Molden, D.: Water for food, water for life, Earthscan, London, and International Water Management Institute, Colombo, 2007. Mubako, S., Lahiri, S., and Lant, C.: Input-output analysis of
vir-tual water transfers: Case study of California and Illinois, Ecol. Econ., 93, 230–238, 2013.
Novo, P., Garrido, A., and Varela-Ortega, C.: Are virtual water “flows” in Spanish grain trade consistent with relative water scarcity?, Ecol. Econ., 68, 1454–1464, 2009.
Ruhnau, B.: Eigenvector-centrality: a node-centrality?, Soc. Net-works, 22, 357–365, 2000.
Van Oel, P. R., Mekonnen, M. M., and Hoekstra, A. Y.: The exter-nal water footprint of the Netherlands: Geographically-explicit quantification and impact assessment, Ecol. Econ., 69, 82–92, 2009.
Welton, G.: The impact of Russia’s 2010 grain export ban, Oxfam Policy and Practice: Agriculture, Food and Land, 11, 76–107, 2011.
WMO (World Meteorological Organization): The Global Climate 2001–2010, A decade of climate extremes summary report, WMO, WMO-No. 1119, 1–20, 2013.