ScholarWorks @ Georgia State University
ScholarWorks @ Georgia State University
Psychology Theses Department of Psychology
Summer 8-16-2010
Building toward an Intervention for Alcohol-Related Aggression: A
Building toward an Intervention for Alcohol-Related Aggression: A
Cognitive and Behavior Test of the Attention Allocation Model
Cognitive and Behavior Test of the Attention Allocation Model
Kathryn Elise Gallagher
Georgia State University
Follow this and additional works at: https://scholarworks.gsu.edu/psych_theses
Recommended Citation Recommended Citation
Gallagher, Kathryn Elise, "Building toward an Intervention for Alcohol-Related Aggression: A Cognitive and Behavior Test of the Attention Allocation Model." Thesis, Georgia State University, 2010.
https://scholarworks.gsu.edu/psych_theses/74
BUILDINGING TOWARD AN INTERVENTION FOR ALCOHOL-RELATED
AGGRESSION: A COGNITIVE AND BEHAVIOR TEST OF THE ATTENTION
ALLOCATION MODEL
by
KATHRYN E. GALLAGHER
Under the Direction of Dominic J. Parrott, Ph.D.
ABSTRACT
This study provided the first direct test of the cognitive underpinnings of the attention-allocation
model and attempted to replicate and extend past behavioral findings for this model as an
explanation for alcohol-related aggression. Men were randomly assigned to a beverage
(Alcohol, No-Alcohol Control) and a distraction (Moderate Distraction, No Distraction)
condition. All men were provoked by a male confederate and completed a dot probe task and a
laboratory aggression task without distraction or while presented with a moderate distraction
task. Results indicated that intoxicated men whose attention was distracted displayed
significantly lower levels of aggression bias and enacted significantly less physical aggression
than intoxicated men whose attention was not distracted. However, aggression bias did not
no-distraction, condition. Discussion focused on how these data inform intervention programming
for alcohol-related aggression.
BUILDINGING TOWARD AN INTERVENTION FOR ALCOHOL-RELATED
AGGRESSION: A COGNITIVE AND BEHAVIOR TEST OF THE ATTENTION
ALLOCATION MODEL
by
KATHRYN E. GALLAGHER
A Thesis Submitted in Partial Fulfillment of the Requirements for the Degree of
Master of Arts
in the College of Arts and Sciences
Georgia State University
Copyright by Kathryn Elise Gallagher
BUILDINGING TOWARD AN INTERVENTION FOR ALCOHOL-RELATED
AGGRESSION: A COGNITIVE AND BEHAVIOR TEST OF THE ATTENTION
ALLOCATION MODEL
by
KATHRYN E. GALLAGHER
Committee Chair: Dominic J. Parrott
Committee: Erin B. McClure Tone
Roger Bakeman
Electronic Version Approved:
Office of Graduate Studies
College of Arts and Sciences
Georgia State University
ACKNOWLEDGMENTS
This research could not have been completed without the excellent mentorship I received
from my advisor Dominic Parrott and his grant R01-AA-015445 from the National Institute of
Alcohol Abuse and Alcoholism. I would also like to thank Adam Hudepohl, Cameron Miller,
and Lauren Walther for their assistance with data collection. Finally, I would like to thank Erin
TABLE OF CONTENTS
ACKNOWLEDGMENTS iv
LIST OF TABLES vii
LIST OF FIGURES viii
INTRODUCTION 1
Theoretical Explanations for Intoxicated Aggression 2
Alcohol Myopia Theory 5
Attentional Bias and Aggression 15
Overview of the Proposed Study and Hypotheses 19
METHOD 23
Recruitment Procedures and Eligibility Criteria 23
Participants and Experimental Design 24
Materials 25
Deception Manipulation 29
Beverage Administration 30
Provocation 31
Procedure 32
Debriefing and Compensation 36
RESULTS 39
Manipulation checks 39
Data Preparation 40
Regression Analyses 41
Effects of Distraction on Alcohol-Facilitated Attentional Bias 44
Effects of Alcohol, Distraction, and Attentional Bias on Physical Aggression 46
Reaction Times (RT’s) on the TAP 47
DISCUSSION 48
Effects of Distraction on Alcohol-Facilitated Physical Aggression 49
Effects of Distraction on Alcohol-Facilitated Attentional Bias 51
Effects of Alcohol, Distraction, and Attentional Bias on Physical Aggression 52
Inhibition Conflict 54
Limitations 55
Clinical Implications 56
Concluding Summary 58
REFERENCES 59
APPENDIXES A: CONDITIONS FOR VISUAL PROBE TASK 71
LIST OF TABLES
Table 1. Acute Alcohol Intoxication, Inhibition Conflict, and Aggression
Table 2. The Interactive Effect of Provocation and Distraction on Likelihood of AggressiveAction
LIST OF FIGURES
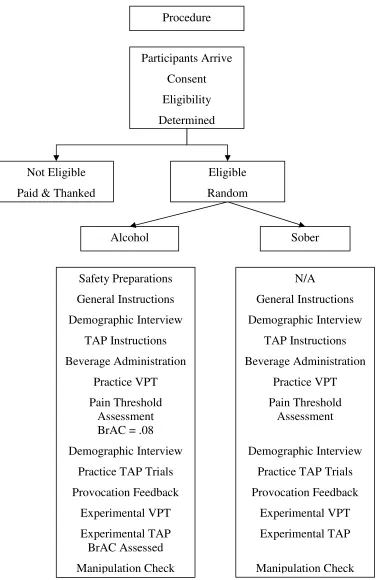
Figure 1. Procedure for the Present Study
Figure 2. Effect of Distraction on the Relation Between Beverage Consumption and Aggression
INTRODUCTION
Evidence for the link between acute alcohol consumption and aggression is
well-established. Conservative estimates from a recent nationally representative study indicate that
alcohol was involved in 63% of intimate partner violence episodes, 39%-45% of murders,
32%-40% of sexual assaults, and 45%-46% of physical assaults (Greenfeld & Henneberg, 2001).
Although the long-term effects of chronic alcohol use have been the primary focus of aggression
research in the past (Naranjo & Bremner, 1993), recent research suggests that it is the acute
effects of alcohol intoxication that impact aggressive behavior the most (Chermack & Blow,
2002; Murphy, Winters, O’Farrell, Fals-Stewart, & Murphy, 2005). Indeed, laboratory-based
studies have consistently established that participant aggression increases when alcohol is
administered (for a review, see Bushman & Cooper, 1990; Ito, Miller, & Pollock, 1996; Steele &
Southwick, 1985).
Though correlational research has led to significant advancements in the understanding of
the link between history of alcohol consumption and aggression, experimental research has
elucidated the theoretical mechanisms that underlie this association. Such studies typically
involve the use of laboratory-based paradigms designed to directly measure aggressive behavior
in intoxicated participants. Though researchers were once reluctant to use experimental
methodology to examine alcohol-related aggression, the emergence of these paradigms has
allowed researchers to pursue this work in a safe and ethical manner. In fact, this methodology
has generated the most direct evidence to support a causal link between alcohol and aggression
(Taylor, 1993).
To date, the most popular of these laboratory-based paradigms is the Taylor Aggression
Giancola & Zeichner, 1995a; Zeichner, Parrott, & Frey, 2003; Zeichner & Pihl, 1979).
Extensive support has been obtained for the reliability and validity of these paradigms as direct
measures of physical aggression (for a review, see Anderson & Bushman, 1997; Giancola &
Chermack, 1998; Giancola & Parrott, 2008). In a traditional TAP study, a participant delivers
and receives electric shocks to and from a fictitious opponent under the guise of a competitive
reaction time task. The win-loss sequence, as well as the levels of shock participants receive
when they lose trials, are predetermined and controlled by a computer program. Participants are
free to deliver a range of shocks to their opponent when they win trials. Accordingly, aggression
is derived from the intensity and duration of shock a person selects to deliver to his/her fictitious
opponent (Taylor 1967; 1993; Giancola & Chermack, 1998; Giancola & Parrott, 2008). Though
this methodology has greatly impacted alcohol and aggression research, meta-analytic studies
that do not involve laboratory aggression paradigms have also supported a causal link between
alcohol intoxication and increased aggression (Bushman & Cooper, 1990; Ito et al., 1996; Steele
& Southwick, 1985).
Theoretical Explanations for Intoxicated Aggression
Despite the causal link between acute alcohol consumption and aggressive behavior, the
exact mechanisms by which alcohol increases aggression remain unclear. In response, numerous
theories for this relation have been advanced. The three most prominent explanations for
intoxicated aggression propose that the pharmacological properties of alcohol impact aggressive
behavior by decreasing the anxiety/fear response (Pihl, Peterson, & Lau, 1993), increasing
arousal (Rule & Nesdale, 1976), and disrupting executive cognitive functioning (Giancola, 2000,
Alcohol reduces fear. Extant research suggests equivocal findings between alcohol
intoxication and anxiety/fear. Specifically, alcohol has been shown to increase, decrease, or
have no impact on the anxiety/fear response (Cappell & Greeley, 1987; Sher, 1987; Steele &
Josephs, 1988). This inconsistently has led to mixed findings in the alcohol and aggression
literature. For example, alcohol has been shown to facilitate aggression by decreasing an
individual’s fear and/or anxiety response (Pihl, Peterson, & Lau, 1993). For example, while
sober, a provoked individual may experience heightened anxiety and/or fear due to the negative
consequences (e.g., retaliation, jail) associated with aggressive behavior. In this instance, the
experience of anxiety and fear is posited to suppress an aggressive response because the
anxiety/fear response facilitates attention toward potential negative consequences. However, if
intoxicated, the same individual is presumably less likely to experience anxiety and fear due to
the anxiolytic effects of alcohol. As such, the intoxicated individual is more likely to respond
with aggressive behavior (Ito et al., 1996; Phillips & Giancola, 2008). However, other research
indicates that alcohol increases anxiety/fear and subsequent aggression (Parrott, Gallagher, &
Zeichner, under review). This research posits that heightened anxiety/fear narrows attention onto
threat-related stimuli in intoxicated individuals, which consequently increases aggressive
behavior.
Alcohol increases arousal. Increased arousal has been associated with aggressive
behavior (for a review, see Anderson & Bushman, 2002; Rule & Nesdale, 1976). Moreover,
alcohol consumption has been found to differentially impact arousal on the ascending and
descending limbs of the Blood Alcohol Content (BAC) curve (Addicott, Marsh-Richard,
Mathias, & Dougherty, 2007; Giancola & Zeichner, 1997; Martin, Earleywine, Musty, Perrine,
ascending limb of the BAC curve when the stimulant effects (e.g., vigor) of alcohol intoxication
are most prominent. Conversely, human arousal reportedly decreases during the descending
limb of the BAC curve when the sedative effects (e.g., fatigue) of alcohol intoxication are most
prominent. Accordingly, experimental research has shown that aggression most often occurs
during the ascending limb of intoxication (Giancola & Zeichner, 1997).
Alcohol reduces inhibitory control. The pharmacological effects of alcohol have been
shown to disrupt executive cognitive functioning that is central to maintaining inhibitory control
over behavior (Giancola, 2000, 2004; Steele & Josephs, 1990). Giancola (2000) suggested that
these cognitive abilities are part of an overall construct of executive functioning. Specifically,
the cognitive abilities central to this disruption include abstract reasoning, conceptualization,
planning, problem solving, decision making, information processing, and inhibition (Chermack
& Giancola, 1997; Kimberg & Farah, 1993; Steele & Josephs, 1990). Thus, the robust relation
between alcohol-induced executive cognitive impairment and aggression is not surprising.
Nevertheless, it is important to note that the literature on cognitively mediated intoxicated
aggression is extensive, and myriad other factors have been investigated to account for this
relation. For example, rather than focusing on the pharmacological effects of alcohol, much
research has demonstrated that alcohol-related expectancies also engender aggression (for a
review, see Quigley & Leonard, 2006). Though expectancy theory has produced robust findings
in the alcohol and aggression literature, other research has found evidence to contradict the
expectancy-aggression relationship (e.g., Giancola, Godlaski, & Parrott, 2006; Giancola &
Zeichner, 1997). Though interesting, exploring all of these factors is beyond the scope of the
cognitive explanation of the alcohol and aggression relation that has eluded significant empirical
investigation – alcohol myopia theory.
Alcohol Myopia Theory
Alcohol myopia theory (AMT) provides a theoretical framework to explain the relation
between alcohol intoxication and aggressive behavior. Components of this theory were first
introduced by Pernanen (1976) and Taylor and Leonard (1983) and later expanded upon by
Steele and Josephs (1990). According to AMT, the pharmacological properties of alcohol impair
cognitive functioning in the inebriate by (1) narrowing attentional focus, (2) restricting the range
of cues that can be processed, and (3) reducing capacity to process and generate meaning from
cues that are processed. Because in most real-world situations cues that instigate behavior are
more salient and easier to process than cues that inhibit behavior, intoxication is likely to
produce myopia toward cues that instigate behavior (e.g., aggression). However, it is also
important to note that alcohol does not “tie us to a roller-coaster ride of immediate impulses
arising from whatever cues are salient” on every drunken occasion (Steele & Josephs, 1990; p.
354). Indeed, alcohol intoxication does not facilitate aggression for all persons or for persons in
all situations. Thus, as part of AMT, Steele and colleagues put forth the inhibition conflict
model and the attention-allocation model to explain when and why myopia may influence
behavior.
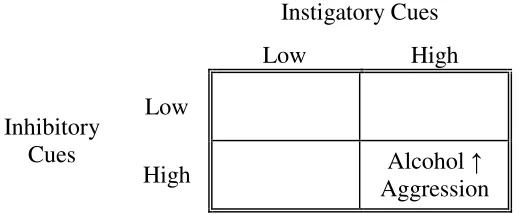
Inhibition Conflict. Inhibition conflict (IC) was advanced by Steele and colleagues
(Steele & Josephs, 1990; Steele & Southwick, 1985) to elucidate when intoxication is most likely
to influence behavior. IC is defined as the conflict that ensues between strong cues that instigate
behavior (e.g., a physical provocation) and strong cues that inhibit behavior (e.g., threat of jail).
alcohol reduces an individual’s ability to cognitively process cues of inhibition which, in turn,
allows behavior to be strongly influenced by cues of instigation (Steele & Southwick, 1985). As
[image:17.612.100.360.211.318.2]a result of this effect, aggression is more likely to occur.
Table 1.
Acute Alcohol Intoxication, Inhibition Conflict, and Aggression
Consider, for example, a situation in which an individual receives a rude comment from
another individual in a bar. However, the immediate environment also possesses numerous cues
that presumably inhibit aggression, such as a formidable provocateur or bouncer standing nearby.
If the individual who experienced the provocation is sober, he/she is likely to process both cues
of instigation (e.g., rude comment, personal insult) and cues of inhibition (e.g., threat of harm, a
bouncer standing nearby) relevant to the situation. On the other hand, if this individual were
intoxicated at the time of insult, alcohol’s narrowing effect on attention would focus the
individual’s attention on the salient cues of provocation and impede processing of cues of
inhibition (see Table 1). For these reasons, an individual is believed to be more likely to aggress
against the provocateur if intoxicated than if sober.
IC has been experimentally supported using the go-no-go stop paradigm in which the IC
of intoxicated participants can be observed. Though this paradigm was not specifically designed
to measure an effect of alcohol myopia, this protocol has been shown to represent a direct
measure of inhibitory control over “go” (i.e., instigation) responses and “stop” (i.e., inhibition) Instigatory Cues
Low High
Inhibitory Cues
Low
High Alcohol ↑
responses (Logan & Cowan, 1984). For example, Fillmore and Vogel-Sprott (1999) recruited
undergraduates to participate in this paradigm using a go-stop choice reaction time task.
Participants were asked to focus on a fixation point in the middle of a computer screen and were
instructed to respond to a letter that appeared upon its disappearance. On each trial, one of four
randomly selected letters appeared on the screen and participants were told to immediately press
the key on the keyboard that corresponded with the letter that appeared. This uninterrupted
protocol represented the “go” portion of the task.
In order to test for inhibitory control of this “go” response, 27% of the trials incorporated
a “stop” signal that was signified by a comfortable level tone emitted from the computer. Upon
hearing this tone, participants were instructed to withhold (i.e., inhibit) their responses to the
letter that appeared on the screen. Inhibitory control was operationalized as the number of times
inhibition occurred in response to the stop signal. Results indicated that intoxicated individuals
did not evidence significant impairment in response to “go” signals when compared to their
sober peers. However, intoxicated participants did evidence a significant increase in inhibition
errors when the “go” and “stop” signals were both present. Collectively, the results of this study
support the notion that “go” (i.e., instigation) and “stop” (i.e., inhibition) processes do function
independently from one another and that alcohol intoxication can impair processing of cues of
inhibition (Fillmore & Vogel-Sprott, 1999).
To better understand the IC model, Steele and Southwick (1985) conducted a
meta-analysis to examine the effect of IC across several different social behaviors. The meta-meta-analysis
reviewed 34 studies that each compared an alcohol group to a control group on a social behavior
that involved human interaction (e.g., aggression, self-disclosure) and/or a frequently occurring
and found that alcohol facilitated “go” related social behavior to a significantly higher degree
under high conflict situations (i.e., situations where competing pressures from both salient cues
of instigation and salient cues of inhibition were simultaneously presented) as compared to low
conflict situations (i.e., situations where competing pressures from both salient cues of
instigation and salient cues of inhibition were not simultaneously presented). Overall, conflict
level, alcohol dose, and their interaction accounted for 20% of the variance in alcohol’s effects in
these studies, with the high conflict, high alcohol dose groups contributing a disproportionate
amount to this effect (Steele & Southwick, 1985).
In a later review, Ito and colleagues (1996) conducted a meta-analysis that, in part,
examined the moderating role of IC specific to alcohol-related aggression. In total, 49 studies
were reviewed in the analysis, and each study compared an alcohol group to a non-alcohol group
(control, placebo, or no drink) on at least one measure of aggression. A primary finding of this
meta-analysis revealed that aggression evidenced by sober and intoxicated participants was in
fact moderated by IC. In other words, participants who received a high dose of alcohol and
faced a high conflict situation reported significantly more aggression then their sober peers.
In addition to physical aggression, IC has also been used to examine the role of alcohol
intoxication on other risky behaviors of concern. For example, IC has been tested in several
studies examining the role of alcohol in sexual aggression. To observe this effect, Murphy,
Monahan, & Miller (1998) assessed the effects of alcohol intoxication on women’s judgments of
potential dating partners. Men were described as either attractive or unattractive and as either
high risk (e.g., sexually promiscuous and suggested dates in isolated settings) or low risk (e.g.,
sexually conservative and suggested dates out in public). In accordance with AMT, researchers
inhibitory cues of danger and rely on their initial assessment of the man’s appearance. Results
supported this prediction and indicated that intoxicated women viewed a sexually attractive,
high-risk man to be less threatening than sober women. In support of the IC model, these
alcohol-related effects were not detected in situations involving an attractive, low risk partner or
an unattractive, high risk partner (i.e., low IC).
In a study by Testa, Livingston, & Collins (2000), women who consumed alcohol rated a
strange male character more positively, perceived greater positive outcomes for risky behaviors
with the male character, and reported a greater likelihood that they would engage in those
behaviors. These results suggest that intoxicated women were more focused on sustaining a
potential relationship with a man (i.e., cues of instigation) than of protecting their personal safety
against potential risk of assault (i.e., cues of inhibition). Furthermore, Davis, George, & Norris
(2004) examined the effect of alcohol on women’s behavioral responses to unwanted sexual
advances. In accordance with the IC model, results of the study indicated that intoxicated
women faced with the high-conflict scenario were more likely than sober women to consent to
sexual activity and respond passively to unwanted sexual advances.
Attention-Allocation. As posited by Steele and Josephs (1990), the attention-allocation
model (AAM) of AMT is a core component in the relation between alcohol and aggression.
Steele and Josephs (1990) put forth the AAM as the explanatory mechanism for why alcohol
may affect a person differently each time that person drinks alcohol. According to the AAM,
alcohol intoxication focuses attention onto whatever is most salient to a person in a given
situation. Because in most real-world situations cues that instigate behavior are more salient and
easier to process than cues that inhibit behavior, intoxication is likely to produce myopia toward
that inhibit behavior (e.g., negative consequences). To help illustrate this effect, the following
scenario will provide a concrete example of the AAM and its effects on intoxicated behavior.
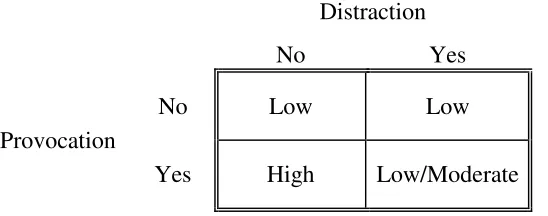
Imagine that John is in a bar with his girlfriend Amy. John has had several beers to drink
and is actively watching his favorite football team, Ohio State, beat Michigan State, on the bar’s
television. During the game, the man sitting behind John leans over and starts to flirt with Amy
and even places his hand on her shoulder. Though the behavior perturbs John, he does not seem
to focus on what this man is doing with his girlfriend because his attention is distracted by the
game. Alternatively, imagine the same sequence of events with the exception that the football
game was suddenly turned off. Since John’s attention is no longer focused on the game, he is
more likely to allocate his attention to the man flirting with his girlfriend and, as a result, he is
[image:21.612.97.371.432.540.2]more likely to respond with aggressive action (see Table 2).
Table 2.
The Interactive Effect of Provocation and Distraction on Likelihood of Aggressive Action
To examine the AAM, Steele and Josephs (1988) tested the effects of alcohol on
psychological stress. Participants were randomly assigned to one of four groups:
alcohol/distraction, alcohol/no-distraction, sober/distraction, or sober/no-distraction. It was
expected that the intoxicated participants who were not distracted would report an increase in
anxiety prior to giving a speech that detailed what they disliked about their physical appearance.
In contrast, it was expected that intoxicated participants whose attention was distracted away Distraction
No Yes
Provocation
No Low Low
from giving the impending speech would report less anxiety relative to all other groups. The
researchers found support for their hypotheses. The intoxicated/distracted participants reported
significantly less anxiety than any other group, while the intoxicated/no-distraction participants
reported the greatest amount of increase in anxiety relative to the other groups (Steele & Josephs,
1988). Thus, in this high conflict situation, distraction appeared to effectively manipulate
alcohol’s narrowing effect on attention.
These results were later replicated by Josephs and Steele (1990) who found that
intoxicated participants whose attention was moderately distracted reported a decrease in anxiety
relative to their intoxicated, non-distracted counterparts (who reported increases in anxiety).
Again, sober participants did not report any reduction in anxiety, regardless of whether or not
they were distracted. Additionally, this study examined a separate group of intoxicated
participants who were mildly distracted prior to the stressful speech. Results indicated that this
group did not report a reduction in anxiety (Josephs & Steele, 1990). These data support the
AAM and further suggest that the amount of distraction involved in attenuating myopia is
important to consider.
Zeichner, Allen, Petrie, Rasmussen, & Giancola (1993) tested the influence of alcohol
intoxication and information salience on attention allocation. Specifically, sober, placebo, and
intoxicated participants were asked to view positive, negative, and neutral traits that were said to
be either relevant or irrelevant to their own personality. All participants were allowed to freely
choose which type of word they wanted to view and were not given time restrictions on how
long they could view each word. In line with the AAM, it was hypothesized that intoxicated
participants who were in the personally relevant personality condition would allocate the greatest
cues would be most salient to them. Further, participants in the placebo and control conditions
were hypothesized to attend to personally salient information longer than personally nonsalient
information regardless of word type. Results confirmed these predictions. In accordance with
AMT, these findings suggest that intoxicated individuals allocate equal amounts of attentional
resources to both salient information and nonsalient information when faced with a situation in
which the threat value was low (i.e., positive information). In contrast, intoxicated individuals
were found to allocate more attentional resources to salient, relative to nonsalient, information
when faced with a situation in which the threat value was high (i.e., negative information).
In summary, acute alcohol intoxication directs attention to the most salient information of
a situation (Zeichner, Allen, Petrie, Rasmussen, & Giancola, 1993), this effect can be reduced by
distracting attention away from this information (Steele & Josephs, 1988; Josephs & Steele,
1990), and the distraction must be at least moderate in size in order to obtain this effect (Josephs
& Steele, 1990). Though these studies advanced scientific understanding of the cognitive effects
of acute alcohol intoxication, experimental research was needed to apply this model to actual
aggressive behavior. To this end, Zeichner, Allen, Giancola, and Lating (1994) tested the
moderating effect of threatening cues on alcohol-related aggression using a laboratory-based
aggression paradigm. During the task, participants were led to believe that another subject (a
confederate) would provide them with words (that were either negative or positive in nature) that
were said to describe their personality based on previously collected data. Participants were told
that it was their job to positively shape the confederate’s impression of them by administering an
electric shock ranging from 1 to 5, with 1 representing the least amount of shock and 5
representing the greatest amount of shock. In this study, shock intensity represented the
It was hypothesized that intoxicated participants who were faced with threatening
personal (i.e., salient negative) information would display more aggression against the
confederate (i.e., higher shocks) compared to the group of intoxicated participants who were
faced with nonthreatening personal (i.e., nonsalient positive) information. Overall, results
supported this hypothesis. Specifically, it was found that intoxicated participants responded
more aggressively when faced with salient negative information than when faced with nonsalient
positive information. Conversely, sober participants did not evidence a differential response to
the two types of personal information and responded with significantly less aggression than the
intoxicated participants.
Although this study provided much needed data that linked the cognitive impact of
alcohol intoxication on actual physical aggression, it did not specifically test whether this effect
could be mitigated by cognitive distraction. To address this gap, Giancola and Corman (2007)
conducted a two-part study in which they systematically evaluated the effect of cognitive
distraction on intoxicated aggression. In the first study, participants were administered alcohol,
presented with a moderate-load cognitive distracter, and participated in a modified version of the
Taylor Aggression Paradigm (Giancola & Zeichner, 1995a). Aggression was operationalized as
the summation of the intensity and duration of shock a participant administered to a fictitious
opponent. In accordance with the AAM, researchers hypothesized that intoxicated participants
who received the moderate-load cognitive distracter would display less aggression relative to
intoxicated participants who did not receive the distracter or sober participants regardless of their
distraction condition. In this way, the AAM was used to predict a situation in which alcohol
would supposedly decrease aggression as opposed to increase aggression. As expected, the
individuals. In fact, intoxicated, distracted participants evidenced less aggression than the
non-distracted participants who received a placebo beverage. In accordance with prior research
(Steele & Josephs, 1988; Josephs & Steele, 1990), this finding suggests that distraction can drive
attention away from salient/provoking stimuli and, consequently, decrease aggressive behavior.
The second part of the study attempted to assess the effects of different levels of
cognitive load on intoxicated aggression. Consistent with prior research (Joseph & Steele,
1990), it was predicted that a moderate cognitive load would be the most effective level of
distraction for allocating attention away from provocative/salient cues. To test this effect,
intoxicated and placebo participants were randomly assigned to one of five working memory
groups. The level of distraction ranged from no distraction to having to remember and respond
to 8 sequences of a memory task. Consistent with Josephs and Steele (1990), results indicated
that distraction was an important factor in the suppression of aggression. Specifically, the
moderate distracter (i.e., holding four sequences in working memory) proved to be optimal for
reducing intoxicated aggression. In addition, participants who received no distraction and
participants who received the highest level of distraction (i.e., holding eight sequences in
working memory) displayed the most aggression of all groups. This result is consistent with
Josephs and Steele (1990), who proposed that high-level distracters may elicit frustration and
engender aggression. Alternatively, Giancola & Corman (2007) also acknowledged the
possibility that highly distracted participants may have given up on the working memory task
and reallocated attention to the aggression task. It was also clear from the results that low-level
distraction may not be strong enough to relocate attention away from provocation.
Furthermore, Giancola and Corman (2007) also examined participants’ reaction times on
assigned to the distraction group evidenced significantly slower reaction times than participants
assigned to the no distraction group. Moreover, results of the second study indicated that all
distracted participants evidenced significantly slower reaction times compared to participants in
the no distraction group, though low, moderate, and highly distracted participants did not
significantly differ from each other on reaction time (Giancola & Corman, 2007). This main
effect provides evidence that distracters constituted a so-called “cognitive load” that may have
contributed to participants’ allocation of attention away from the reaction time task (and the
adversarial interaction). However, although all distracters tax attentional resources, it appears
that the use of a moderate distracter most effectively attenuates alcohol-related aggression by
allocating attention away from provocation.
Though this study established that the AAM can be offered as an explanation for
intoxicated aggression, the specific attentional processes that underlie this effect have yet to be
examined. Thus, it remains unclear whether intoxicated participants’ attention is undoubtedly
drawn to aggression stimuli under provocative situations. In addition, it is not known whether
this effect can be impacted by the disruption of working memory (i.e., attention-allocation).
Accordingly, future research is needed to examine further the cognitive underpinnings of this
effect.
Attentional Bias and Aggression
Dot Probe Task and Attention-Allocation. The idea that attention is shifted to
mood-congruent stimuli has been a long standing concept in cognitive psychology. Numerous studies
have found evidence to suggest a mood-congruent attentional bias to a number of stimuli, such as
alcohol and drug cues, affect-related cues (e.g., threatening or sad faces), and aggression-related
Jongen, Smulders, Ranson, Arts, & Krabbendam, 2007; MacLeod, Mathews, & Tata, 1986;
Smith & Waterman, 2003; Smith & Waterman, 2004; Townshend & Duka, 2001). This bias in
attention is typically measured by assessing an individual’s reaction times to semantic or
pictorial stimuli presented on a computer screen, with the dependent variable representing
reaction times to the stimuli of interest. Though there are numerous methods of testing this
effect, the dot probe task has proven to be an effective tool in the study of attention allocation to
perceptually salient stimuli (reviewed in Mogg & Bradley, 1998; Mogg & Bradley, 1999;
MacLeod, Mathews, & Tata, 1986).
The dot probe task (DPT), developed by MacLeod, Mathews, and Tata (1986), is a direct
visual test of attention allocation. This task was developed, in part, to accommodate for the
interpretative difficulties and unexpected findings that have surrounded the Stroop task in past
years (Mogg & Bradley, 1998). In a typical version of the task with semantic stimuli, a fixation
marker (e.g., an “X”) is presented on a computer screen for a set period of time and is followed
by two words, one above the other. On critical trials, one word represents the stimulus of interest
(e.g., fear) and is paired with a matched neutral word (e.g., fork). Immediately following the
disappearance of each word pair, a small dot randomly appears in the location of one of the
words. Participants are typically instructed to press the button that corresponds to the dot
location as quickly as possible. Attention allocation to the stimulus word is measured by the
reaction time to the dot, with faster reaction times occurring when the dot replaces the stimulus
word and slower reaction times occurring when the dot replaces the neutral word. This effect
presumably reflects an attentional shift to the stimulus theme of interest (Mogg & Bradley,
1998). In recent years, the DPT has been modified to simplify task requirements (e.g., use of
populations that are more difficult to test (e.g., children, intoxicated individuals) (reviewed in
Mogg & Bradley, 1999)
Previous work with the DPT and its various modifications (reviewed in MacLeod, Soong,
Rutherford, & Campbell, 2007; Mogg & Bradley, 1999) has provided evidence to suggest that it
is a reliable measure of attentional biases between clinical verses non-clinical samples (e.g.,
MacLeod et al., 1986), as well as experimentally primed versus control samples (reviewed in
Matthews & MacLeod, 2002; Fox & Knight, 2005). However, past research has also found that
the DPT is not a reliable measure of attentional biases of unprimed non-clinical samples
(Schmukle, 2005). From these data, it is clear that non-clinical samples must undergo
experimental state activation (i.e., priming) in order to evidence significant attention allocation
biases. In social psychological research, priming is often used to induce an automatic influence
on cognitions and behaviors (Todorov & Bargh, 2002). For example, in a typical priming
experiment, participants are exposed to stimuli (e.g., written insult) that are associated with the
construct under investigation (e.g., aggression) and subsequently tested in an experiment that
examines the role of the priming stimuli on the outcome variable of interest. Accordingly, this
technique is clearly a critical part of the methodology of dot probe studies when clinical samples
are not used.
Attention-Allocation and Aggression. Historically, the DPT and other cognitive tests of
attention have measured biases related to emotional disorders (e.g., threat bias in trait anxiety)
(reviewed in Mogg & Bradley, 1998). However, these tests have recently been utilized in
aggression research as well (Cohen, Eckhardt, & Schagat, 1998; Eckhardt & Cohen, 1997; Smith
& Waterman, 2003; Smith & Waterman, 2004). Eckhardt and Cohen (1997) proposed that
diagnostic criteria for “anger” disorders and difficulty selecting participants who meet criteria for
this uncertain diagnosis. However, Smith and Waterman (2003) contended that anger is a
ubiquitous emotion that can be studied in both clinical and non-clinical samples. Smith and
Waterman (2003) further noted that it is necessary to make a clear distinction between the
“normal” control population and participants in the “normal” control population who report
significant anger difficulties (i.e., trait anger). Accordingly, recent research has begun to
examine the role of trait anger in attentional processes to anger information.
For instance, Eckhardt and Cohen (1997) used a modified emotional Stroop task to assess
the effect of a naturalistic insult on attentional biases among low and high trait anger individuals.
To activate state anger, participants were insulted by a confederate who impeded their pathway
while walking to the experimental room by pushing a filing cabinet drawer into their way. Upon
participants’ second attempt to pass by, the confederate slammed the drawer back into the filing
cabinet and shouted an insult at the participant as they left. Following the insult, participants
then completed the modified emotional Stroop task in which they were presented with a target
color prior to each trial and asked to indicate whether the presented word (i.e., anger word,
positive emotion word, or neutral word) was the same color as the target color. As expected,
insulted participants high in trait anger took longer to respond to the color of anger words as
compared to positive emotional and neutral words. In contrast, non-insulted high trait anger
participants and all low trait anger participants did not evidence this effect. Using similar
methodology, this effect was replicated in a separate investigation using a visual search task
(Cohen, Eckhardt, & Schagat, 1998).
Smith and Waterman (2003) tested violent offenders, nonviolent offenders, and
and an emotional Stroop task. Though it was expected that the violent offenders would display a
perceptual bias toward the aggression words, high trait aggressive undergraduates were also
expected to display a similar attentional bias to aggression words. Results confirmed these
predictions. Compared to the non-aggressive undergraduates and nonviolent offenders, both
aggressive groups displayed significant attentional biases toward the aggression, as opposed to
the neutral, words on the DPT. Likewise, compared to the low trait aggressive undergraduates
and nonviolent offenders, both aggressive groups displayed significant attentional biases toward
the aggressive and negative emotional words, as compared to the positive emotional and neutral
words, on the emotional Stroop task.
Later, Smith and Waterman (2004) replicated this effect when they again compared the
attentional biases of violent offenders, nonviolent offenders, and undergraduates. However, in
this study participants engaged in a themed DPT as well as a visual search task. In the themed
DPT, researchers created state activation by priming participants with a series of written
vignettes that were either aggressive or neutral in theme. Participants then engaged in a DPT in
which they responded to words (either aggression or neutral) that had previously appeared in the
text. Researchers posited that aggression-prone participants’ attention would be drawn to the
aggression words in spite of the fact that the neutral words were also familiar to the participants.
Results supported an attentional bias toward aggression words for violent offenders and high trait
aggressive undergraduates as compared to nonviolent offenders and low trait aggressive
undergraduates.
Overview of the Proposed Study and Hypotheses
The preceding review has established that AMT is a well-established cognitive theory to
anxiety/stress). Despite the attention this theory has received, a paucity of research has been
conducted to examine directly this theory in relation to alcohol-related aggression. In addition,
no known study to date has directly examined the specific cognitive underpinnings of the
attentional processes that are presumed to underlie this effect.
As established, the AAM of AMT asserts that intoxication facilitates the focus of
attention onto the most salient, provocative cues of a situation, and consequently diminishes the
impact of less salient inhibitory cues that signal the regulation of risky behavior (Steele &
Josephs, 1988; Steele & Josephs, 1990). Previous research has suggested that, in high conflict
situations, an intoxicated individual may become more aggressive due to the myopia that ensues
as a result of acute alcohol intoxication (Steele & Josephs, 1990; Taylor & Leonard, 1983;
Zeichner & Phil, 1979). This hypothesis has been supported by several studies that have
established that acute alcohol intoxication directs attention to the most salient information of a
situation (Zeichner, Allen, Petrie, Rasmussen, & Giancola, 1993), that this effect has direct
implications for physical aggression (Zeichner, Allen, Giancola, & Lating, 1994), that distraction
can drive attention away from this information (Steele & Josephs, 1988; Josephs & Steele,
1990), and that using a moderate level distracter is effective in attenuating aggression (Giancola
& Corman, 2007; Josephs & Steele, 1990). Although this research has supported AMT and
greatly contributed to the understanding of alcohol-related aggression, no-known study to date
has overtly measured the cognitive underpinnings of the AAM.
As such, the purpose of the present study was threefold. The first goal (1) was to
examine the effects of alcohol and distraction on attention to anger/aggression-related stimuli
among provoked individuals using a visual probe task (VPT). Past literature has confirmed that
1986; MacLeod, Soong, Rutherford, & Campbell, 2007; Mogg & Bradley, 1998, 1999). In
addition, pertinent research has confirmed the reliability of this task (Fox & Knight, 2005;
MacLeod et al., 1986; Mathews & MacLeod, 2002). The second goal (2) was to test
behaviorally the effects of alcohol and distraction on aggression among provoked individuals
using a version of the Taylor Aggression Paradigm (TAP) (Giancola & Zeichner, 1995a).
Pertinent literature has established that the TAP is a direct measure of physical aggression
(Giancola & Parrott, 2008). This part of the study was intended to replicate and extend past
research that has found a similar effect (Giancola & Corman, 2007). The third goal (3) was to
examine whether biases in attention allocation to anger/aggression-related stimuli on the VPT
were associated with concomitant increases in aggression. Indeed, alcohol should bias attention
toward anger/aggression-related stimuli to the greatest extent among provoked, non-distracted
individuals relative to provoked, distracted individuals. These biases were expected to
correspond directly to subsequent aggressive behavior.
Participants were randomly assigned to one of two beverage conditions (i.e., alcohol,
no-alcohol control) and one of two distraction conditions (i.e., moderate distraction, no-distraction).
In addition, all participants were provoked via reception of electric shocks and a verbal insult
from a fictitious male opponent. In accordance with the reviewed literature, the overarching
hypothesis of this study contended that, relative to all other groups, the intoxicated, distracted
participants would display the lowest levels of aggressive behavior and that this effect would be
mediated by attentional bias to anger/aggression words. This association was not expected to
emerge for any other experimental group. As put forth by Muller, Judd, and Yzerbyt (2005)
Hypothesis 1. Distraction condition was expected to moderate the relation between
alcohol consumption and aggressive behavior. Specifically, participants in the intoxicated,
distracted group were expected to display the lowest levels of aggression relative to participants
in the intoxicated, non-distracted group or participants in the no-alcohol control groups.
Hypothesis 2. Distraction condition was expected to moderate the relation between
alcohol consumption and attentional bias toward anger/aggression words, relative to neutral
words. Specifically, participants in the intoxicated, distracted group were expected to display the
lowest attentional bias for anger/aggression words relative to participants in the intoxicated,
non-distracted group or participants in the no-alcohol control groups.
Hypothesis 3. Among participants in the intoxicated, non-distracted group, attentional
bias toward anger/aggression words was expected to predict higher levels of subsequent
METHOD
Recruitment Procedures and Eligibility Criteria
Prior to data collection, this study was approved by the university’s Institutional Review
Board. Participants were recruited from the local metro-Atlanta community and responded to an
advertisement stating “Researchers at Georgia State University seeking males age 21-35 for
study of alcohol’s effect on behavior. Earn between $30 and $100. Please call 404-413-6199 for
more information.” This advertisement was posted on internet resources (e.g., job classifieds)
and was placed in local-area newspapers. Participants contacted the laboratory by telephone and
completed a telephone screening interview with laboratory staff to determine eligibility for
participation. In order to be eligible, participants had to report that they (1) were regular social
drinkers (defined as consuming an average of two or more standard alcohol drinks per occasion,
an average of twice per month or more, for the past year) (National Institute on Alcohol Abuse
and Alcoholism, 2003), (2) were not problem drinkers as defined by a score of 6 or higher on the
Brief Michigan Alcoholism Screening Test (B-MAST; Pokorny et al., 1972), (3) did not have a
current or a lifetime DSM-IV diagnosis of any substance use disorder (other than caffeine or
nicotine), (4) had never sustained a traumatic brain injury that required medical attention, (5) had
never been diagnosed with a psychiatric disorder (e.g., psychotic disorder, major depression), (6)
did not currently have a significant medical health problem, (7) were not currently taking any
medication that might contraindicate the use of alcohol, (8) were native English speakers, and (9)
did not know anyone who has participated in the study before. In addition, in order to ensure
tolerance for our dose of alcohol (.99 g/kg of 95% alcohol) without any danger of adverse effects
or excessively high blood alcohol concentrations, all participants were required to be less than
Upon completion of the telephone interview, participants were contacted within 1-2
business days regarding their eligibility. Participants who did not meet criteria for eligibility
were notified and thanked for their time. Eligible participants were (1) read a standardized
description of the protocol, (2) told that they may or may not receive alcohol during the
experiment, and (3) scheduled for an experimental appointment. To ensure that the experimental
methodology was not compromised, the true nature of the study was not divulged to participants
at this time. Indeed, informing subjects of the true nature of the study could have elicited
artificial, socially desirable (e.g., non-aggressive) responses. Rather, participants were told that
they would partake in both a visual speed task (i.e., VPT) and a competitive reaction time task
(i.e., TAP) to assess alcohol’s effects on motor attention.
Participants and Experimental Design
Participants were 276 men between the ages of 21-35 who presented to the laboratory for
an experimental appointment. Of these men, 76 were deemed ineligible based on pre-determined
screening criteria (described above).
The remaining 200 participants were randomly assigned to one of four experimental
groups: alcohol-distraction, alcohol-no-distraction, sober-distraction, and sober-no-distraction.
Because past research suggests that the effects of alcohol expectancy on aggression are
negligible (e.g., Bushman & Cooper, 1990; Hull & Bond, 1986; Steele & Southwick, 1985), such
influences were not expected to impact aggression in the proposed study. Moreover, placebo
groups are not ecologically valid; placebo beverages are not consumed in most “real world”
settings. As such, a no-alcohol control group, rather than a placebo group, was utilized. Overall,
continuous predictor variable (attentional bias scores), and one nuisance variable (probe
location).
Materials
Questionnaires. Participants completed eligibility screening measures on paper that
included a Medical History Questionnaire that assessed medical conditions that might
contraindicate safe consumption of alcohol; the Symptoms Checklist-09-Revised (SCL-90-R;
Deragotis, 1983) which assessed psychiatric symptomatology; and the Brief Michigan
Alcoholism Screening Test (B-MAST; Pokorny, Miller, & Kaplan, 1972) which assessed
symptoms of problem drinking. In addition, participants were administered the following
questionnaires on a computer via MediaLab 2000 (Empirisoft Research Software, Philadelphia,
PA): (1) a Demographic Form assessed age, ethnic background, race, highest level of education,
and income level; (2) a Drinking Patterns Questionnaire, which was derived from the National
Institute on Alcohol Abuse and Alcoholism’s (NIAAA, 2003) recommended set of six alcohol
consumption questions. Of interest to the present study, frequency of alcohol consumption was
assessed with the question, “During the last 12 months, how often did you usually have any kind
of drink containing alcohol?” A categorical response ranging from “everyday” to “I never drank
alcohol in my whole life” was provided. In addition, average quantity of alcohol consumption
during the past year was assessed with the question, “During the last 12 months, how many
alcoholic drinks did you have on a typical day when you drank alcohol?” A categorical range of
responses from “1 drink” to “25 or more drinks” was provided. In accordance with the
guidelines put forth by NIAAA, total scores were obtained by computing the average number of
drinks in each range. This strategy reliably assesses an individual’s average quantity of alcohol
1995); and (3) the Aggression Questionnaire (AQ; Buss & Perry, 1992), which measured trait
physical aggression. The AQ is a 29-item, Likert type measure comprised of four subscales
(physical aggression, verbal aggression, anger, and hostility). In the present study, only the
Physical Aggression subscale was analyzed to identify group differences that could potentially
confound laboratory-based physical aggression. Participants rate how each item describes them
on a scale of 1 (extremely uncharacteristic of me) to 5 (extremely characteristic of me). The AQ
has been shown to have high validity and reliability (α = .80). A Cronbach alpha coefficient of
.78 was obtained for the Physical Aggression subscale in the present sample.
Attentional bias. A modified dot probe task, referred to herein as a visual probe task
(VPT), was used to assess attentional bias to anger/aggression relative to neutral themed words.
Previous work with this task and its various modifications (reviewed in MacLeod, Soong,
Rutherford, & Campbell, 2007; Mogg & Bradley, 1999) has provided evidence to suggest that it
is a reliable measure of attentional biases between clinical verses non-clinical samples (e.g.,
MacLeod et al., 1986), as well as experimentally primed versus control samples (reviewed in
Matthews & MacLeod, 2002; Fox & Knight, 2005).
During the VPT, participants were seated facing a computer monitor and keyboard.
Participants were instructed to “hover” the index finger of their dominant hand over the down
arrow key in a “ready” position throughout the task. To ensure participants only used their index
finger during the task, a rubber band was placed around participants’ remaining fingers. After
reading a set of directions and indicating that they were ready to begin, a fixation “x” was
presented on the computer screen for 500 ms. Two words then appeared on the screen, one
above the other. After 500 ms, the words disappeared and either a left-facing arrow or
the left arrow key on the keyboard if a left-facing arrow replaced the word or to press the right
arrow on the keyboard if a right-facing arrow replaced the word. Participants were directed to
respond as quickly and as accurately as possible. Prior to completing the critical trials of the
task, participants were given 20 practice trials with neutral word pairings to account for
decreases in response latencies during initial trials (Forbach, Stanners, & Hochhaus, 1974).
There were a total of 116 trials. These trials consisted of 52 aggression-neutral word
pairings and 24 anger-neutral word pairings for a total of 76 anger/aggression-neutral word
pairings. In addition to this, there were 40 neutral-neutral word pairings to mask the theme of
the study. The task was configured to ensure that the probes appeared an equal number of times
in both the upper and lower word locations and replaced the type of word (i.e., stimulus or
neutral) an equal number of times. In addition, the direction of the arrow (i.e., left-facing,
right-facing) appeared an equal total number of times and appeared equally within each condition (for
more detail, see Appendix 1).
Pilot testing of stimulus words was conducted to select words that most accurately
reflected the definitions of anger and aggression. Anger was defined as “An emotional state that
can vary in intensity, from mild annoyance to rage. The experience of anger lacks a specific
goal.” Aggression was defined as “A behavioral process that includes the goal of inflicting harm
to another living being (i.e., not to an inanimate object) who is motivated to avoid the act.”
These definitions have been shown to accurately reflect the two constructs (Parrott & Giancola,
2007). Seventy nine words consistent with these definitions were obtained from three sources
that have previously aggregated emotionally salient words from the English language (Bradley &
Lang, 1999; Clore et al., 1987; Smith & Waterman, 2003). Each word was rated on a 5-point
students who were unaware of the study’s hypotheses. From these words, 76 words were
selected for use in the present study (see Appendix 2) based on the extent to which each
represented an “anger” or “aggression” word (i.e., the word obtained a score below 3 or above 3
in either respective condition). Each neutral word was matched to each anger/aggression word in
terms of word frequency (Kucera & Francis, 1967) and first letter. In addition, each neutral
word was matched to each anger/aggression word in terms of syllabic length in order to ensure
that word length did not confound the results. Moreover, past research has shown that latency
decreases and accuracy increases when words are repeated within the same task (Grant & Logan,
1993). Thus, each word pairing was only presented once during the task.
Physical aggression. A modified version (Giancola & Zeichner, 1995a) of theTaylor
Aggression Paradigm(TAP;Taylor, 1967) was used to assess direct physical aggression.
Participants competed in a reaction time task where electrical shocks were administered to and
received from a “fictitious” opponent (for more information, see “Deception Manipulation”
below). Participants were seated at a table in a small room. On the table facing participants was
a computer screen and keyboard. The numbers “1” through “10” on the computer keyboard were
labeled from “low” to “high” to allow participants to determine varying levels of shock to
administer. Participants received visual feedback on the computer monitor indicating whether
they “won” or “lost” the trial as well as the shock level selected and received. A Precision
Regulated Animal Shocker (Coulbourn, Allentown, PA) was used to generate the shocks. The
computer software that controlled the task was developed by Vibranz Creative Group
(Lexington, KY). Physical aggression was defined as the summation of standardized scores for
shock-based laboratory paradigms have been repeatedly shown to be safe and valid measures of
aggressive behavior (e.g., Anderson & Bushman, 1997; Giancola & Parrott, 2008).
Distraction task. While engaged in the VPT and TAP, participants in the distraction
condition also attended to a computerized memory sequencing task on a laptop computer located
to the left of their desktop computer. In this task, a 3 x 3 matrix of 2-cm light-gray squares were
presented on a white computer screen. On each trial, four squares illuminated (in black) in a
random sequencing order. Participants were asked to attend to, memorize, and click (using the
laptop keypad) the sequencing order of each trail. The trials proceeded continuously regardless
of whether the participant responded to the sequence and, in order to prevent confounding
emotional responses, performance feedback was not provided. During the VPT, the computer
program instructed participants to stop the task at intermittent intervals so that they could attend
to trials of the distraction task; no-distraction condition participants were instructed to stare at a
blank screen during the intermittent breaks. After a pre-determined period of time, the
experimenter instructed participants (via the intercom) to press the spacebar to resume the task.
During the TAP, the program did not stop to allow participants to attend solely to the distraction
task at intermittent intervals; rather, it was left up to individual participants to decide how they
wished to allocate their time between the two tasks. In order to ensure participants actively
engaged in the task, distraction condition participants were told that they would receive an
additional $30 if they performed better than 80% of subjects who have already been tested. In
reality, all subjects were paid the same amount of money. Previous research using similar
methodology has confirmed the reliability of this task as a moderate-level distracter (Giancola &
Corman, 2007).
To disguise the true aims of the study, participants were told that the purpose of the study
was to examine alcohol’s effects on motor attention using both a visual speed task (i.e., VPT)
and a competitive reaction time task (i.e., TAP). In order to convince participants that they were
competing against another person, participants completed a demographic interview in which they
answered several basic questions about themselves (e.g., first name, favorite food). This
interview was ostensibly videotaped by the experimenter and participants were told that the
purpose of the videotape was to give their opponent a better idea of who they were competing
against. Likewise, participants were told that they would also be able to view their opponent’s
answers as well. In actuality, participants viewed a pre-recorded tape of a male opponent (a
confederate) of the same race.
Additionally, participants were informed that they would undergo a pain threshold
assessment prior to the reaction time task. To facilitate deception, participants heard their
“opponent’s” pre-recorded pain threshold assessment responses over the intercom system before
they completed their pain threshold assessment. Presentation of the demographic interview tape
as well as the male’s voice during the pain threshold assessment maximized the likelihood that
participants were convinced they were competing against another person in the study. Indeed,
much research has confirmed the success of this manipulation (e.g., Parrott & Zeichner, 2005;
Parrott & Giancola, 2004).
Beverage Administration
Participants were randomly assigned to consume an alcoholic or non-alcoholic beverage.
Participants in the Alcohol group were administered two drinks consisting of an overall dose of
0.99 g/kg body weight of 95% ethanol USP mixed in a 1:5 ratio with Tropicana orange juice.
beverage was poured into two glasses in equal quantities. This single alcohol dose has been used
in past studies of alcohol-related aggression and has reliably produced breath alcohol levels
between .08%-.12%, which is within NIAAA safety guidelines for the social drinkers under
investigation. Because this dose has been shown to consistently potentiate aggressive behavior
(e.g., Giancola, et al., 2002; Giancola & Zeichner, 1997; Parrott & Zeichner, 2002), it was
chosen because it maximized the likelihood of producing an alcohol-facilitated effect on physical
aggression. In addition, this dose provided intoxication levels sufficient for measuring
attentional biases toward anger/aggression words in participants. Participants in the No-Alcohol
control group received an isovolemic beverage consisting of orange juice only.
All beverages were served chilled with no ice. Twenty minutes was allotted for beverage
consumption. Participants were given their two glasses at equally-spaced time intervals (i.e., 10
minutes) during the twenty minute interval to control for rate of drinking. Immediately
following beverage consumption, all participants rinsed their mouths with water. Breath Alcohol
Concentrations (BrAC) for participants in the Alcohol group were assessed with the Alco-Sensor
IV breath analyzer (Intoximeters, Inc., St. Louis, MO) every five minutes after finishing their
beverages. The practice trials of the TAP (for a detailed description, see “Provocation” below)
commenced after participants reached .08% on the ascending limb of the BAC curve, where the
stimulating effects of alcohol are most likely to be produced (Addicott et al., 2007; Giancola &
Zeichner, 1997; Martin et al., 1993).
Provocation
Pertinent literature suggests that response biases to cognitive tasks can only be effectively
measured in clinical samples or in state-activated subjects (MacLeod, Mathews, & Tata, 1986;
opponent in order to elicit anger and make provoking interpersonal cues extremely salient. To
accomplish this, participants engaged in “practice” trials of the TAP with the fictitious opponent
prior to the VPT. The practice trials were rigged such that the participant “lost” a
disproportionate number of trials (i.e., 4 out of 6). In addition, the “opponent” delivered the
highest possible shock intensity (i.e., 10’s) to the participant on each of these four trials. At the
end of these practice trials, participants were allowed to give their opponent verbal feedback
regarding their performance. In particular, participants and their opponent were told that the
feedback they provide to their opponent should represent constructive criticism that would not
derogate their competitor. After providing feedback to their opponent, participants received the
following feedback from their opponent: “Well, he was really slow, I mean mentally slow. This
guy must be a real idiot or something. I mean, I messed up on some of those trials and still won!
Now that I've got the hang of it, I think I can pretty much beat him every time, which will be
great because I want to keeping nailing him with tens!” This message was pre-recorded by a
confederate (matched to race) and was played through a closed-circuit intercom system.
Procedure
Upon arrival to the laboratory, participants were greeted by an experimenter and led to a
private room. At this time, participants were asked to present a picture ID and informed consent
was obtained. Participants’ breath alcohol concentration (BrAC) and weight were assessed to
confirm sobriety and weight eligibility requirements. Participants with a BrAC above .00% were
prohibited from completing the study on that day and asked to reschedule. Participants whose
weight exceeded eligibility requirements were not permitted to complete the experimental