Geosciences Dissertations Department of Geosciences
Summer 8-1-2013
Shoreline Dynamics and Environmental Change Under the Modern
Shoreline Dynamics and Environmental Change Under the Modern
Marine Transgression: St. Catherines Island, Georgia
Marine Transgression: St. Catherines Island, Georgia
Brian K. Meyer
Georgia State University
Follow this and additional works at: https://scholarworks.gsu.edu/geosciences_diss
Recommended Citation Recommended Citation
Meyer, Brian K., "Shoreline Dynamics and Environmental Change Under the Modern Marine Transgression: St. Catherines Island, Georgia." Dissertation, Georgia State University, 2013.
https://scholarworks.gsu.edu/geosciences_diss/5
This Dissertation is brought to you for free and open access by the Department of Geosciences at ScholarWorks @ Georgia State University. It has been accepted for inclusion in Geosciences Dissertations by an authorized
MARINE TRANSGRESSION: ST. CATHERINES ISLAND, GEORGIA
by
BRIAN K. MEYER
Under the Direction of Daniel M. Deocampo
ABSTRACT
The current study has evaluated shoreline dynamics and environmental change at St. Catherines
Island, Georgia, with attention to the two major controls of barrier island formation and
modification processes. These major controls include the increase in accommodation space, or
the rate of sea level rise for the Georgia Bight which has remained constant in 20th and 21st
century tide gauge data and dynamically changing rates of sediment supply based on
anthropogenic modifications to land cover (Trimble, 1974) that are reflected in sediment
transport (McCarney-Castle et al., 2010). Vibracoring and radiocarbon data provided valuable
insights into the stratigraphy and development of St. Catherines Island. A stratigraphic model
has been developed for the sediments associated with the Late Holocene accretional terrains
where multiple small scale fluctuations in sea level have resulted in the formation of a
sedimentary veneer punctuated with transgressive surfaces and regressive sequences. A
working model for an interpolated Late Holocene sea level curve has been constructed using
direct evidence from vibracore data as constraining points and indirect evidence from other
regional sea level studies to provide additional structure. The relationship between the timing of
the regressions versus periods of beach ridge formation and implications from the current
sea level based on the sedimentary record and an evaluation of Late Holocene sea level
conditions. The evaluation of anthropogenic modifications to the rate of sediment supply
performed under the current study indicates that in spite of significant changes in sediment flux
rates of +300% (pre-dam era) and -20% (post-dam era), shoreline retreat was continuous during
the study period with an acceleration noted in the rates of shoreline retreat associated with spit
and berm landforms during the post-dam or modern era. The two associations indicate strongly
that the rate of sediment supply plays a secondary role to the major control of the rate of sea
level rise in the formation and modification processes at St. Catherines Island.
INDEX WORDS: Shoreline dynamics, Barrier island, Late Holocene, Stratigraphy
MARINE TRANSGRESSION: ST. CATHERINES ISLAND, GEORGIA
by
BRIAN K. MEYER
A Dissertation Submitted in Partial Fulfillment of the Requirements for the Degree of
Doctor of Philosophy
in the College of Arts and Sciences
Georgia State University
Copyright by Brian Kevin Meyer
MARINE TRANSGRESSION: ST. CATHERINES ISLAND, GEORGIA
by
BRIAN K. MEYER
Committee Chair: Daniel M. Deocampo
Committee: Gale A. Bishop Dajun Dai Lawrence M. Kiage Robert Kelly Vance
Electronic Version Approved:
I would like to acknowledge and extend my gratitude to the entire Department of
Geosciences at Georgia State University for the opportunities and support that everyone has
provided. Thank you to all my committee members for balancing their multiple commitments
and helping make the research sound and improving the quality of the dissertation: Drs. Gale
Bishop, Dajun Dai, Daniel Deocampo, Larry Kiage, and Kelly Vance.
I would like to directly thank the St. Catherines Island Scientific Research Committee for
their financial and logistical support and the opportunity to perform research on one of the most
unique places on our planet. Thanks are especially extended to Royce Hayes for his support as
superintendent of the island and incredible knowledge of the setting. I’m extremely grateful for
the support during the field work portion of the project, especially the staff of St. Catherines
Island (Richard Bew, Spyder Crews, Alan Dean, Mike Halderson, Capt. Lee Thompson and Jeff
Woods) and my fellow vibracoring enthusiast Kelly Vance who was there for practically every
core collected during the project under incredible weather extremes. I would be remiss to not
also recognize Andreas Shoredits for his vibracoring support and being a great sounding board,
and Sam Kennedy for his vibracoring support, fellowship and incredible ability to repair
mechanical devices with minimal tools and resources. The vibracoring team that supported me
also included Brock Nelson, Mehmet Samiratedu, Fred Rich, Jim Reichard, Carolyn Smith,
Brent Leggett, Semir Sarajlic, Shawn Huckins and Amber Skiles.
I’m appreciative for the collaboration that I have enjoyed with David Hurst Thomas and
the entire staff from the American Museum of Natural History over the years, especially Elliot
Blair, Rachel Cajigas, Ginessa Maher, Matt Napolitano, Lorrie Pendleton, Matt Sanger and Anna
Semon. And I’ve also enjoyed the I look forward to more stimulating conversations at Bradford
joined this journey. But there would have never been a journey without the support and
encouragement of my wife Jennifer, who is my companion in life and my favorite companion in
the field. Our entire family is indebted for the opportunities offered to the citizens of our State
by the University System of Georgia and I will always be grateful to all of my science teachers
but especially Gale Bishop who has been a teacher, a colleague and a friend through the years.
Gale took a chance on me as a field geologist allowing me to grow as a geologist in the Black
Hills of South Dakota. Gale also initiated my interest in the modern depositional environments
of barrier island systems via direct immersion in the Marshes of Glynn just a “few” short years
ago. It’s ironic that after a lot of travels, opportunities and professional endeavors that I came
right back to where it all started, albeit this time in the Marshes of Liberty.
Thanks to all,
Brian K. Meyer Cabin 1 (Button)
ACKNOWLEDGEMENTS ... iv
LIST OF TABLES ... xi
LIST OF FIGURES ...xii
1 INTRODUCTION ... 1
1.1 Research Objective ...3
2 STUDY AREA PHYSICAL SETTING ... 6
3 BARRIER ISLAND SYSTEMS AND DEPOSITIONAL ENVIRONMENTS ... 11
3.1 Marsh and Tidal Creek Depositional System ... 11
3.2 Estuaries and Inlets ... 16
3.3 Beach and Nearshore Depositional Systems ... 19
3.3.1 Offshore - Bioturbated Facies ... 19
3.3.2 Transition Zone – Bioturbated and Laminated Facies ... 20
3.3.3 Shoreface (Lower Forebeach) – Burrowed and Laminated Facies ... 20
3.3.4 Foreshore (Upper Forebeach) – Laminated Facies ... 21
3.3.5 Backshore (Backbeach) – Laminated and Bioturbated Facies ... 21
3.3.6 Dunes – Eolian Laminated and Bioturbated Facies ... 23
3.3.7 Washover Fans ... 24
3.4 Barrier Island Models - Response to Rising Sea Level ... 30
3.5 Facies Successions – Walther’s Law of Facies ... 34
4 GEOLOGICAL SETTING ... 36
4.1 Regional Geological Setting ... 36
4.2.2 Northern Accretional Terrains ... 46
4.2.3 Southeastern Accretional Terrains ... 50
4.3 Island Development Model ... 51
5 RESEARCH METHODS ... 56
5.1 Shoreline Dynamics Methods ... 56
5.1.1 Methodology ... 57
5.1.2 Error/Uncertainty Analysis ... 59
5.1.3 Data Sources ... 66
5.2 Vibracoring Methods ... 67
5.2.1 Methodology ... 69
5.2.2 Data Processing ... 72
5.3 XRF Methods ... 73
5.3.1 Methodology ... 73
5.3.2 Data Collection ... 74
5.3.3 Data Processing and Analysis ... 76
5.3.4 Current Study Approach ... 79
5.4 Evaluation of Late Holocene Sea Level ... 80
5.4.1 Background ... 81
5.4.2 Methodology ... 83
5.4.3 Radiocarbon Data Calibration Methods ... 83
6 RESULTS ... 86
6.1.2 Mission Santa Catalina de Guale Landform Dynamics ... 93
6.2 Vibracoring ... 102
6.2.1 Seaside Spit Study Area ... 105
6.2.2 Beach Pond Study Area ... 109
6.2.3 Flag Pond Study Area ... 112
6.2.4 North Beach Study Area ... 114
6.2.5 St. Catherines Shell Ring - High Marsh Core ... 119
6.2.6 Mission Santa Catalina de Guale ... 121
6.3 XRF Results... 124
6.3.1 Correlation Analysis ... 125
6.3.2 Cluster Analysis ... 128
6.3.3 Facies/Depositional Subenvironment Evaluation ... 132
6.3.4 Quality Assurance/Quality Control... 138
6.4 Lithostratigraphic and Chemostratigraphic Results ... 141
6.4.1 Seaside Spit Study Area ... 141
6.4.2 Beach Pond Study Area ... 143
6.4.3 Flag Pond Study Area ... 146
6.4.4 North Beach Study Area ... 151
6.4.5 Mission Santa Catalina de Guale ... 154
6.4.6 Southeastern Accretional Terrains ... 155
6.5 Evaluation of Late Holocene Sea Level Conditions ... 163
7 DISCUSSIONS ... 172
7.1 Chemofacies of Barrier Island Sediments ... 172
7.2 Shoreline Dynamics and Anthropogenic Mods to Sediment Supply ... 174
7.3 Environmental Change ... 188
7.4 Stratigraphic Models ... 198
7.5 Stratigraphy and Development of St. Catherines Island ... 199
7.5.1 Southeastern Accretional Terrains ... 199
7.5.2 Northern Accretional Terrains ... 200
7.5.3 Northeastern Accretional Terrains ... 205
7.5.5 St. Catherines Island – Holocene Developmental Mode ... 207
7.6 Evaluation of Late Holocene Sea Level ... 215
7.6.1 Late Holocene Sea Level - Radiocarbon Data ... 215
7.6.2 Late Holocene Sea Level - Calibrated Radiocarbon Data ... 217
7.6.3 Late Holocene Sea Level - Interpolated Sea Level Curve ... 221
7.7 Limitations and Uncertainties of Data ... 227
8 CONCLUSIONS AND RECOMENDATIONS ... 231
8.1 Conclusions... 231
8.2 Recommendations ... 234
8.2.1 Future Scenarios - Implications to the SCISTP and AMNH Archaeology Program ... 234
8.2.2 Opportunities for Research - “Coastal Change” Program ... 235
Appendix A: Shoreline Dynamics Model Results ... 261
Appendix B: Vibracore Boring Logs ... 270
Appendix C: XRF Results ... 315
Appendix D: Chemostratigraphic Logs ... 333
Appendix E: Shoreline Forecasting Results ... 353
Table 1: Mineralogy of Heavy Mineral Sands, Selected Localities from Southeast
Georgia and Northeast Florida ... 43
Table 2: Shoreline Uncertainty Evaluation, Shoreline Dynamics Study... 64
Table 3: Shoreline Uncertainty Evaluation, Mission Santa Catalina de Guale Landform Dynamics Study ... 66
Table 4: Mission Santa Catalina de Guale, Landform Dynamics Results ... 100
Table 5: Vibracore Boring Information ... 105
Table 6: Chemofacies, Descriptive Statistics and Lithofacies ... 131
Table 7: Lithofacies and Chemofacies Evaluation ... 136
Table 8: Evaluation of Late Holocene Sea Level Conditions, Radiocarbon Sample Metadata and Age/Depth Relationship Data ... 164
Table 9: Mineralogy of Heavy Mineral Sands and FPXRF Results for the Most Commonly Detected Analytes ... 173
Figure 1-1: Index map of Coastal Georgia and South Carolina ... 2
Figure 1-2: Global occurrence of barfrier islands in mesotidal settings ... 5
Figure 2-1: St. Catherines Island Location Map ... 7
Figure 2-2: Topography and land cover of St. Catherines Island, GA. ... 10
Figure 3-1: Elements of the marsh and tidal creek depositional environments of St. Catherines Island, GA. ... 13
Figure 3-2: Elements of inlets and sounds associated with St. Catherines Island, GA... 18
Figure 3-3: Elements of supratidal and intertidal beach environments associated with St. Catherines Island, GA. ... 22
Figure 3-4: Elements of eolian/dune and washover depositional environments associated with St. Catherines Island, GA. ... 25
Figure 3-5: Washover fan generalized facies stratigraphic models ... 29
Figure 3-6: Barrier islands and associated depositional environments response to sea level ... 32
Figure 3-7: Transitional stages of washover fans ... 33
Figure 3-8: Facies associated with subtidal, intertidal and supratidal depositional environments of St. Catherines Island, GA. ... 35
Figure 4-1: Development of successive shorelines on the Georgia Coast ... 37
Figure 4-2: Geology and Geomorphology of St. Catherines Island ... 44
Figure 4-3: Holocene accretional terrains of St. Catherines Island ... 47
Figure 4-4: Comparison of the Sapelo/Blackbeard Island Doublet with the hypothesized St. Catherines/Guale Island Doublet ... 52
Figure 5-2: Equipment and methods in vibracoring ... 70
Figure 5-3: Equipment and methods in XRF analysis of cores and reference samples ... 75
Figure 5-4: Vibracore and XRF data process flowchart ... 77
Figure 5-5: Application of facies and mean sea level constraining data ... 84
Figure 6-1: Shoreline dynamics results ... 89
Figure 6-2: Dynamics of McQueen Dune Field ... 91
Figure 6-3: Shoreline dynamic rates vs. landforms: Pre-Dam Era (1859-1951) ... 94
Figure 6-4: Shoreline dynamic rates vs. landforms: Post-Dam Era (1968-2011) ... 95
Figure 6-5: Framework for the DSAS Model - Mission Santa Catalina de Guale ... 97
Figure 6-6: WLR rates (1951-2013): Mission Santa Catalina de Guale ... 99
Figure 6-7: Landform changes - Mission Santa Catalina de Guale ... 101
Figure 6-8: WLR rates by landform - Mission Santa Catalina de Guale ... 103
Figure 6-9: Location maps for vibracores ... 104
Figure 6-10: Vibracore locations associated with Mission Santa Catalina de Guale, St. Catherines Island, GA. ... 122
Figure 6-11: XRF Results - Frequency of Detections ... 126
Figure 6-12: XRF Results - Intercorrelations ... 127
Figure 6-13: Chemofacies Results - Relative elemental abundances ... 131
Figure 6-14: Chemofacies Results - Depositional Environments ... 133
Figure 6-15: XRF Results - Quality Control ... 139
Figure 6-16: Vibracore data and interpreted section - Seaside Spit Study Area ... 142
Figure 6-19: Chemostratigraphy - Beach Pond Study Area ... 147
Figure 6-20: Vibracore data and interpreted section - Flag Pond Study Area ... 148
Figure 6-21: Chemostratigraphy - Flag Pond Study Area ... 150
Figure 6-22: Vibracore data and interpreted section - North Beach Study Area ... 152
Figure 6-23: Vibracore data and interpreted section - Mission Santa Catalina de Guale ... 156
Figure 6-24: SE Accretional Terrains Interpreted Section ... 157
Figure 6-25: Cracker Tom Transect Details ... 159
Figure 6-26: Beach and Flag Pond Transect Details ... 161
Figure 6-27: Late Holocene conceptual sea level curve ... 165
Figure 6-28: Sea level envelope for St. Catherines Island in radiocarbon years ... 169
Figure 6-29: Sea level envelope for St. Catherines Island in calibrated years ... 171
Figure 7-1: Tide gauge data from Ft. Pulaski, Georgia ... 176
Figure 7-2: Timeline of modifications to the Savannah River system... 177
Figure 7-3: Pre-dam and post-dam sediment flux rates for five major watersheds in the southeastern U.S. ... 179
Figure 7-4: Quantitative and qualitative indications of an acceleration in shoreline retreat for the spit/berm landforms associated with Seaside Spit, Middle Beach and South Beach ... 181
Figure 7-5: Comparison of shoreline retreat at St, Catherines Island, GA to barrier islands of the Georgia Bight ... 183
Figure 7-6: Barrier island schematic model ... 185
Figure 7-7: Environmental change at the Seaside Spit Study Area ... 189
Figure 7-10: Environmental change at the Beach Pond Study Area interpreted section ... 193
Figure 7-11: Evaluation of shoreline dynamics as an agent of environmental change on sea turtle habitat ... 195
Figure 7-12: Developmental model for the southeastern accretional terrains ... 201
Figure 7-13: Holocene cover materials – vertical accretion model ... 209
Figure 7-14: Revised Island Developmental Model ... 213
Figure 7-15: Plotted sea level envelope in radiocarbon years before present (B.P.) for St. Catherines Island, Georgia compared to previous radiocarbon sea level curves ... 216
Figure 7-16: Plotted sea level envelope in calibrated years before present (Cal B.P.) for St. Catherines Island, Georgia compared to previous calibrated sea level curves ... 218
Figure 7-17: Working model for sea level conditions (St. Catherines Island, GA) ... 226
Figure 7-18: Comparison of SCI sea level envelope and Gulf of Mexico/Global sea level data and Bond events... 228
Figure A-1: Framework for the DSAS Shoreline Model (St. Catherines Island, GA) ... 261
Figure A-2: Index map to detailed study areas ... 262
Figure A-3: Shoreline dynamics modeling results for the north end of St. Catherines Island, GA. ... 263
Figure A-4: Shoreline dynamics modeling results for the Yellow Banks Bluff area ... 264
Figure A-5: Shoreline dynamics modeling results for the south end of Seaside Spit ... 265
Figure A-6: Shoreline dynamics modeling results for the area located to the south of McQueen Inlet ... 266
Figure A-9: Shoreline dynamics modeling results for the north end of St. Catherines
Island, GA. ... 269
Figure E-1: Shoreline Forecasting Exercise Results North - Scenario I ... 353
Figure E-2: Shoreline Forecasting Exercise Results North - Scenario II ... 354
Figure E-3: Shoreline Forecasting Exercise Results Middle Beach - South Beach (North) ... 355
Figure E-4: Shoreline Forecasting Exercise Results South Beach (Central) ... 356
Figure E-5: Shoreline Forecasting Exercise Results South Beach (South) ... 357
1 INTRODUCTION
St. Catherines Island is one of twelve barrier islands located on the Georgia Coast,
situated approximately 32 kilometers (20 miles) south of Savannah, Georgia (Figure 1-1). St.
Catherines Island is a privately owned island that has been dedicated to research, education and
conservation efforts with programs administered under the Edward John Noble Foundation. The
island was purchased by Edward John Noble in 1943 and transferred to the foundation bearing
his name in 1968. Previous land use of the island since European colonization included the
production of cotton, rice and cattle. The focus of the current programs include an island
archaeological research program conducted by the American Museum of Natural History (David
Hurst Thomas, Director), a sea turtle conservation program (Gale A. Bishop, Director),
educational programs administered by Georgia Southern University, and Sewanee: The
University of the South and supporting research programs by other entities.
A major emphasis of sedimentary geology is the comparison of ancient depositional
facies and modern analogues. St. Catherines Island, Georgia offers a unique study opportunity in
that the major or more common mesotidal barrier island depositional environments and
sub-environments exist in a natural setting with minimal modern anthropogenic modifications on a
local scale. Progradation of the modern beach depositional environment and subenvironments
(beach ridge, backbeach, foreshore, shoreface, etc.) is currently occurring within a limited area in
the northeastern portion of the island. Aggradational features such as Holocene salt marshes and
tidal creeks and associated drainages border the western, southern, and eastern portions of the
island. These modern depositional environments are also reflected in the geology of the island as
§
¨
¦
95§
¨
¦
16§
¨
¦
516 Long Liberty Bryan Bulloch Glynn Jasper Wayne McIntosh Camden Effingham Chatham Brantley Evans Beaufort Beaufort Tattnall Chatham Charlton Candler Beaufort Camden Screven Colleton Pierceµ
GEORGIA SOUTH CAROLINA Atlantic Ocean0 10 20 40Km
[image:22.612.71.539.67.652.2]Scale
Figure 1-1: Index map of Coastal Georgia and South Carolina, showing the location of St. Catherines Island, Georgia. Note that St. Catherines Island is located approximately equidistant from the Savannah and Altamaha Rivers, the major tributaries and sources of sediment to the Georgia Coast.
St. Catherines Island
Alta
maha R iver Sa van nah River SAVANNAH BRUNSWICK
µ
Index map to above Gulf of Mexico Atlantic Ocean UNITED STATES OF AMERICAPacific Ocean
CANADA
MEXICO
STUDY AREA INDEX MAP
intertidal and supratidal depositional environments. The island is comprised of three major
geomorphic components consisting of an older Pleistocene Island Core, Holocene accretional
terrains consisting of beach ridge and swale systems and Holocene marsh sediments. Therefore,
St. Catherines Island offers a unique field setting in that the modern depositional environments
and sub-environments associated with barrier island systems are situated in close proximity to
the older Holocene and Pleistocene sedimentary deposits, allowing for direct comparisons
between the physical, chemical and biogenic features from the recent rock record with modern
analogues.
1.1 Research Objective
The current study has evaluated modifications to the barrier island system under the
modern marine transgression with attention on the two major controls of barrier island formation.
Attempts have also been made to continue to develop an understanding of the stratigraphy of St.
Catherines Island and to evaluate Late Holocene sea level conditions. The current study
supplements and expands upon the geoarchaeological efforts that culminated in the
“Geoarchaeology of St. Catherines Island”, published in the Anthropological Papers of the
American Museum of Natural History, Number 94 (Bishop, Rollins and Thomas, 2011).
Specifically, the current study addresses questions including how did sea level and landforms
change during the 5,000 years of human occupation of St. Catherines Island? In addition, what
is the relative role of the two major controls on barrier island formation and modification
processes in the mesotidal setting of the Georgia Bight and what are the implications to barrier
systems in similar settings? To facilitate an understanding of the initial question, a shoreline
modern transgression where modern sea level dynamics are established from historical tide
gauge data (1930s to present) and anthropogenic modifications to sediment supply. This
baseline model of shoreline dynamics was created with attention to changes in the rates of
sediment supply and sea level rise or the primary controls on barrier island formation and
modification processes. Based on an existing qualitative understanding that the rate of sediment
supply has been modified in the modern era by anthropogenic activities, an initial hypothesis was
formed that the rate of sediment supply would be the major control on the barrier island system.
This assumption was extended and tested by quantifying the magnitude and timing of
modifications to the rate of sediment supply and comparing the change in sediment supply rates
to changes in the shoreline and associated landforms at St. Catherines Island. The baseline
model of shoreline dynamics was then used with evidence from the sedimentary record of St.
Catherines Island to evaluate the relative role of sea level rise versus sediment supply in the
development of the island during the Holocene. The results of the current study have direct
implications to sea level and landform changes during human occupation of St. Catherines Island
as well as to other Holocene barrier islands in similar mesotidal settings throughout the world
Figure 1-2: Results from the current study regarding the relative roles of the rate of sediment supply and the rate of increase in a accomodation space (sea level rise) and the corresponding stratigraphic models for washover fans and barrier island response to sea level rise have implications on barrier island systems in similar physical or mesotidal settings worldwide. Figure adapted from Leatherman, 1979.
MACROTIDAL: > 4 m
After Davies, 1973. MESOTIDAL: 2-4 m MICROTIDAL: < 2 m BARRIER AND LAGOON
LEGEND
2 STUDY AREA PHYSICAL SETTING
St. Catherines Island is bordered by the Atlantic Ocean to the east, tidal marshes to the
west, Sapelo Sound to the south and St. Catherines Sound to the north (Figure 2-1). These
sounds are the lower reaches of salt water estuaries or marine embayments that are devoid of
significant fluvial input or discharge (Wadsworth, 1981). St. Catherines Island is dependent
upon net longshore transport of sand from north to south along the Georgia Coast (Hails and
Hoyt, 1969, Clayton et al., 1992) and short term storage in tidal deltas. Landforms associated
with the net longshore transport include the chenier-like deltas with notable southward accretion
located at the Savannah River and Altamaha River Deltas (Alexander and Henry, 2007). Recent
sea-level trends are documented on The NOAA Sea Levels Online site (NOAA, 2013)for the
region including a current sea level rising rate of 2.98 millimeters per year (mm/yr) at Fort
Pulaski near Savannah, Georgia and a rate of 2 mm/yr (1897-1999) at Fernandina Beach,
Florida. An estimated sea level rise rate of 2.7 mm/yr is interpolated from these values for the
study area of St. Catherines Island. The combination of factors, including the starving of
longshore transport or flow of sand by damming rivers to the north, dredging the Savannah Ship
Channel across the Savannah River Delta (U.S. Army Corps of Engineers, or USACE, 1991,
1996), and rising sea level have accumulated to make St. Catherines one of Georgia's most
erosional barrier islands (Griffin and Henry, 1984). The significance of this setting is that the
changes in shoreline, succession of depositional environments, and associated ecological effects
observed on St. Catherines Island will eventually be reflected along the entire barrier island suite
Ossabaw Island
St. Catherines Island
Sapelo Island
Blackbeard Island
St. Catherines Sound
Sapelo Sound
Image from ESRI data and maps, 2013.
[image:27.612.73.541.71.656.2]Atlantic Ocean
this premise, St. Catherines Island may be considered as a sentinel island for the barrier islands
of the Georgia Bight (Bishop et al., 2007).
The island may be subdivided into four physiographic areas: 1) the island core, 2) the
northern ridges and swale area composed of Holocene accretional beach ridges, 3) the marshes
located west, east and south of the island core, and 4) the southeastern ridges and swales
composed of Holocene accretional beach ridges. The island core is situated between 3 and 9
meters above mean sea level MSL and is approximately 8 km long and 2 km wide, with a long
axis oriented north-northeast (N20°E to N25°E). There is little relief on the western portion of
the island core, whereas the eastern portion rises to over 9 m MSL with little to moderate relief.
The island core is heavily vegetated with maritime forest (Bellis, 1995) dominated by longleaf
pine (Pinus palustris), live oak (Quercus virginiana) and palmetto (Serenoa repens).
The northern beach ridges are linear in shape and occur in three different orientations in
the north-central, northwestern, and northeastern portions of the island. The beach ridges in the
north-central portion of the island extend to 1,600 meters in length with a N55°W to N65°W
trend and are truncated on the western and northwestern portions by the modern beach. The
ridges rise to approximately 3.3 meters (11 feet) above the high tide elevation with the
intervening swales varying from 1.5 meters (5 ft.) to 2.1 meters (7 ft.) above the high tide
interval. A linear dune ridge set of appreciable height (25 ft. to 27 ft. MSL) and bearing
north-south truncates the north-central beach ridges on the east and denotes the approximate location of
the shoreline on the 1859 US Coast and Geodetic Survey Navigational Chart.
The southeastern beach ridges are linear in shape, extend to 5,000 meters in length with a
N20°E to N25°E trend and are truncated on the eastern and southern portions of the ridges by
above the high tide elevation with the intervening swales varying from 1.5 meters (5 ft.) to 2.1
meters (7 ft.) above the high tide interval. The ridges occur in a series of packages with two
distinct orientations that are generally oriented parallel to the modern shoreline and parallel to
Sapelo Sound.
The modern marshes occupy the intertidal portions of the eastern, western, and southern
margins of the island (Figure 2-2). The low marsh zone lies between neap high tide and mean
high tide at approximately 0.6 meters to 1.1 meters above the mean low tide line and the high
marsh is situated between the mean tide and spring high tide elevations and typically occurs from
1.1 meters to 2.0 meters above the mean low tide interval. Grasses dominate the land cover
vegetation associated with the marshes and include Spartina alterniflora (Smooth Cordgrass or Saltmarsh Cordgrass) and salt tolerant plants or halophytes such as Salicornia (glasswort), Distichlis (salt grass), Juncus (needlerush) and Spartina patens (short marsh grass). Additional
information regarding the interactions of plants, animals and the modern environments of St.
0 1 2km Scale
Legend
Lidar Topography (ft msl) Value
High : 44.076
Low : -6.0449
Roads
Atlantic Ocean
Sapelo Sound
St. Catherines Sound
0 1 2km
Scale Legend
Land Cover (IEP, 2007)
Landcover clearing compound forest island lagoon marsh pasture pond sand water zoo Roads Atlantic Ocean Sapelo Sound
[image:30.612.79.527.68.657.2]St. Catherines Sound
Figure 2-2: Comparison of the island topography (left) and island land cover (right) showing the strong relationships between the two data sets where lower topographic areas are dominated by intertidal marshes and the higher island core is vegetated by maritime forests. Data from Meyer et al., 2009.
3 BARRIER ISLAND SYSTEMS
AND MODERN DEPOSITIONAL ENVIRONMENTS
The following sections provide an overview of the predominant barrier island
depositional environments and associated facies that are present on St. Catherines Island and
common to the Georgia Bight. Specific attention is given to the most common physical
sedimentary structures and the primary biogenic sedimentary structures as well as the modifying
biogenic processes that are readily identifiable in vibracore samples and limited outcrops that are
available within the study area.
Barrier islands are defined by of six major sedimentary environments that are interactive
in nature (Oertel, 1985) and impart the term “barrier island” on a littoral sand body and are
defined as the 1) mainland, 2) backbarrier lagoon (or marsh), 3) inlet and inlet deltas, 4) barrier
island, 5) barrier platform, and 6) shoreface. The following sections provide descriptions of the
depositional elements of barrier islands including the marsh and tidal creeks, estuaries and inlets,
beach, and nearshore depositional environments with a focus on the diagnostic physical and
biogenic sedimentary structures that occur within each environment.
3.1 Marsh and Tidal Creek Depositional System
The intertidal salt marsh system and associated drainages (tidal creeks) form a complex
and dynamic depositional system. Facies are dominated by fine grained sediments (clays/silts),
with variations in the amount of coarse grained sediments (sand, granules, pebbles) being
dependent upon numerous factors including the distance to the shoreline and proximity to upland
runoff. Sedimentation in the marsh environment occurs as a surface process (Howard and Frey,
1985) in the form of peat development due to the accumulation of organic detritus and the
deposition of fine grained inorganic sediment transported into the system by flood tides. The
maximum depth of the modern marsh system may be defined by the erosion or scour depth of the
meandering tidal stream channels. This scour depth is a function of the size and discharge of the
tidal creeks or rivers. St. Catherines and Sapelo Sounds extend to depths of 15 meters below
Mean Low Tide (MLT), the Medway River reaches a depth of 12 meters MLT, Walburg Creek
extends to a depth of 6 meters MLT, and the tidal creeks located to the east of the island extend
to 3-5 meters MLT. The smaller tidal creeks and rivers are typically less than 50 meters in width
produce landforms that are typical of meandering streams. These landforms include meanders,
levees, meander cutoffs, oxbows, point bars, cut banks and lateral stream capture of other tidal
creeks (Figure 3-1).
Flow in these intertidal streams is dominated by tidal forces and has been described as
asymmetrical bimodal flow (Oertel, 1975), with ebb flow being slightly more dominant. Point
bars tend to migrate in the direction of flow, producing an upstream migration of point bars
during flood tides and a downstream migration under ebb flow regimes. Due to the bimodal
flow, cut banks develop as double cut banks with erosion occurring on the upstream and
downstream portions of the features, depending upon the flood and ebb tidal conditions (Figure
3-1b). The lateral migration of tidal creeks has been estimated at 1-2 m per year (Letzsch and
Frey, 1980) with the depth of erosion dependent on the aforementioned characteristics of the
channel. The lateral migration and associated channel fill processes by point bars is a complex
system whereby marsh sediments are aggressively reworked, producing a myriad of facies and
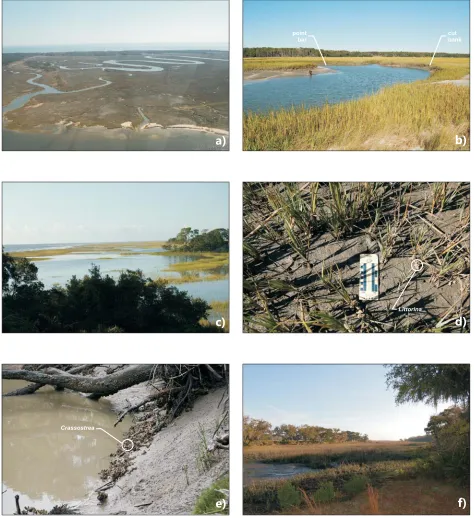
Figure 3-1: Elements of the marsh and tidal creek depositional environments of St. Catherines Island, GA. a) Low marsh environment with extensive meanders of tidal creeks, stream capture is typically promoted by lateral meanders rather than headward erosion of streams, b) sandy facies of point bar (left) and muddy facies of cut bank (right) of Fish Creek in Seaside Marsh, c) low marsh and high marsh surfaces inundated with water at spring tide high level in Seaside Marsh, d) muddy substrate of the low marsh environment near South End Plantation with tall marsh grass (Spartina
alterniflora) and marsh periwinkle snails ( ), e) “clumping” habit of
in creek meander adjacent to the island core, and f)
Littorina irrorata Crassostrea
virginica low marsh to high marsh transition in
former Holocene beach ridge swales near Cracker Tom Causeway. Photographs by B. Meyer.
a)
c)
e)
b)
d)
f)
point
bar cutbank
Littorina
Within the marsh system, the depositional and biotic environments may best be described
in terms of elevation, which is a direct result of the tidal reach. The highest elevation
environment directly affected by tidal flux, rather than only storm surge or washover events is
the flat-lying area covered by the marsh grass, Spartina alterniflora. This low marsh zone lies
between neap high tide and mean high tide at an elevation between 0.6-1.1 m above MLT.
Common biota in this zone include both tall and short Spartina, a semi-infaunal bivalve,
Geukensia demissa, a gastropod Littorina irrorata, lives on the Spartina, and the fiddler crabs
Ucapugnax and Uca pugilator. Uca pugnax tends to live on sandy substrates at higher
elevations (high marsh) and Uca pugilator at lower elevations on muddy substrates. The high
marsh interval from 1.1-2.0 m is situated between the mean tide and spring high tide elevations
and is typically associated with more coarse grained sediments than the lower marsh
environment. Flora include more salt tolerant plants or halophytes such as Salicornia
(glasswort), Distichlis (salt grass), Juncus (needlerush) and Spartina patens (short marsh grass)
in lower elevations of the high marsh. The high marsh environment is typically located adjacent
to upland areas such as the island core (and/or mainland), but may also occur in close proximity
to the backbeach environment on washover fans, and within dune ridge swales (Figure 3-1f).
Erosion of the upland materials, washover fans and dune ridges contribute coarse grained
materials via erosion and surface water runoff to the high marsh and storm activity provides an
input of coarse grained materials from the backbeach environment. Facies associated with the
high marsh include muddy sands and laminated sands and muds.
The barrier islands and associated marsh systems located along the Georgia Coast are
dependent upon the net longshore transport of sediments or material from a northeastern to
Hoyt, 1969, Clayton et al., 1992). This longshore current, and the inland transport of sediment as
a result of flood tidal action, also provides a source of sediments to the marsh systems that are
rich in illite and montmorillonite clays (Meade, 1969). Clay sediments of the outer shelf of
Georgia that are susceptible to inland transport are dominated by illite-montmorillonite and
contain as little as 10% kaolinite (Pinet and Morgan, 1979). The kaolinite rich suspended load
from the larger Piedmont Rivers is mixed with the marine load of illite-montmorillonite clay in
the tidally influenced estuaries. Previous work (Neiheisel and Weaver, 1969) has shown that the
Coastal Plain Rivers with relatively lower flow regimes or discharge rates typically do not
exhibit as strong of a kaolinite signature as the larger Piedmont Rivers.
Within the estuary or depositional basin near the mouth of the river, the clays are settled as a
result of decreasing water velocity as the rivers approach base level as well as flocculation
induced by contact with saline waters (Pevear, 1988). The greater ionic strength of the marine
water produces a decrease in the surface charge allowing the clays to aggregate and settle from
the suspended load. Sedimentation rates in marshes adjacent to the Savannah River estuary were
estimated at 1.0 cm/yr by Goldberg et al. (1977). In addition to the physical settling of
flocculated mud from suspension, biogenic pelletization is promoted by the filtering of sea water
by organisms (Pryor, 1975). The most important of the filter-feeding organisms with regards to
volumetric contribution of muds to the marsh system (Frey and Basan, 1985; Smith and Frey,
1985; Pryor, 1975) are the ribbed mussel (Geukensia demissa) and the Atlantic Oyster
(Crassostrea virginica). Secondary contributions of muds to the marsh include ghost shrimp
fecal matter that may be transported via washover processes or flood tide transport (Frey and
and mud snails (Ilyanassa obsoleta) also prevents re-suspension, as well as algal mats that trap
muds within the marsh system (Frey and Basan, 1985).
3.2 Estuaries and Inlets
Barrier lagoons or marshes and the open oceans are connected via inlets that serve as the
orifices or pathways through which sediment and water transport and exchange occur between
the lagoon and shoreface of the barrier island system (Oertel, 1985). A bivariate relationship
exists (O’Brien, 1969 and Jarrett, 1976) between the cross-sectional area of the tidal inlets (Ai)
and the tidal prisms of the backbarrier lagoon or marsh (P):
Ai = nPK
where n and K are constants
This relationship predicts that as lagoon or marsh flooding increases as expected under a
marine transgression, a proportional increase in the cross-sectional inlet surface area occurs most
commonly via erosion. Conversely, a decrease in lagoonal flooding under a marine regression
will result in constriction of the inlet through expansion of the bounding barrier islands.
Superimposed on the simple bivariate relationship are factors that complicate the process
including anthropogenic modifications and areas where sediment supply and morphology (i.e.
bedrock substrate) are not in equilibrium (Oertel, 1985).
A portion of the inlet throat area is typically scoured at depth forming an inlet trough.
The trough slopes upward in both a seaward and landward direction over “ramps” to more
shallow waters (Oertel, 1973). In barrier island systems, these features are designated as
inlet-lagoon and inlet-shoreface ramps. When the inland or onshore flow through a tidal inlet is
landward side of the barrier island and associated inlet (Hayes, 1975). In contrast, ebb-tidal
deltas are formed on the ocean side of an inlet and are commonly associated with the inlets and
sounds in the mesotidal setting of the Georgia Bight. The inlet shoreface ramps associated with
ebb-tidal deltas are typically covered with current structures that consist, in a landward to
seaward direction, of sand waves, megaripples and ripples near the distal shoals of the ebb-tidal
delta. Inlet ramps have distinct physical sedimentary structures and sediments associated with
the transition from shoreface sands to muddy lagoonal or marsh sediments (Kumar et al., 1974).
St. Catherines Sound is located between St. Catherines Island and Ossabaw Island to the
north and is the discharge estuary for the Medway River, Bear River, North Newport River,
Timmons River and Walburg Creek. Sapelo Sound is located to the south of St. Catherines
Island and is formed by the confluence of the Sapelo River, Todd River, Barbour Island River,
Wahoo River, South Newport River, Johnson Creek and Blackbeard Creek. Box cores collected
by Howard and Frey (1985) indicate significant variations in the sedimentary facies associated
with St. Catherines Sound and Sapelo Sound. St. Catherines Sound sediments are described as
being predominately bioturbated muddy fine sand with gravel in the upper reaches, and coarse,
graded, planar and trough-crossbedded sands near Pleistocene aged sediment sources. A
significant ebb-delta system is associated with St. Catherines Sound that includes St. Catherines
Shoal (aka St. Catherines Bar) and a well-developed marginal shoal that extends onto the
northern shores of the island. This margin shoal is composed of muddy sands and exhibits many
of the characteristics of ebb deltas including sand ripples, scour pools, and Skolithos inchnofacies
(Figures 3-2a, 3-2b and 3-2c). Sapelo Sound sediments are characterized as being coarser
grained, graded sands with trough-crossbedded sands and local gravel in the upper reaches of the
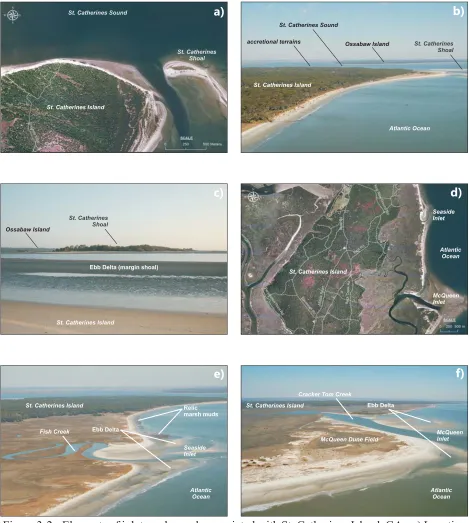
Figure 3-2: Elements of inlets and sounds associated with St. Catherines Island, GA. a) Location of St. Catherines Sound and St. Catherines Shoal that has developed as a portion of the ebb delta
complex, b) Oblique view of St. Catherines Sound, ebb delta, St. Catherines Shoal and active
accretional terrains, c) the marginal shoal of the ebb delta forms a muddy sand flat adjacent to St.
Catherines Island with sand ripples, scour pools, and inchnofacies, d) Location of tidal
inlets and associated ebb tidal deltas at Seaside Inlet (discharge point of Fish Creek) and McQueen Inlet (discharge point of Cracker Tom Creek), e) oblique view of Seaside Inlet ebb delta and relic marsh muds on North Beach, f) oblique view of McQueen Inlet ebb delta and McQueen Dune Field. Map images in A and D are 2009 true color imagery from USDA NAIP, photographs by B. Meyer.
Skolithos a) c) e) b) f) d) St. Catherines Sound
St. Catherines Sound
accretional terrains Ossabaw Island
Ossabaw Island
St. Catherines Island
St. Catherines Island
Atlantic Ocean Atlantic Ocean Atlantic Ocean Atlantic Ocean St. Catherines Island
Seaside Inlet Seaside Inlet McQueen Inlet McQueen Inlet St. Catherines Island
St. Catherines Island
St. Catherines Island
Fish Creek
Cracker Tom Creek
McQueen Dune Field
Ebb Delta Ebb Delta (margin shoal)
Two additional tidal inlets are formed on the eastern portion of St. Catherines Island by
the discharges of Cracker Tom Creek (McQueen Inlet) and Fish Creek (Seaside Inlet). These
inlets receive discharge from tidal creeks that are situated within the eastern marsh system on St.
Catherines Island (Figure 3-2d). Small ebb deltas that function as sediment banks are located
adjacent to these inlets and are exposed at low tide and associated with small areas of shoreline
stability (Figures 3-2e and 3-2f).
3.3 Beach and Nearshore Depositional Systems
The following sections describe the physical and biogenic sedimentary structures
associated with the beach and nearshore depositional systems including offshore, transition zone,
shoreface, foreshore (forebeach), backshore (backbeach), dune (eolian), and washover fan
depositional environments.
3.3.1 Offshore - Bioturbated Facies
In water depths of 10 meters to 20 meters, the offshore facies below the average wave
effective depth consists predominately of highly bioturbated muddy fine sands (Howard and
Reineck, 1972 and Howard and Frey, 1980). This facies is dominated by biogenic structures due
to the quiescent conditions that favor bioturbation over deposition except during extreme storm
events. These sediments have been extensively re-worked where individual burrows may no
longer be recognizable. In water depths greater than 10 meters the modern shelf is characterized
3.3.2 Transition Zone – Bioturbated and Laminated Facies
Sediments from this depositional environment occur in water depths of 10 meters below
MLT and extend upward into the intertidal zone and exhibit both physical and biogenic
sedimentary structures. Physical sedimentary structures are observed in the form of muddy fine
sands and mud layers with erosional contacts that truncate burrows. Hummocky style bedding
may also be found with parallel-laminated and burrowed beds. Three distinct burrow types can
be found, although all of them may not be present in one specific location. These biogenic
structures include burrows of polychaete worms, Callianassa and Thalassinoides-type burrows.
Howard and Scott (1983) observed this facies in a Pleistocene age outcrop on the St. Mary’s
River and noted an absence of physical sedimentary structures. The massive bioturbation that
destroys physical sedimentary structures was attributed by Howard and Scott to indicate the
minimal influence of storms in the transition zone.
3.3.3 Shoreface (Lower Forebeach) – Burrowed and Laminated Facies
The continuous effects of waves and currents in the intertidal zone results in extremely
varied and well developed physical sedimentary structures in the lower forebeach or shoreface
area. Sedimentary structures include ripple laminations in the lower or deeper sections with
parallel laminae in the upper sections associated with the transition to the foreshore environment.
Biogenic structures include Ophiomorpha nodosa mud-lined burrows attributed to Callianassa
major (Say, 1818) or the Carolinian Ghost Shrimpthat decrease in abundance or density with
increasing elevation where the burrows are typically not observed above the mean water line.
The burrows extend to depths of 2 meters and are noted by a small opening (0.4 cm) fringed with
3.3.4 Foreshore (Upper Forebeach) – Laminated Facies
Sedimentary structures observed in upper forebeach sediments include subparallel,
laminae dipping (< 5°) seaward, and laminae dipping (15°- 20°) landward due to the
development of ridge and runnels and ripple laminae may also be present in this facies due to
runnels. This facies transitions into the backshore at the neap high tide interval although the
exact boundary may be difficult to discern due to the transient or dynamic nature of the
boundary. Examinations of forebeach deposits at St. Catherines Island under the current study
indicate that the laminae may be faint or “ghostly” due to a lower relative abundance of the
heavy mineral sands (HMS) that provide bedding definition and post-depositional bedding
disturbance due to amphipod cryptobioturbation (Figure 3-3e). Heavy minerals were also
observed to concentrate on a small or local scale via sorting in the troughs of ripple marks
occurring in beach runnels (Figure 3-3f).
3.3.5 Backshore (Backbeach) – Laminated and Bioturbated Facies
Howard and Scott (1983) note that the main criteria used to differentiate the backshore or
backbeach from the foreshore/forebeach at Sapelo Island, Georgia are: 1) absence of ridge and
runnel structures, 2) higher concentrations of HMS and more distinct lamina, 3) more variations
in physical sedimentary structures, and 4) presence of ghost crab and insect burrows.
Examinations of backbeach deposits at St. Catherines Island under the current study indicate that
extensive deposits of HMS occur in this depositional environment as a result of winnowing
processes whereby quartz sands are preferentially transported via swash and backwash as the
Figure 3-3: Elements of supratidal and intertidal beach environments associated with St. Catherines Island, GA. a) inactive washovers, dunes, backbeach and forebeach environments, b) the storm high tide line is demarcated by vegetative debris or wrack, and corresponding spring tide high line, and neap tide high line. The sands of the backbeach are saturated during spring tides and exhibit higher albido, c) heavy minerals in the backbeach occur as a placer where winnowing of less dense quartz sands results in the concentration of heavy minerals, d) backbeach sands, horizontal laminae or low angle (<2 ) seaward dipping laminae of quartz and heavy minerals, e) forebeach sands with lower concentrations of heavy minerals and faint laminations due to amphipod cryptobioturbation, and f) asymmetrical ripple marks in a beach runnel. Photographs by B. Meyer.
0
a)
e)
b)
f) d) c)
Inactive Washover Fans
Storm High Tide
Storm High Tide Spring High Tide
Spring High Tide
Spring High Tide Backbeach
Neap High Tide
Neap High Tide
Neap High Tide Forebeach
concentrated heavy mineral sands
asymmetrical ripples in beach runnel
predominate flow direction
backbeach: horizontal laminations quartz/HMS
forebeach: faint laminations
Backbeach sediments may be distinguished from eolian sediments on the basis of primary
physical sedimentary structures. The transition from marine (backbeach) to non-marine
conditions may be observed at an elevation equal to or slightly above the modern spring tide high
mark of 1.7 to 2.1 m (Figure 3-3a and 3-3b). This elevation is marked by a change from low
angle bedding (backbeach) to higher angle bedding and represents the maximum elevation of wet
sand and the lowest elevation at which eolian scour may occur (Roep and Beets, 1988).
3.3.6 Dunes (Eolian) - Laminated and Bioturbated Facies
Dunes are typically 0.5 to 2 meters high but may reach over six meters in height and
denote supratidal conditions and the landward extent of the backbeach depositional environment.
Wind is the dominant depositional agent with minor hydraulic modifications during spring tide
and washover events. The saltation of sand across the dunes is a continuous process with plants
providing local slope stability. Dunes may be classified as 1) straw dunes, that are the initial and
small isolated dunes that are formed when sand is trapped by dead vegetation or marsh grasses,
2) foredunes that are intermediate dunes which are built upon straw dunes or by lateral migration
of existing mature dunes, and 3) primary dunes that are mature, large and densely vegetated
(Howard and Frey, 1980). Straw dunes are chiefly associated with salwort (Salsola kali) and
spike grass (Distichlis spicata); secondary dunes are associated with beach hogwart (Croton
punctatus), bitter panicgrass (Panicum amarulum) and occasionally salt meadow cordgrass
(Spartina patens). Sea oats (Uniola paniculata) are most closely associated with primary dunes
(Oertel and Larsen, 1976). Mature dunes associated with a prograding shoreline may become
vegetated under a natural succession scheme whereby shrubs or bushes such as wax myrtle
established with initial topsoil development. Interdunal swales are commonly vegetated by
sandbur (Cenchrus paucifloras) and species of the woody vine Smilax (Johnson et al., 1974).
The natural succession of vegetation associated with a prograding dune field may be observed on
North Beach at St. Catherines Island where the younger dunes in close proximity to the modern
shoreline are vegetated with sea grasses, and the older beach ridges and dunes located landward
are vegetated with shrubs and trees such as loblolly pine (Figures 3-4a, 3-4b and 3-4c).
Facies in this depositional environment are dominated by fine to very fine sands lacking
significant mud content. Heavy mineral laminae are observed in festoon cross bedding with beds
of up to 10 cm in thickness and dips greater than 300 ;, however, these shallow sedimentary
structures may be destroyed or disturbed by roots of the associated grasses, sea oats and trees or
shrubs. In addition, bioturbation by insects and mammals is common in the upper 3-4 meters
(Howard and Scott, 1983; Martin and Rindsberg, 2011).
3.3.7 Washover Fans
Washovers have been described as depositional units that result as a continuation of
swash over the top of the beach berm or dunes during a storm or high energy event (Leatherman
and Williams, 1977). A body of sediment is deposited as the washover flow velocity decreases
in areas typically located landward of a spit or barrier beach. The combination of overwash
processes, physical and biogenic modification of the washover fan, and compaction determine
the final washover stratigraphy. The composition of washover deposits vary with the provenance
of the sediment, but typically consist of alternating layers of sands, heavy minerals and shell
fragments that are the result of changing hydraulic regimes under storm and tidal conditions
relative age older younger relative age older younger
St. Catherines Sound
accretional terrains Ossabaw Island Atlantic Ocean shoreline retreat direction to shoreline a) c) e) b) f) d) modern dunes interdunal swale pond washover fans younger dune ridge older dune ridge inactive washovers quartz/heavy mineral sand laminae -washover fan muddy sand high marsh active washover Seaside Marsh Atlantic Ocean Atlantic Ocean Seaside Spit Fish Creek relic marsh mud current dune ridge older dune ridge
rate of sea level change determine the washover facies of the sedimentary units resulting from
individual storm events and greatly affect the preservation potential. Reworking of sediments is
common and compounds the challenges in the identification of individual storm events and
subunits.
Although washover fans may be formed during marine regressions they are much more
commonly observed in transgressive sequences (Deery and Howard, 1977) and are recognized
generally as washover units overlying backbarrier facies such as marsh sediments (Figures 3-4d
and 3-4f). The presence of foreset bedding structures is dependent on the antecedent water
levels where foresets may be present on the distal portions of the fan as a result of the fan
prograding into a bay or indicating high tide conditions during deposition in a marsh.
Examination of washover deposits at St. Catherines Island under the current study
indicate appreciable levels of HMS occur in this depositional environment as a result of the
washover sediments being dominated by a proximal source of backbeach and eolian quartz and
HMS deposits. The washover facies and the laminated backbeach and forebeach sands are
readily distinguished as laminae in the washover fans dip (< 20°) in a landward direction versus
the lower dip angles and seaward dip direction associated with backbeach and forebeach sands.
The washover deposits are lobate in plan view and wedge-shaped in longitudinal cross section,
and thin in a landward direction with a long axis normal to the coast. Foreset laminations occur
on the leading edge of washover fans, with sets and cosets up to 50 cm thick that dip up to 30°
landward. During periods of storm inactivity, small (< 1 m) eolian dunes, wind ripples and
blowouts may form on the sparsely vegetated and unstable surfaces. Shell lags may also develop
on some of the high washover surfaces. Small-scale crossbedding occurs with ripple laminae that
Washovers represent episodic deposition associated with significant storms such as hurricanes
and nor’easters and prograde in a landward direction. Individual washovers are typically 50 to
150 meters in length (parallel to flow direction) and 50 to 100 meters in width (parallel to shore).
Individual washover fans may exhibit lobes superimposed on the greater fan morphology and
multiple washovers can merge to form nearly continuous aprons. A continuous apron of
superimposed washover fans was observed along Seaside Spit in May 2013 following a
nor’easter storm event. Following deposition, washovers may be significantly modified by
erosion associated with rainfall and surface water runoff or coupled spring tide/storm events.
Washover fans typically form in the low marsh or high marsh environments adjacent to
the beach and eolian environments and as a result contain many of the same biogenic features of
the marsh system such as burrows from fiddler crabs (Uca pugilator) and ghost crabs (Ocypode
quadrata) and various insects including beetles (Martin and Rindsberg, 2011). Botanical
colonization of distal fan margins by glasswort (Salicornia) and bioturbation by fiddler crabs is
rapid and extensive. If washover fans form in the lower marsh and are inundated during tidal
cycles, smooth cordgrass (Spartina alterniflora) or other marsh grasses may vegetate the surface,
resulting in the accumulation of peat materials and root mottling obscuring the primary physical
sedimentary structures.
Most washover fans generally form in a similar manner and therefore share physical and
biogenic sedimentary structures that may be grouped into active and passive phases of activity
(Deery and Howard, 1977). Active phase elements are created during the initial washover and as
a result are dominated by physical sedimentary structures with minimal biogenic structures and
modifications (Howard and Frey, 1980). Sub-horizontal stratification, consisting of parallel,
during maximum washover conditions. Ripple laminations form small-scale crossbedding
during low velocity flow regimes, foreset laminae form at the leading edge of the washover fans,
and trough crossbedding forms in washover channels. Passive phase structures form during
quiescent conditions, when wind and biologic activity are prevalent. Eolian dunes may form
with crossbeds and lamina angles up to 30°, at the backbeach to washover margin. Wind ripples,
less than 5 cm high, with more coarse grained materials in the crests, are also associated with
blowouts (typically less than 10 cm deep) resulting from wind erosion. Climbing ripple
laminations may also occur on the distal margins of the washover fan where thin veneers of loose
sand are eroded and re-deposited by significant rainfall and surface water runoff.
Stratigraphic models depicting the generalized facies associated with washover fans have
been produced for supratidal and microtidal settings (Figures 3-5a and 3-5b) and the preservation
potential of the facies has been evaluated in microtidal (Sedgewick and Davis, 2003) and
mesotidal settings (Deery and Howard, 1977). However, a stratigraphic model for washover fan
facies has not been developed for a mesotidal setting. Based on field observations and vibracore
samples collected under the current study, a general facies model for mesotidal washover fans
has been developed and refined under the current study (Figure 3-5c). A distinction is made in
this model for the mesotidal setting, where the distal edge or limits of the washover are
controlled by the height or elevation of the tide at the time of deposition. For example, a
washover emplaced in a mesotidal setting at a low tide stage will share many of the same
physical sedimentary structures with a microtidal washover fan. In contrast, microtidal washover
fans deposited at high tide stages are typically shorter with respect to their long axis than
Washover Washover
Washover Horizontal to very low
angle stratification
Horizontal to very low angle landward dipping stratification
Horizontal to very low
angle stratification older peat surfacepeat
Mesotidal Range Microtidal Range Supratidal Supratidal Setting Microtidal Setting Mesotidal Setting
Foresets t2
High angle foreset stratification Scour Zone Scour Zone Scour Zone Beach Beach Beach Foresets t1
tide @ t1
tide @ t2
a
b
c
Figure 3-5: Washover fan facies stratigraphic models (a) supratidal setting: (b) microtidal setting: f
lower tidal level (H O t ) at time t has influenced the location of foresets assoc. with versus a
higher tidal stage at time
planar-laminated sand
with no tidal influence, oreset laminae forming at distal/leading edge of
washover fan indicating moderate tidal influence, and c) mesotidal setting: due to the variable tidal levels, the facies and relationships are complicated versus the microtidal or supratidal setting. The tidal level influences the location of the distal edge of the washover fan under this scenario where
the t
(H O t ) t Model b) would also apply to the high marsh depositional
environment in a mesotidal setting. Models in a) and b) are adapted from Schwartz, 1975, and the stratigraphic model for the mesotidal setting (c) has been developed and tested/refined under the current study.
2 1 1 1
materials is also more likely due to the mesotidal setting and associated tidal range where the
reworking of sediments produces discontinuous peat surfaces.
3.4 Barrier Island Models - Response to Rising Sea Level
Barrier islands and associated depositional environments such as washover fans respond
to sea level in a manner similar to salt marshes or coral reefs. The three major responses are
designated as ‘catch up, keep up, and give up’ (Neumann and MacIntyre, 1985). The response of
the barrier island and washover fans is dependent on the rate of sediment supply and the nature
of sea level rise or the increase in accommodation space (Coe, 2005). Under conditions of sea
level rise and tectonic stability, there is an inclination for overwash conditions to dominate
unless vertical accretion balances or “keeps up” with the increase in sea level. When a low rate
of sea level rise is coupled with a low rate of sediment supply or conversely when a rapid rate of
sea level rise is associated with a high rate of sediment supply, the barrier island should sustain
itself and washover fans will produce the dominant facies associated within this setting (“keeps
up”). In contrast, a large sediment supply paired with a low rate of sea level rise will produce a
progradational barrier island system with significant eolian conditions driving dune
development. These dunes would produce a decrease in washover events and washover fan
deposition resulting in the “catch up” scenario. If a high rateof sea-level rise is accompanied by
a low rate of sediment supply, washover fan deposition lessens as inlets form, the barrier island
deteriorates (‘give up’) into swashover deposition and the island is overcome or submerged by
the rising sea level. By employing these models, the recognition of washover sequences in the
ancient rock record can provide insights into the relative nature of sea level rise and sediment