Copyright © 2002, American Society for Microbiology. All Rights Reserved.
Determining the Genomic Locations of Repetitive DNA Sequences
with a Whole-Genome Microarray: IS
6110
in
Mycobacterium tuberculosis
Mårten Kivi,
1† Xuemin Liu,
1‡ Soumya Raychaudhuri,
2Russ B. Altman,
2and Peter M. Small
1*
Division of Infectious Diseases and Geographic Medicine
1and Stanford Medical Informatics,
2Department of Medicine, Stanford University, Stanford, California 94305
Received 18 September 2001/Returned for modification 29 December 2001/Accepted 15 February 2002
The mycobacterial insertion sequence IS
6110
has been exploited extensively as a clonal marker in molecular
epidemiologic studies of tuberculosis. In addition, it has been hypothesized that this element is an important
driving force behind genotypic variability that may have phenotypic consequences. We present here a novel,
DNA microarray-based methodology, designated SiteMapping, that simultaneously maps the locations and
orientations of multiple copies of IS
6110
within the genome. To investigate the sensitivity, accuracy, and
limitations of the technique, it was applied to eight
Mycobacterium tuberculosis
strains for which complete or
partial IS
6110
insertion site information had been determined previously. SiteMapping correctly located 64%
(38 of 59) of the IS
6110
copies predicted by restriction fragment length polymorphism analysis. The technique
is highly specific; 97% of the predicted insertion sites were true insertions. Eight previously unknown insertions
were identified and confirmed by PCR or sequencing. The performance could be improved by modifications in
the experimental protocol and in the approach to data analysis. SiteMapping has general applicability and
demonstrates an expansion in the applications of microarrays that complements conventional approaches in
the study of genome architecture.
Insertion sequences (IS) are of considerable interest from
two perspectives. They can be viewed simply as “parasitic”
DNA (6), with their sole function being to maintain themselves
in the host genome. Alternately, they can be conceived of as
“evolution genes” (1), whose movements within the genome
alter gene function or mediate genomic rearrangements. Their
genomic location can both be a convenient marker for use in
molecular epidemiological studies and informative in studies
of gene function.
IS
6110
is the most extensively studied insertion sequence in
Mycobacterium tuberculosis
. Between 0 and 25 virtually
identi-cal copies are found in various genomic locations (20, 27, 32),
well suited for tracking the epidemiology of
M. tuberculosis
by
using restriction fragment length polymorphism (RFLP)
anal-ysis (13, 28). More precise IS
6110
insertion site mapping has
recently been introduced for typing bacterial isolates (26).
Evo-lutionary relationships have been suggested based on IS
6110
sites (11, 18), but the predisposition of IS
6110
to integrate in
certain genomic regions may limit some phylogenetic analyses
(10). IS
6110
is mobile and has been proposed to contribute to
genome plasticity in
M. tuberculosis
(25). Support for this
the-ory is its association with genome rearrangements (4, 7, 15, 17,
29). Further evidence includes the observation that 64% of
characterized IS
6110
insertions have been found to disrupt
coding regions (24). After the genome of the laboratory strain
H37Rv was sequenced, it was noted that 600 kb of the
chro-mosome, close to the origin of replication, lacked insertion
sequences, a finding indicative of selection against disruption
of this genome region (5, 12). Direct evidence for an
associa-tion between IS
6110
location and phenotype have been sought,
but not found, in the attenuated laboratory strain H37Ra (4)
and the virulent clinical strain 210 (2).
DNA microarrays provide an unprecedented opportunity
for high-throughput, whole-genome analysis of
microorgan-isms. To date, this technology has primarily been used for the
analysis of gene expression and genomic content. We describe
here a new application of microarrays, designated
SiteMap-ping, for determining the locations and orientations of IS
6110
within the
M. tuberculosis
genome. This technique has general
applicability for determining the locations of other DNA
se-quences within the genomes of sequenced organisms.
MATERIALS AND METHODS
SiteMapping.SiteMapping is based on the phenomenon that the probability of successful polymerase-mediated amplification decreases as the length of the desired product increases. Consequently, when a single primer is used for many polymerase extension cycles, a population of amplicons of different lengths is generated. In this population there will be a relative abundance of product corresponding to DNA sequence close to the primer (Fig. 1). When the popu-lation of amplicons is fluorescently labeled and hybridized to a whole-genome microarray there will be a characteristic pattern of hybridization, with the hy-bridization intensity decreasing as the spots represent sequences more distant from the primer. This can simultaneously occur multiple times, such that when the primer is directed toward repetitive DNA, such as IS6110, the characteristic pattern of hybridization will be seen in multiple regions of the microarray.
Bacterial strains and isolates.Eight M. tuberculosisstrains and isolates, three representing high-copy strains (11 to 18 IS6110RFLP bands) and five representing low-copy strains (1 to 5 IS6110RFLP bands), were included in this study (Table 1). In addition, the sequenced laboratory strain, H37Rv, was utilized as a “gold standard” for the development of experimental procedures and data analysis. For two of the test strains, CDC1551 and BCG Pasteur, all insertion sites were known CDC1551 genome sequencing project website (14;
* Corresponding author. Mailing address: Medical Center, Rm.
S-165, Stanford University, Stanford, CA 94305. Phone: (650)
725-7908. Fax: (650) 498-7011. E-mail: [email protected].
† Present address: Department of Medical Epidemiology,
Karolin-ska Institutet, 171 77 Stockholm, Sweden.
‡ Present address: Biorobotics, Woburn, MA 01801.
2192
on May 15, 2020 by guest
http://jcm.asm.org/
[http://www.sanger.ac.uk]). The six additional bacterial isolates had more or less complete insertion site information, as determined by other researchers (2, 11, 24). CDC1551 and H329 are different isolates of the same strain. The previously reported IS6110sites for the W strain were not characterized in the same isolate as that used here (TN565). However, because W-strain family members are considered to have a common origin and exhibit a characteristic RFLP pattern, the IS6110sites can be expected to be present principally in the same locations within the strain family.
Sample preparation.Culturing of the bacteria and DNA extraction were performed essentially as previously described (30). The IS6110flanking regions were labeled by incorporation of fluorescent dye in separate primer extension reactions with primers specific to the IS6110(accession number X17348) (27) 5⬘
(primer ISL1) and 3⬘ (primer XL103) ends (Table 2). The labeling reaction contained 4g of intact, genomic template DNA dissolved in distilled water; a 1M concentration of primer (Operon Technologies, Inc.); 88M concentra-tions of dATP, dCTP, and dGTP; 44M dTTP (Gibco-BRL); 44M Cy5-dUTP (Amersham Pharmacia Biotech); 10l of Q-Solution (Qiagen); 5 U ofTaq polymerase (Qiagen); 5l of 10⫻PCR buffer (Qiagen); and distilled water to a total volume of 50l. The GeneAmp PCR System 9700 thermal cycler was used with the following parameters: one cycle of 94°C for 5 min; 60 cycles of 94°C for 40 s, 56°C for 40 s, and 72°C for 75 s; and one final cycle of 72°C for 7 min. An additional 5 U of Taqpolymerase was added after 30 cycles. The reaction products were purified and concentrated with a Microcon YM-10 column (Ami-con) to a final hybridization volume of 30l containing 2⫻SSC (1⫻SSC is 0.15 M NaCl plus 0.015 M sodium citrate)–0.13% sodium dodecyl sulfate and 0.03g of tRNA/l.
Microarray hybridization.As previously described, the DNA microarray con-sisted of PCR products, within the open reading frames (ORFs) of H37Rv, robotically spotted on a poly-L-lysine-coated, glass microscope slide (3, 31). In
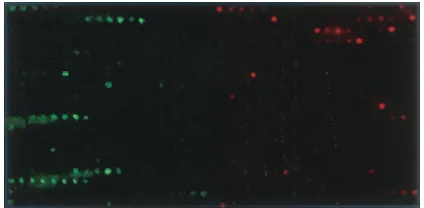
total there were 5,776 spots and, of the 3,924 ORFs in H37Rv, 3,777 (96%) were represented with good-quality amplicons. The spot amplicons were 200 to 1,000 bp long, with an average of 580 bp and, given the size of the H37Rv genome, occurred on average every 1.2 kb. The hybridizations took place under a 25- by 25-mm glass coverslip in a humidified chamber (Gene Machines) submerged in a 65°C water bath for 4 to 24 h. Slides were scanned for fluorescence in Scan-Array 5000 (GSI Lumonics), and the signal intensities were quantified with the Quantarray software (GSI Lumonics). Spots consisting of IS6110sequences were present on the microarray and used as positive controls. Because the majority of the spots were expected to be devoid of fluorescence, these were considered negative controls (Fig. 2). Eight hybridizations, four per IS6110side, were per-formed for each strain.
Data analysis.Hybridization intensity values were normalized, averaged, and plotted. For ORFs that were represented by multiple amplicons the spot with the highest intensity was evaluated, and spots derived from the two IS6110ORFs were excluded. Thus, for each experiment, 3,892 spots were analyzed. All mi-croarray data were normalized with the formula:xnorm⫽(x⫺mean)/variance. Raychaudhuri et al. developed software to predict the IS6110insertion sites (23). In brief, for each strain the hybridization data corresponding to the 5⬘and 3⬘
sides of IS6110were averaged together, respectively, to create 5⬘and 3⬘average profiles, including four downstream and two upstream intensities for each side of IS6110. Automatic classification algorithms were applied to compare the candi-date position profile to profiles obtained experimentally with H37Rv, including known insertion sites (positive training set) and noninsertion sites (negative training set).
The classification algorithm has been described previously (23) but was mod-ified. The method used here was a variant of the kernel-smoothing strategy. A pooled covariance matrix (S) was calculated from all of the ranked features of the positive and negative insertion site examples. Both populations were weighted equally. For each population (negative or positive), the multidimen-sional probability density was estimated by adding small, equally weighted Gauss-ian values centered at each training example point that was characterized by the pooled covariance matrix. If a profile,x, was assumed to be a positive case, its probability was calculated as follows: P(x|⫹)⫽1/n⫹⌺ie(x⫺xi)S⬘(x⫺xi)/2␣, where
n⫹is the number of positive examples andxiis a positive example. Setting the parameter␣at less than 1 slightly reduces the spread of the Gaussian value. For all computations presented here this parameter was set to 0.8. A similar equation may be written for the probability of a profile,x, assuming it is from the popu-lation of negative examples P(x|⫺).
For each candidate site, a score was calculated that reflected the probability that the site corresponded to a true insertion site. The score is the log of the positive probability divided by the negative probability: score(x)⫽log [P(x|⫹)/ P(x|⫺)]. The positions receiving high scores were predicted insertion sites, while those receiving low scores were predicted noninsertion sites. In addition to the computerized analysis, the positions that received high scores were plotted and inspected visually. A candidate insertion site was selected as a true insertion site only after we considered (i) the signal intensities, (ii) the occurrence of 5⬘
and 3⬘signals, (iii) the shape of the intensity pattern, (iv) the spot reliability for the genomic region (roughly assessed by prior knowledge of the local reliability of the microarray), and (v) an estimate of the number of IS6110copies in the strain based on the number of IS6110RFLP bands in the test strain’s RFLP genotype.
FIG. 1. SiteMapping can ascribe the genomic positions of
repeti-tive sequences, here demonstrated with IS
6110
in
M. tuberculosis
. The
IS
6110
(black box) flanking DNA is labeled by incorporation of
fluo-rescent dye in separate primer extension reactions with primers
spe-cific to the ends of IS
6110
. Sequences close to the primers are
ampli-fied more efficiently by the polymerase and thus are produced in
relative abundance. The amplicons are hybridized to the microarray,
which consists of PCR products amplified from the ORFs (gray boxes)
in the H37Rv genome. An IS
6110
insertion gives rise to a local,
char-acteristic hybridization intensity pattern, which can be interpreted as
an IS
6110
insertion at that location. The microarray spots and plotted
intensities in this figure are from the W strain TN565. The spots are
from two independent microarray hybridizations, and the plot is an
average of four hybridizations per IS
6110
side.
on May 15, 2020 by guest
http://jcm.asm.org/
Nomenclature.The insertion sites were positioned relative to the genome of H37Rv. All predicted ORFs in H37Rv have been assigned an Rv number. The IS6110locations were expressed by giving each insertion an Rv number, indi-cating that the insertion element’s 5⬘side is pointing toward this gene. The orientation was expressed as forward (F), with the 5⬘side in the same orientation as the H37Rv genome, or backward (B). With the current microarray’s genome coverage, in combination with the fact that the spot amplicons do not contain the full-length ORFs, the nomenclature does not contain information about inser-tions into specific ORFs. If an IS6110is assigned to an ORF in a forward orientation, the insertion could in reality occur within that ORF, in the intergenic region to the next downstream ORF, or in the downstream ORF before the sequence present on the microarray.
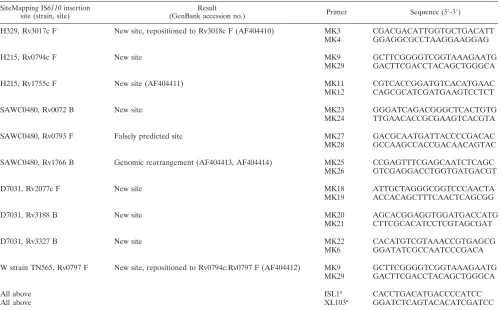
[image:3.587.47.537.84.204.2]Insertion site confirmation.IS6110insertion sites identified by SiteMapping that were not previously described were verified by PCR (PCR Kit [Qiagen] and ELONGASE Enzyme Mix [Gibco-BRL]) or sequencing (PAN Facility, Stanford University). Three PCRs were performed for each putative insertion site, as well as with H37Rv for comparison. Two primer pairs amplified the ends of IS6110 and flanking regions, while the third primer pair was positioned in the flanking regions, encompassing the IS6110copy (Table 2). An IS6110was considered to be present when the three products of expected sizes, as calculated from H37Rv, were obtained. When a conclusion could not be drawn from PCR, sequencing of an agarose gel-extracted (QIAquick Gel Extraction Kit [Qiagen]) PCR product was performed. The sequences were analyzed with The Sanger Centre’s BLAST service (http://www.sanger.ac.uk). The criterion for classifying an insertion as
TABLE 1. Bacterial strains and isolates and a summary of their IS
6110
insertion sites
Strain No. of ISbands6110RFLP No. of SiteMapping ISinsertion sites 6110 No. of previously identified ISinsertion sites 6110 No. of new, confirmed ISinsertion sites 6110
BCG Pasteur
1
1
1
0
H341
2
2
2
0
CDC1551
4
4
4
0
H329
4
4
3
1
H215
5
3
4
2
SAWC0480
11
5 (
⫹
1)
a8
1
D7031
14
10
12
3
W
18
9
19
1
Total
59
38 (
⫹
1)
a53
8
aFalsely predicted insertion site.
TABLE 2. IS
6110
insertion sites confirmed in this study
SiteMapping IS6110insertion
site (strain, site) (GenBank accession no.)Result Primer Sequence (5⬘-3⬘)
H329, Rv3017c F New site, repositioned to Rv3018c F (AF404410) MK3 CGACGACATTGGTGCTGACATT
MK4 GGAGGCGCCTAAGGAAGGAG
H215, Rv0794c F New site MK9 GCTTCGGGGTCGGTAAAGAATG
MK29 GACTTCGACCTACAGCTGGGCA
H215, Rv1755c F New site (AF404411) MK11 CGTCACCGGATGTCACATGAAC
MK12 CAGCGCATCGATGAAGTCCTCT
SAWC0480, Rv0072 B New site MK23 GGGATCAGACGGGCTCACTGTG
MK24 TTGAACACCGCGAAGTCACGTA
SAWC0480, Rv0793 F Falsely predicted site MK27 GACGCAATGATTACCCCGACAC
MK28 GCCAAGCCACCGACAACAGTAC
SAWC0480, Rv1766 B Genomic rearrangement (AF404413, AF404414) MK25 CCGAGTTTCGAGCAATCTCAGC
MK26 GTCGAGGACCTGGTGATGACGT
D7031, Rv2077c F New site MK18 ATTGCTAGGGCGGTCCCAACTA
MK19 ACCACAGCTTTCAACTCAGCGG
D7031, Rv3188 B New site MK20 AGCACGGAGGTGGATGACCATG
MK21 CTTCGCACATCCTCGTAGCGAT
D7031, Rv3327 B New site MK22 CACATGTCGTAAACCGTGAGCG
MK6 GGATATCGCCAATCCCGACA
W strain TN565, Rv0797 F New site, repositioned to Rv0794c:Rv0797 F (AF404412) MK9 GCTTCGGGGTCGGTAAAGAATG
MK29 GACTTCGACCTACAGCTGGGCA
All above ISL1a CACCTGACATGACCCCATCC
All above XL103a GGATCTCAGTACACATCGATCC
aISL1 and XL103 are specific to the 5⬘and 3⬘ends of IS6110respectively and were also used in the labeling of the IS6110flanking regions prior to microarray
hybridization.
on May 15, 2020 by guest
http://jcm.asm.org/
[image:3.587.43.544.400.710.2]present was to obtain a sequence containing both IS6110sequence and flanking genomic DNA mapping to the predicted location.
RESULTS
The SiteMapping method is contingent upon amplification
of sufficient sequence flanking each end of IS
6110
so that the
hybridization pattern is observed over several spots on the
microarray. The lengths of the labeled DNA fragments, as
observed in the signal intensity patterns, were up to 4 kb, which
is consistent with that observed after agarose gel
electrophore-sis (data not shown). The observed intensity patterns derived
from the IS
6110
insertion sites could be visually identified by
three characteristics, present to a variable degree: (i) a region
of signal intensity greater than that of the background, (ii)
colocalization of hybridization of both the 5
⬘
and 3
⬘
sides of
IS
6110
, and (iii) a characteristic crescendo-decrescendo shape
to the intensity pattern (Fig. 1). To obtain a more objective and
rapid analysis procedure, software was developed to assist in
locating the insertion sites.
When the products were hybridized to the microarray and
the resulting hybridization patterns were analyzed, a total of 39
insertion sites were identified in eight
M. tuberculosis
strains
and isolates examined. Of the 39 identified sites, 38 were
deemed correct after comparison with other researchers’
re-sults or by confirmation by PCR or sequencing. Given that only
one putative insertion site (SAWC0480 [Rv0793 F]) did not
actually exist, 97% (38 of 39) of the putative insertions were
true insertions. Because all of the IS
6110
insertion sites were
not known a priori for each strain, the precise sensitivity of the
method for identifying sites can only be roughly estimated. If
one assumes that each IS
6110
hybridizing band in the RFLP
patterns (
n
⫽
59) reflects a unique copy of IS
6110
, this
indi-cates a sensitivity of 64% (38 of 59). When insertions were not
identified it could be ascribed either to a total or a partial
absence of signal or to a signal pattern not recognized by the
computer program. The results are summarized in Table 1 and
are detailed in Table 3.
Previously unknown insertion sites were confirmed by PCR
or sequencing, and in this way eight new sites were identified
(Table 2). Of the eight sites, five exhibited the three
antici-pated PCR products of expected sizes when they were
sub-jected to PCR confirmation (data not shown). For one site
[image:4.587.57.269.72.176.2]FIG. 2. Two microarray hybridization images with products
ampli-fied from the IS
6110
5
⬘
(right) and 3
⬘
(left) ends. For clarity, only 1/16
of the microarray is depicted. Spots consisting of IS
6110
sequences
were used as positive controls and excluded from the analysis. The
majority of the spots were expected to be devoid of fluorescence and
were considered negative controls.
TABLE 3. IS
6110
insertion sites in the examined
strains and isolates
Strain IS6110insertion sites identified by: SiteMapping Conventional methodsb
BCG Pasteur Rv2816c B DR
H341 Rv0403c B Rv0403c
Rv2816c B DR
CDC1551 Rv0403c B Rv0403c
Rv1758 B Rv1758
Rv2816c B DR
Rv3017c F Rv3018c
H329 Rv0403c B Rv0403c
Rv1758 B Rv1758
Rv2816c B DR
Rv3017c F Rv3018c Fa
H215 Rv0794c F Rv0794c Fa
Rv1755c F Rv1755c Fa
Rv2809 B Rv2808
Poor signal Rv3324c Poor signal Rv3327
Does not map to H37Rv SAWC0480 Rv0072 B Rv0072 Ba
Rv0793 F No insertion sitea
Signal present Rv1664 Rv1766 Ba, genomic
rearrangementa Rv1755c/Rv1766 B a
Poor signal Rv1917c
Rv2816c B DR
Neighboring insertion DR Rv2818c F Rv2818c Rv3125c F Rv3125c Poor signal Rv3327 D7031 Rv0836c B Rv0835:Rv0836
No signal Rv1319c
Rv1755c B Rv1754
Poor signal, neighboring
insertion Rv1758 Rv1765c F Rv1765c:Rv1766
Rv1777 B Rv1777
Rv2015c B Rv2015c Rv2077c F Rv2077c Fa
Signal present, neighboring
insertion Rv2352 Signal present, neighboring
insertion Rv2353
Rv2816c B DR
Rv3113 F Rv3113
Rv3188 B Rv3188 Ba
Rv3327 B Rv3327 Ba
Does not map to H37Rv W strain Rv0001 F Rv0001:Rv0002
Rv0797 F Rv0794c:Rv0797 Fa
Signal present Rv1135c
Rv1371 B Rv1371
Poor signal Rv1469 Rv1755c B Rv1754c Poor signal Rv1917c Signal present Rv2016 Poor signal Rv2104c:Rv2107 Poor signal Rv2352c Signal present, genomic
rearrangement Rv2813:Rv2820c, Deletion Rv3019c F Rv3018c:Rv3019c Neighboring insertion Rv3019c:Rv3020c Neighboring insertion Rv3128c Rv3129 B Rv3128c:Rv3129 Rv3180c B Rv3179:Rv3180c Poor signal Rv3326:Rv3327 Rv3382c F Rv3383c Rv3428c B Rv3427c:Rv3428c
Does not map to H37Rv
aConfirmed in this study. bDR, direct repeat.
on May 15, 2020 by guest
http://jcm.asm.org/
(D7031 [Rv3327 B]) the sizes of the three PCR products were
a few hundred base pairs larger than those predicted from the
sequenced laboratory strain H37Rv. The site was still regarded
as confirmed because the products were in fact present and
because some differences in genomic sequence between
H37Rv and other isolates can be expected. Two sites (H329
[Rv3017c F] and H215 [Rv1755c F]) exhibited only one PCR
product of the expected size, and these sites were confirmed
with sequencing of the obtained product. For two of the sites
that were identified, the precise locations (as determined by
sequencing of the PCR products) were found to be in regions
adjacent to those predicted from the signal patterns. One
(H329 [Rv3017c F]) was found to interrupt the next,
down-stream gene (Rv3018c) rather than the gene to which the
insertion had been assigned by SiteMapping. The insertion
occurred at a site before the sequence spotted on the
microar-ray and hence could not be ascribed to its precise genomic
location from the signal intensity pattern. The second site that
was repositioned after sequencing (W strain TN565 [Rv0797
F]) was found to be located in an intergenic region two ORFs
upstream from the predicted site (the two ORFs were not
included in the analysis because they correspond to IS
6110
in
H37Rv). When the insertion sites predicted by SiteMapping
are compared to the sequencing results the match is not
per-fect due to the limited resolution of SiteMapping and the
nomenclature of identified insertion sites. The insertion site
designations given here should not be interpreted as insertions
into specific ORFs.
When the signal intensity pattern for one potential insertion
site (SAWC0480 [Rv1766 B]) was inspected visually, a
hybrid-ization pattern was discovered which exhibited 5
⬘
and 3
⬘
signals
separated by a region of approximately 12 kb without signal.
The IS
6110
flanking regions were sequenced and mapped to
positions 1987455 and 1998847 in H37Rv, which corresponds
perfectly to what had been predicted from the plotted spot
signal intensities. The 3- to 4-bp direct repeats flanking IS
6110
were not present. This suggests that homologous
recombina-tion between two IS
6110
copies with different direct repeats
has taken place (19). The analysis demonstrates that in this
strain, IS
6110
has replaced or interrupted ORFs Rv1755c to
Rv1765c found in H37Rv.
DISCUSSION
Both PCR- and hybridization-based approaches have been
used to identify the genomic locations of repetitive sequences
within the genome of an organism. PCR strategies used to
amplify the DNA flanking a known element have common
features consisting of linker ligation, circularization of the
tar-get DNA, or the use of random primers (16). Once amplified,
the products can be sequenced and the genomic location can
be deduced. An attractive aspect of these PCR procedures is
that they can be performed on very small quantities of genomic
DNA. However, these approaches are laborious, in part
be-cause they cannot simultaneously explore multiple sites. A
recently described membrane hybridization technique can
con-currently seek the locations of multiple insertion sites but is
restricted to specific, previously identified sites (26).
In contrast to other methods, the SiteMapping methodology
described here can simultaneously deduce the genomic
loca-tions of multiple, previously unidentified insertion sites. To
determine the performance and limitations of this technique,
the IS
6110
locations in eight strains and isolates of
M.
tuber-culosis
were investigated. After comparison with results
ob-tained by more conventional methods, 97% (38 of 39) of
pre-dicted insertions were true insertions. Because the exact
IS
6110
copy numbers were not known for six of the isolates in
this study, the sensitivity of SiteMapping can only be roughly
estimated. By assuming that the number of IS
6110
hybridizing
RFLP bands approximates the number of IS
6110
copies, the
sensitivity is estimated to be 64% (38 of 59). The sensitivity
estimation is limited by this assumption. A discrepancy
be-tween the number of IS
6110
hybridizing bands and the IS
6110
copy number can be explained by an inherent limitation in the
resolution of the RFLP technique or comigration of IS
6110
hybridizing fragments. In addition, two IS
6110
copies appear
as one RFLP band when the elements are facing outward in
different orientations without an intervening restriction site.
This view is supported by the observation that for three strains
included in this study the total number of insertion sites
pre-dicted here and by others exceeds the number of RFLP bands.
Thus, it is likely that the IS
6110
copy number has been
under-estimated, and the actual sensitivity of the technique described
here may be less than 64%.
The performance of SiteMapping is currently limited by the
size of the labeled fragments, the microarray coverage of the
genome, and the analytical approach to data analysis—all of
which can be improved. Increasing the size of the labeled
fragments improves the likelihood of identifying an insertion
site, particularly when the microarray has a relatively sparse
genomic coverage. The completeness of the microarray’s
cov-erage of the genome will impact its sensitivity and also its
resolving power. The latter is critical in studies of integration
into specific ORFs and when neighboring insertions must be
distinguished. Two or more directly repeating insertions
lo-cated closer to each other than the spots on the microarray will
be interpreted as a single insertion. The current analytical
approach was not designed to detect pairs of inversely oriented
insertions, since the hybridization intensity profile differed
from that we sought. The computerized recognition of atypical
signal patterns can be improved either with more training
examples or by the addition of ad hoc algorithms. At least four
instances were encountered where neighboring insertions
could not be detected. This limitation is particularly
problem-atic since there is strong evidence that multiple copies of
IS
6110
frequently occur in certain regions of the genome (9,
14, 18, 21, 22, 24).
Another surmountable problem is the identification of
in-sertion locations in the context of other repeated sequences in
a genome. For example, there are two copies of IS
1547
(also
known as the IS
6110
preferential locus,
ipl
) present in the
genome of H37Rv (8–10). The two locations of IS
1547
have to
be differentiated by obtaining a flanking genomic sequence
that extends beyond this repetitive DNA, a requirement not
always fulfilled in the literature. Similarly, the existence of
repetitive DNA poses challenges to SiteMapping.
Cross-hy-bridization between the amplified DNA and homologous
mi-croarray spots contributed to the false assertion that there was
an IS
6110
insertion in both copies of IS
1547
when in fact it was
only present in one. Furthermore, certain repetitive genomic
on May 15, 2020 by guest
http://jcm.asm.org/
regions, such as the PE and PPE gene families, are difficult to
amplify using PCR. This could result in poor-quality spots on
the microarray or inefficient labeling of the IS
6110
flanking
regions. SiteMapping failed to identify insertions into Rv1917c
(this and an adjacent gene are PPE genes) in two strains
because of poor signal intensity patterns. However, the ability
of SiteMapping to locate insertions in the vicinity of other PE
and PPE genes suggests that refinements in the protocol and
microarray can decrease this problem.
Some of the problems identified in this study are not easily
remediable and will limit the performance of SiteMapping.
SiteMapping is unable to identify insertions into genomic
re-gions that are not present on the microarray, either because
they are not present in H37Rv or have been mutated beyond
recognition. There were three instances in which insertion sites
were not identified because the IS
6110
flanking sequences
correspond to DNA that does not map to H37Rv. In addition,
a previously described genomic rearrangement of the W strain
(2) obscured an insertion site in the direct repeat region.
SiteMapping discovered another genomic rearrangement
en-compassing Rv1755c to Rv1765c in the strain SAWC0480. The
absence of direct repeats flanking the IS
6110
suggests an
IS
6110
-mediated homologous recombination mechanism (19).
This region has been reported to have a high incidence of
IS
6110
insertions (12, 24) and to be highly variable in 22
clinical isolates (15). The limitation of SiteMapping due to
insertion site deletions or rearrangements is particularly
sig-nificant given that insertion sequences may be mechanistically
associated with these rearrangements.
Despite these limitations, the relative ease with which
SiteMapping can generate data and its generalizability to other
organisms suggests that it may be a useful tool for
understand-ing the biology of insertion sequences and gene function. A
description of the genomic distribution of insertion sequences
in well-sampled natural populations of bacteria may provide
insights into the determinants and mechanisms of insertional
transposition. Alternately, correlating the genomic locations of
IS
6110
with bacterial behavior in human populations among
large collections of well-characterized clinical isolates may
dis-tinguish essential from nonessential genes and suggest gene
function. It is also possible that SiteMapping can be applied to
screen pools of bacteria, for example, to screen transposon or
saturation mutagenesis libraries for “hot” and “cold” spots of
integration. Finally, although we have described its use for
seeking IS
6110
in
M. tuberculosis
, the basic approach can be
adapted to determine the genomic locations of virtually any
conserved repetitive sequence in any sequenced organism.
ACKNOWLEDGMENTS
This work was supported by a supplement to NIAID grant AI35969,
the Burroughs-Wellcome Fund, and NIH grants GM-61374,
LM-06422, GM-07365, and NSF DBI-9600637.
We thank M. Donald Cave (Central Arkansas Veterans Healthcare
System, Little Rock, Ark.), Paul D. van Helden (University of
Stellen-bosch, Tygerberg, South Africa), and Barry N. Kreiswirth (Public
Health Research Institute, New York, N.Y.), for providing bacterial
isolates. The microarrays were manufactured in cooperation with the
members of Gary K. Schoolnik’s lab at Stanford University and
Tamara van Gorkom assisted in the PCR confirmation.
REFERENCES
1.Arber, W.2000. Genetic variation: molecular mechanisms and impact on microbial evolution. FEMS Microbiol. Rev.24:1–7.
2.Beggs, M. L., K. D. Eisenach, and M. D. Cave.2000. Mapping of IS6110 insertion sites in two epidemic strains ofMycobacterium tuberculosis. J. Clin. Microbiol.38:2923–2928.
3.Behr, M. A., M. A. Wilson, W. P. Gill, H. Salomon, G. K. Scoolnik, S. Rane, and P. M. Small.1999. Comparative genomics of BCG vaccines by whole-genome DNA microarray. Science284:1520–1523.
4.Brosch, R., W. J. Philipp, E. Stavropoulos, M. J. Colston, S. T. Cole, and S. V. Gordon.1999. Genomic analysis reveals variation between Mycobacte-rium tuberculosisH37Rv and the attenuatedM. tuberculosisH37Ra strain. Infect. Immun.67:5768–5774.
5.Cole, S. T., R. Brosch, J. Parkhill, T. Garnier, C. Churcher, D. Harris, et al.
1998. Deciphering the biology ofMycobacterium tuberculosisfrom the com-plete genome sequence. Nature393:537–544.
6.Doolittle, W. F., and C. Sapienza.1980. Selfish genes, the phenotype para-digm and genome evolution. Nature284:601–603.
7.Fang, Z., C. Doig, D. T. Kenna, N. Smittipat, P. Palittapongarnpim, B. Watt, and K. J. Forbes.1999. IS6110-mediated deletions of wild-type chromo-somes ofMycobacterium tuberculosis. J. Bacteriol.181:1014–1020. 8.Fang, Z., C. Doig, N. Morrison, B. Watt, and K. J. Forbes.1999.
Charac-terization of IS1547, a new member of the IS900family in theMycobacterium tuberculosiscomplex, and its association with IS6110. J. Bacteriol.181:1021– 1024.
9.Fang, Z., and K. J. Forbes. 1997. AMycobacterium tuberculosis IS6110 preferential locus (ipl) for insertion into the genome. J. Clin. Microbiol.
35:479–481.
10.Fang, Z., D. T. Kenna, C. Doig, D. N. Smittipat, P. Palittapongarnpim, B. Watt, and K. J. Forbes.2001. Molecular evidence for independent occur-rence of IS6110insertions at the same sites of the genome ofMycobacterium tuberculosisin different clinical isolates. J. Bacteriol.183:5279–5284. 11.Fomukong, N., M. Beggs, H. El Hajj, G. Templeton, K. Eisenach, and M. D.
Cave.1997. Differences in the prevalence of IS6110insertion sites in Myco-bacterium tuberculosisstrains: low and high copy number of IS6110. Tuberc. Lung Dis.78:109–116.
12.Gordon, S. V., B. Heym, J. Parkhill, B. Barrell, and S. T. Cole.1999. New insertion sequences and a novel repeated sequence in the genome of Myco-bacterium tuberculosisH37Rv. Microbiology145:881–892.
13.Hermans, P. W., D. van Soolingen, J. W. Dale, A. R. Schuitema, R. A. McAdam, D. Catty, and J. D. van Embden.1990. Insertion element IS986 fromMycobacterium tuberculosis: a useful tool for diagnosis and epidemiol-ogy of tuberculosis. J. Clin. Microbiol.28:2051–2058.
14.Hermans, P. W., D. van Soolingen, E. M. Bik, P. E. de Haas, J. W. Dale, and J. D. van Embden.1991. Insertion element IS987fromMycobacterium bovis BCG is located in a hot-spot integration region for insertion elements in Mycobacterium tuberculosiscomplex strains. Infect. Immun.59:2695–2705. 15.Ho, T. B., B. D. Robertson, G. M. Taylor, R. J. Shaw, and D. B. Young.2000.
Comparison ofMycobacterium tuberculosisgenomes reveals frequent dele-tions in a 20-kb variable region in clinical isolates. Yeast17:272–282. 16.Hui, E. K., P. C. Wang, and S. J. Lo.1998. Strategies for cloning unknown
cellular flanking DNA sequences from foreign integrants. Cell. Mol. Life Sci.
54:1403–1411.
17.Kato-Maeda, J. T. M., Rhee, T. R. Gingeras, H. Salamon, J. Drenkow, N. Smittipat, and P. M. Small.2001. Comparing genomes within the species Mycobacterium tuberculosis. Genome Res.11:547–554.
18.Kurepina, N. E., S. Sreevatsan, B. B. Plikaytis, P. J. Bifani, N. D. Connell, R. J. Donnelly, D. van Soolingen, J. M. Musser, and B. N. Kreiswirth.1998. Characterization of the phylogenetic distribution and chromosomal insertion sites of five IS6110elements inMycobacterium tuberculosis: non-random integration in thednaA-dnaNregion. Tuberc. Lung Dis.79:31–42. 19.Mahillon, J., and M. Chandler.1998. Insertion sequences. Microbiol. Mol.
Biol. Rev.62:725–774.
20.McAdam, R. A., P. W. Hermans, D. van Soolingen, Z. F. Zainuddin, D. Catty, J. D. van Embden, and J. W. Dale. 1990. Characterization of a Mycobacterium tuberculosisinsertion sequence belonging to the IS3family. Mol. Microbiol.4:1607–1613.
21.McHugh, T. D., and S. H. Gillespie.1998. Nonrandom association of IS6110 andMycobacterium tuberculosis: implications for molecular epidemiologic studies. J. Clin. Microbiol.36:1410–1413.
22.Philipp, W. J., S. Poulet, K. Eiglmeier, L. Pascopella, V. Balasubramanian, B. Heym, S. Bergh, B. R. Bloom, W. R. Jacobs, Jr., and S. T. Cole.1996. An integrated map of the genome of the tubercle bacillus,Mycobacterium tuber-culosisH37Rv, and comparison withMycobacterium leprae. Proc. Natl. Acad. Sci. USA93:3132–3137.
23.Raychaudhuri, S., J. M. Stuart, X. Liu, P. M. Small, and R. B. Altman.2000. Pattern recognition of genomic features with microarrays: site typing of Mycobacterium tuberculosisstrains. Proc. Int. Conf. Intell. Syst. Mol. Biol.
8:286–295.
24.Sampson, S. L., R. M. Warren, M. Richardson, G. D. van der Spuy, and P. D.
on May 15, 2020 by guest
http://jcm.asm.org/
van Helden.1999. Disruption of coding regions by IS6110insertion in My-cobacterium tuberculosis. Tuberc. Lung Dis.79:349–359.
25.Sreevatsan, S., X. Pan, K. E. Stockbauer, N. D. Connell, B. N. Kreiswirth, T. S. Whittam, and J. M. Musser.1997. Restricted structural gene polymor-phism in theMycobacterium tuberculosiscomplex indicates evolutionary re-cent global dissemination. Proc. Natl. Acad. Sci. USA94:9869–9874. 26.Steinlein, L. M., and J. T. Crawford.2001. Reverse dot blot assay (insertion
site typing) for precise detection of sites of IS6110insertion in the Mycobac-terium tuberculosisgenome. J. Clin. Microbiol.39:871–878.
27.Thierry, M. D. D., Cave, K. D. Eisenach, J. T. Crawford, J. H. Bates, B. Gicquel, and J. L. Guesdon.1990. IS6110, an IS-like element of Mycobac-terium tuberculosiscomplex. Nucleic Acids Res.18:188.
28.van Embden, J. D., M. D. Cave, J. T. Crawford, J. W. Dale, K. D. Eisenach, B. Gicquel, P. Hermans, C. Martin, R. McAdam, T. M. Shinnick, and P. M. Small.1993. Strain identification of Mycobacterium tuberculosisby DNA fingerprinting: recommendations for a standardized methodology. J. Clin. Microbiol.31:406–409.
29.van Embden, J. D., T. van Gorkom, K. Kremer, R. Jansen, B. A. van der Zeijst, and L. M. Schouls.2000. Genetic variation and evolutionary origin of the direct repeat locus ofMycobacterium tuberculosiscomplex bacteria. J. Bacteriol.182:2393–2401.
30.van Soolingen, D., P. W. Hermans, P. E. de Haas, D. R. Soll, and J. D. van Embden.1991. Occurrence and stability of insertion sequences in Mycobac-terium tuberculosiscomplex: evaluation of an insertion sequence-dependent DNA polymorphism as a tool in the epidemiology of tuberculosis. J. Clin. Microbiol.29:2578–2586.
31.Wilson, M., J. DeRisi, H. Kristensen, P. Imboden, S. Rane, P. O. Brown, and G. K. Schoolnik.1999. Exploring drug-induced alterations in gene expression inMycobacterium tuberculosisby microarray hybridization. Proc. Natl. Acad. Sci. USA96:12833–12838.
32.Zainuddin, Z. F., and J. W. Dale.1989. Polymorphic repetitive DNA se-quences inMycobacterium tuberculosisdetected with a gene probe from a Mycobacterium fortuitumplasmid. J. Gen. Microbiol.135:2347–2355.