Copyright © 2000, American Society for Microbiology. All Rights Reserved.
Technical Assessment of the Affymetrix Yeast Expression GeneChip
YE6100 Platform in a Heterologous Model of Genes That
Confer Resistance to Antimalarial Drugs in Yeast
MARTIN E. NAU,1LYNDAL R. EMERSON,2RODGER K. MARTIN,3DENNIS E. KYLE,3DYANN F. WIRTH,2ANDMARYANNE VAHEY4*
Henry M. Jackson Foundation for the Advancement of Military Medicine, Rockville, Maryland1; Department of Immunology and Infectious Diseases, Harvard School of Public Health, Boston, Massachusetts2; and Division of
Experimental Therapeutics3and Division of Retrovirology,4Walter Reed Army Institute of Research, Washington, D.C.
Received 4 January 2000/Returned for modification 17 February 2000/Accepted 24 February 2000
The advent of high-density gene array technology has revolutionized approaches to drug design, develop-ment, and characterization. At the laboratory level, the efficient, consistent, and dependable exploitation of this complex technology requires the stringent standardization of protocols and data analysis platforms. The Affymetrix YE6100 expression GeneChip platform was evaluated for its performance in the analysis of both global (6,000 yeast genes) and targeted (three pleiotropic multidrug resistance genes of the ATP binding cassette transporter family) gene expression in a heterologous yeast model system in the presence and absence of the antimalarial drug chloroquine. Critical to the generation of consistent data from this platform are issues involving the preparation of the specimen, use of appropriate controls, accurate assessment of experiment variance, strict adherence to optimized enzymatic and hybridization protocols, and use of sophisticated bioinformatics tools for data analysis.
A universal challenge to drug therapy is the development of drug resistance. Efforts to understand the molecular mecha-nisms of the emergence of resistance to drugs span the fields of infectious disease, cancer, and toxicology. The eventuality of drug resistance necessitates the ongoing development of new drugs and interventions. A decade of research has identified a class of genes associated with multidrug resistance (8, 9).
The multidrug resistance genes (mdrgenes) are part of the ATP binding cassette (ABC) transporter genes in mammalian cells (4, 7, 10). To facilitate the detection of drug resistance and to expedite the development of new drugs, several in vitro model systems have been developed that examine the activity ofmdrand ABC transporters. One such system is the heter-ologous yeast model in which the genesPDR5, PDR10, and SNQ2, members of the pleiotropic drug resistance (pdr) family in yeast, have been associated with drug resistance (2, 9, 10, 15, 16, 17, 18). Observations that there may be 30 or more genes in yeast that are related by sequence homology to the ABC transporter gene family complicate the association of drug resistance with a particular gene (3). TheSaccharomyces cer-evisiae genome sequencing project revealed 31 ABC genes, which have been classified into six distinct subfamilies based on phylogenetic analysis (3, 7, 14, 19, 20). Thepdrfamily is the largest of these subgroups, with 10 members. In total there are 12 ABC genes that have been associated with modulation of resistance to xenobiotics to date. The PDR5 gene has been linked to resistance to cycloheximide, mycotoxins, and cerule-nin, and its product has been found to transport glucocorti-coids (2, 3, 4, 10, 13). A second member of the pdr group, SNQ2, has been found to be linked to resistance to 4-nitroso-quinoline-N-oxide, methyl-nitro-nitrosoguanidine, and metal
ions such as Na⫹, Li⫹, and Mn⫹(3, 16, 18). The⌬snq2⌬pdr5
deletion strain exhibits a more pronounced sensitivity to metal ions and other drug substrates (3).PDR10is closely related to PDR5(65% sequence identity); however, the functional relat-edness of these genes remains to be determined. Interestingly, PDR10has been found to localize to the cell surface likePDR5 andSNQ2(3, 9).
With the introduction of the Affymetrix yeast expression GeneChip YE6100 platform (YE6100 platform), it has be-come feasible to plan experiments to simultaneously assess the changes in the expression patterns of not only the pleiotropic drug resistance gene family but also 6,000 yeast genes (5). Previously, Wodicka et al., at Affymetrix, characterized the basic performance characteristics of a prototype for the YE6100 platform to generate a global survey of 6,000 yeast genes (22). This platform was refined and exploited by Cho et al. to survey the complete yeast genome (6). Holstege et al., using an elegant battery of controls, exploited the commer-cially available YE6100 platform to assess the transcriptional control of yeast cell division (11). Winzeler et al. used a cus-tomized gene array platform for direct allelic scanning of the entire yeast genome (21).
To test the practical potential of the commercially available YE6100 platform to address drug resistance, a well-defined heterologous yeast model system was chosen. The expression profiles of two strains ofS. cerevisiae were evaluated in the presence and absence of the antimalarial drug chloroquine. Strain YPH 499 (499) is wild type and refractory to the drug chloroquine. Strain YHW 1052 (1052) is a mutant with dele-tions in thePDR5,PDR10, andSNQ2genes and is thus more susceptible to chloroquine. The aim of this paper is to detail the technical aspects of the utilization of the YE6100 platform that are critical to the generation of consistent and reliable gene expression data in the study of drug resistance. The im-plementation of the methods and protocols presented in this paper will facilitate more intensive efforts to elucidate the * Corresponding author. Mailing address: Gene Array Laboratory,
Walter Reed Army Institute of Research, 1600 East Gude Dr., Rock-ville, MD 20850. Phone: (301) 251-5058. Fax: (301) 762-7460. E-mail: mvahey@pasteur.hjf.org.
1901
on May 15, 2020 by guest
http://jcm.asm.org/
details of the molecular interactions involved in the emergence of drug resistance. Two levels of data analysis, the global as-sessment of functional gene families and the targeted assess-ment of particular genes, will be addressed to demonstrate the type of information gleaned from each.
MATERIALS AND METHODS
Strains and media.The strains, 1052 and 499, used in this study were the kind gifts of Karl Kuchler of The University and Biocenter of Vienna, Vienna, Aus-tria. The yeast strain 1052 (⌬pdr5::TR1⌬snq2::hisG⌬pdr10::hisG) was utilized for this study along with its isogenic parental strain 499 (MATa ade2-101cc
his3⌬200 leu2-⌬1 lys2-801amtrp1-⌬1 ura3-52). Strain 1052 is deficient in three ABC transporters encoded in thepdrpathway (PDR5,PDR10, andSNQ2). In strain 1052, the deletion inPDR5is from nucleotide (nt)⫹399 through nt⫹4456. The deletion inPDR10is from nt⫺90 through nt⫹4307. The deletion inSNQ2
is from nt⫺6 through nt⫹3899. The 50% inhibitory concentrations of the drug chloroquine are 127 mg/ml for 499 and 50.00 mg/ml for 1052 as determined in nonaerated liquid medium and in solid medium culture. In liquid culture the 50% inhibitory concentrations of the drug chloroquine are 4.75⫾0.75 mg/ml for 499 and 1.38⫾0.13 mg/ml for 1052. Starter cultures were taken from colonies lifted from freshly streaked agar plates and grown overnight (to confluence at 2⫻108cells/ml) at 30°C and 300 rpm in 5 to 10 ml of yeast-peptone-dextrose
medium. The 5- to 10-ml starter cultures were diluted into 1,200 ml of pre-warmed and aerated yeast-peptone-dextrose medium in a 4-liter flask to a den-sity of 1.5⫻106cells/ml. Cultures were grown at 30°C and 300 rpm for 2 h or
until the cell density reached 3.0⫻106cells/ml. At this juncture the culture was
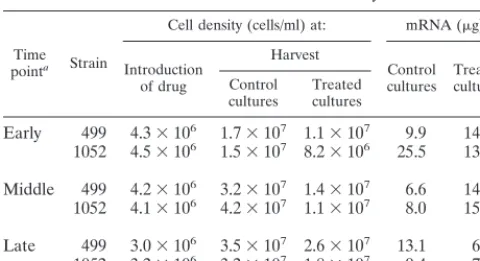
split into two 600-ml aliquots in two prewarmed 2-liter flasks. Chloroquine was added to the treatment flask to a concentration of 1.5 or 2.5 mg/ml from a 200-mg/ml concentrated stock of chloroquine diphosphate salt (Sigma, St. Louis, Mo.) dissolved in sterile double-distilled water. This solution had a pH of ap-proximately 4.0. An exact volume of sterile double-distilled water, adjusted to the pH of the chloroquine solution, was added to the control flask. Table 1 shows the cell densities from critical points in the growth and treatment of the cultures used in the study. The assay points in the study are defined as early (2 h with or without 1.5 mg of drug per ml), middle (3 h, with or without 2.5 mg of drug per ml), and late (4.5 h, with or without 2.5 mg of drug per ml).
Cell harvesting and preparation of poly(A) RNA.Cultures were harvested identically at three time points: 2, 3, and 4.5 h. It is imperative that all cultures be treated exactly the same during the harvesting procedure. The overnight yeast culture was dispensed into 12 50-ml polypropylene conical tubes (Falcon/Becton Dickinson Labware, Franklin Lakes, N.J.) and centrifuged in a clinical centrifuge for 5 min at 4°C and at 2,000⫻g. The pellet was resuspended in 5 ml of Tri-Reagent (Molecular Research Center, Woodlands, Tex.), and an equal vol-ume of 400-m-diameter acid-washed glass beads was added. The mixture was vortexed for 1 min. An additional 20 ml of Tri-Reagent was added to the mixture, and the manufacturer’s instructions for the preparation of total RNA were followed. Poly(A) RNA (mRNA) was prepared from total RNA using the Oli-gotex (Qiagen, Valencia, Calif.) method according to the manufacturer’s instruc-tions.
cDNA synthesis.Double-stranded cDNA was synthesized in two steps using the Superscript Choice System (GibcoBRL, Rockville, Md.) and the reverse transcription primer T7-(dt)24[5⬘GGCCAGTGAATTGTAATACGACTCACT
ATAGGGAGGCGG(T)243⬘] (GENSET Corp., LaJolla, Calif.). First-strand
synthesis was carried out in a 20-l reaction mixture. Approximately 3.0g of mRNA was annealed to 7g of T7-(dt)24primer at 70°C for 10 min. Reverse
transcription was carried out at 37°C for 1 h in a mixture with final concentrations of 50 mM Tris-HCl (pH 8.3), 75 mM KCl, 3 mM MgCl2, 10 mM dithiothreitol,
500M each dATP, dCTP, dGTP, and dTTP, and 20,000 to 30,000 U of Superscript II reverse transcriptase per ml, and the reaction was terminated by placing the tube on ice. Second-strand synthesis was carried out in 150l, incorporating the entire 20-l first-strand reaction mixture and a 130-l second-strand reaction mixture for final concentrations of 25 mM Tris-HCl (pH 7.5), 100 mM KCl, 5 mM MgCl2, 10 mM (NH4)2SO4, 0.15 mM-NAD⫹, 250M each
dATP, dCTP, dGTP, and dTTP, 1.2 mM dithiothreitol, 65 U of DNA ligase per ml, 250 U of DNA polymerase I per ml, and 13 U of RNase H per ml. The mixture was incubated at 16°C for 2 h, whereupon 2l of T4 DNA polymerase at 5 U/l was added and the incubation was continued at 16°C for 5 min. To terminate the reaction, 10l of 0.5 M EDTA was added. The cDNA was purified using phenol-chloroform-isoamyl alcohol (24:23:1) saturated with 10 mM Tris-HCl (pH 8.0)–1 mM EDTA (AMBION, Inc., Austin, Tex.). The purified cDNA was precipitated with 5 M ammonium acetate and absolute ethanol at⫺20°C for 20 min. The pellet was resuspended in 7 to 9l of RNase-free water to achieve a final concentration of between 0.25 and 0.65g/l.
In vitro transcription and fluorescent labeling.Synthesis of biotin-labeled cRNA was carried out by in vitro transcription using the MEGAscript T7In Vitro
Transcription Kit (AMBION, Inc.). According to the manufacturer’s instruc-tions, 0.4 to 1.0g of double-stranded cDNA was placed in a 20-l reaction mix, at room temperature, containing Ambion 1⫻reaction buffer and enzyme mix (proprietary). The labeling mix consisted of 7.5 mM ATP, 7.5 mM GTP, 5.6 mM UTP, 1.9 mM biotinylated UTP (ENZO Diagnostics, Farmingdale, N.Y.), 5.6 mM CTP, and 1.9 mM biotinylated CTP (ENZO). The reaction mixture was incubated at 37°C for 5 h. The biotin-labeled cRNA was purified using RNeasy spin columns (Qiagen) according to the manufacturer’s protocol. The biotin-labeled cRNA was fragmented in a 40-l reaction mixture containing 40 mM Tris-acetate (pH 8.1), 100 mM potassium acetate, and 30 mM magnesium ace-tate, incubated at 94°C for 35 min, and then put on ice. One microliter of the intact biotin-labeled cRNA and 2l of the fragmented sample were run on a 1% agarose gel to evaluate both the yield and size distribution of the intact and fragmented products.
Hybridization, staining, and scanning of the GeneChip.The biotin-labeled and fragmented cRNA was hybridized to the YE6100 Yeast GeneChip array (Affymetrix, Santa Clara, Calif.) according to the manufacturer’s instructions. Briefly, a 220-l hybridization solution of 1 M NaCl, 10 mM Tris (pH 7.6), 0.005% Triton X-100, 50 pM control oligonucleotide B2 (5⬘bioGTCAAGATG CTACCGTTCAG 3⬘) (Affymetrix), control cRNA (Bio B [150 pM], Bio C [500 pM], Bio D [2.5 nM], and Cre X [10 nM]) (American Type Tissue Collection, Manassas, Va., and Lofstrand Labs, Gaithersburg, Md.), 0.1 mg of herring sperm DNA per ml, and 0.05g of the fragmented labeled sample cRNA perl was heated to 95°C, cooled to 40°C, and clarified by centrifugation before being applied to each of the four subarrays (A, B, C, and D) that comprise the YE6100 Yeast GeneChip platform. Hybridization was at 40°C in a rotisserie hybridization oven (model 320; Affymetrix) at 60 rpm for 16 h. Following hybridization, the GeneChip arrays were washed 10 times at 25°C with 6⫻SSPE-T buffer (1 M NaCl, 0.006 M EDTA, 0.06 M Na3PO4, 0.005% Triton X-100, pH 7.6) using the
automated fluidics station protocol. GeneChip arrays were incubated at 50°C in 0.5⫻SSPE-T for 20 min at 60 rpm in the rotisserie oven and then stained for 15 min room temperature and 60 rpm with streptavidin phycoerythrin (Molecular Probes, Inc., Eugene, Oreg.) stain solution at a final concentration of 10g/ml in 6⫻SSPE-T buffer and 1.0 mg of acetylated bovine serum albumin (Sigma) per ml. The GeneChip arrays were washed twice at room temperature with 6⫻ SSPE-T buffer and then scanned with a GeneArray Scanner (Hewlett-Packard, Santa Clara, Calif.), controlled by GeneChip 3.1 software (Affymetrix).
Assay monitoring and controls.The TEST 1 GeneChip (Affymetrix) was used according to the manufacturer’s instructions to assess critical features of the mRNA preparations and the cDNA generated from the yeast strains and to evaluate the stringency of staining and hybridization. In addition, a battery of three types of GeneChip controls present on the TEST 1 GeneChip and on each of the four arrays in the YE6100 GeneChip set were employed according to the manufacturer’s instructions. Details of the use and performance of these critical controls are given in Results. A method of mathematical scaling was employed by the GeneChip 3.1 software (Affymetrix) to normalize the fluorescence signal from each probe cell on each GeneChip and thus facilitate the reliable compar-ison of data from independent experiments.
Data analysis algorithm for the assessment of variance.The Affymetrix raw data set was scrutinized to eliminate any transcripts with fewer than 50% of probe cells contributing to the data. Subsequently, the first step in raw data mining for the assessment of variance captured all gene transcripts that were present on both GeneChips being compared (PP data set). The second step required that a decision be made to define what degree of change would be considered significant. We chose to approach this issue objectively, using a distribution analysis of the complete PP data set which defined a mean for the population of values and subsequently determined quartile percentages of 25, 50, and 75% above and below that mean. For the assessment of variance, outliers were defined as values exceeding the mean by 10-fold and were eliminated from the data set. When the PP data set was examined in this way, a value of 3.0-fold was determined to be the cutoff for a reliable change in expression. The value of 3.0-fold was applied to all subsequent analyses. Variances between GeneChips (intraexperimental variance) and between independent mRNA targets
(interex-TABLE 1. Cell densities and mRNA yields
Time pointa Strain
Cell density (cells/ml) at: mRNA (g)
Introduction of drug
Harvest
Control cultures Treatedcultures Control
cultures Treatedcultures
Early 499 4.3⫻106 1.7⫻107 1.1⫻107 9.9 14.7
1052 4.5⫻106 1.5⫻107 8.2⫻106 25.5 13.3
Middle 499 4.2⫻106 3.2⫻107 1.4⫻107 6.6 14.4
1052 4.1⫻106 4.2⫻107 1.1⫻107 8.0 15.4
Late 499 3.0⫻106 3.5⫻107 2.6⫻107 13.1 6.4
1052 3.2⫻106 3.2⫻107 1.8⫻107 9.4 7.5
aEarly, 2 h; middle, 3 h; late, 4.5 h. Treated cultures received 1.5, 2.5, and 2.5 mg/ml for the early, middle and late time points, respectively.
1902 NAU ET AL. J. CLIN. MICROBIOL.
on May 15, 2020 by guest
http://jcm.asm.org/
[image:2.612.54.294.82.213.2]perimental variance) were assessed by scoring the percentage of PP transcripts that exhibit no change relative to the total number of PP transcripts.
Data analysis algorithm for interrogation.For experiments in which differ-ences in expression profiles between the drug-treated and untreated yeast strains were examined, the data analysis captured data from genes that were present in both cases (PP data set), as well as genes present in one case and absent in the other (PA or AP data set). All values above the 3.0-fold cutoff were included in the analysis of experimental expression profiles. The experimental design em-ployed the analysis of data from the untreated control as a baseline for compar-ison to the treated strain in all cases. The cumulative fold change for the expression of all genes in a particular functional family was the sum of the levels of change of gene expression, using the values for the untreated strain as the control.
Bioinformatics analyses.GeneSpring version 2.1 (Silicon Genetics, San Car-los, Calif.) was used to derive global trends in the expression profiles and to specifically assess the expression patterns of thepdrgene targets. We used the temporal analysis of all of the raw data from the Affymetrix platform normalized to a single mean by the GeneSpring software.
RESULTS
Consistent cell harvests and mRNA yields. Table 1 shows the yields of cells and of mRNA across the three time points of the experiment and at the two concentrations of chloroquine used in the study. The amounts of cells harvested were com-parable and equivalent at all time points.
Assessment of GeneChip performance.A battery of controls was used for all experiments. Three types of GeneChip con-trols are present on the TEST 1 GeneChip and on each of the four GeneChips in the YE6100 set. The first set of controls consists of four synthetically generated plasmid templates that are subjected to reverse transcription to incorporate fluores-cent label according to the manufacturer’s instructions (Af-fymetrix). These four cRNA templates, Bio B, Bio C, Bio D,
and Cre X, are mixed in a cocktail to generate final concen-trations of 150 pM, 500 pM, 2.5 nM, and 10 nM, respectively. These concentrations generate a standard curve and can thus be used to standardize interexperimental variation and effi-ciency of cDNA synthesis and labeling and to provide the dynamic range of the assay. Ultimately, the standard curve generated by these templates can be used to quantitate the level of RNA expression for a given gene on a per-cell basis. The second set of controls used on the GeneChip assesses the efficiency of cDNA synthesis by quantitating the amounts of 3⬘ and 5⬘ portions of target sequences generated during cDNA synthesis by assessing the expression of the yeast actin gene. Optimal synthesis reactions will generate equivalent amounts of signal in the 3⬘ and 5⬘ prime targets. The third set of GeneChip controls involves the evaluation of the integrity of the mRNA preparation used in the analysis and reports the GeneChip-based determination of equivalent amounts of mRNA used in the test. This is achieved by the assessment of the 18S rRNA gene expression profile, which is divided on the GeneChip into five sets of probe cells or segments (a through e). The results of the analysis of TEST 1 GeneChip controls for two independent evaluations of strains 499 and 1052 are shown in Fig. 1. The ordinate indicates the relative fluorescence in-tensity reported by the GeneArray Scanner. The data from the 18S rRNA series show less than a twofold range in segment a and no significant difference in segment b, c, or d, except for the 1052 data point, which is less than onefold lower in seg-ment c. This data set supports the hypothesis that equivalent amounts of mRNA were used in the cDNA reaction in prep-aration for GeneChip analysis. Also shown in Fig. 1 are the FIG. 1. Performance of the battery of GeneChip controls with two independent preparations of templates from strains 1052 and 499. The ordinate shows the relative fluorescence values for each of the control markers listed on the abcissa. The linear regressionr2value for the standard curve generated by the Bio B, Bio C, Bio D,
and Cre X markers is 0.86.
on May 15, 2020 by guest
http://jcm.asm.org/
results of the assessment of 3⬘ and 5⬘ segments of the actin gene expression. There is no significant difference between the fluorescence values for the 3⬘end of the yeast actin gene and for the 5⬘end of the yeast actin gene in this experiment. This data set indicates an optimal yield from the cDNA synthesis reaction. The manufacturer (Affymetrix) suggests that the yield of 3⬘product may vary by as much as fourfold. In our hands, optimization of the cDNA synthesis step routinely yielded less than a 0.5-fold difference between 3⬘and 5⬘segments.
The standard curve generated by the synthetic templates Bio B, Bio C, Bio D, and Cre X is shown in Fig. 1. The curve has an r2 value of 0.86 and was remarkably consistent between strains, between GeneChips, and for two independent tem-plate preparations. Table 2 summarizes data on the perfor-mance of the battery of the three sets of controls that were generated by between 20 and 40 independent GeneChip as-sessments. A descriptive statistical analysis of the data set shows stringent inter- and intraexperimental consistency.
Assessment of assay variance.Table 3 presents data on the results of two independent expression profiles for each strain, 499 and 1052, in the absence of drug. These data were gener-ated using one of the four GeneChips that comprise the com-plete YE6100 GeneChip platform (GeneChips A through D). In each case an independent growth and harvest of yeast cells followed by an independent preparation of GeneChip-ready template was carried out. Genes were scored as being present in both sets of data (PP), exhibiting no change in expression between the two sets of data, having increased or decreased, and, finally, having increased or decreased by threefold. For strain 1052, the total number of PP genes was 1,450, of which 32 increased by threefold, 116 decreased by threefold, and 1,302 (89%) remained unchanged, thus generating a variance between the two runs of 10.2%. For strain 499, the total num-ber of PP genes was 1,439, of which 72 increased by threefold, 153 decreased by threefold, and 1,214 (84%) remained un-changed, thus generating a variance between the two runs of 15.6%. To further reduce these levels of interexperimental variance, the original culture was split into two cultures and reassessed for percentage of variance. As a result of splitting the original culture in this way, rather than growing two side-by-side cultures, the variance was reduced to zero for both strains, since there were no genes that changed greater than threefold between the two runs.
Global expression profiles of strains 1052 and 499 in the presence and absence of chloroquine.Shown in Fig. 2 and 3 are the results of a global survey of the 6,000 genes on the YE6100 GeneChip platform as assessed in strains 1052 and 499, respec-tively, in the presence and absence of the drug chloroquine and at each of the three time points and two drug concentrations used in the study. The control in each case was the value from the strain in the absence of the drug. Cumulative fold change values for the functional families are arrived at by simple summation of the levels of change from the control for each gene in a functional family.
As compared with the middle and late time points, the early time points for both 1052 and 499 exhibit a lower level of expression, with some increase in genes associated with mem-branes in strain 499. At the middle time point, however, both strains exhibit an increase in gene expression, with few genes showing a decrease. Genes associated with membranes, me-tabolism, and ribosomes showed the most increase in strain 1052 at the middle time point. The levels of the cumulative increase in expression were 2- to 10-fold higher in strain 499 at the middle time point. Increases in the expression of genes associated with membranes, metabolism, and ribosomes were similar in pattern but greater in magnitude to the changes at this time point in strain 1052. The most dramatic change oc-curred in strain 499 at the middle time point in the increase in expression of genes associated with synthetic pathways. In strain 1052, the late time point data set was dominated by a large decrease in the expression of genes associated with mem-branes. In contrast to the case for the two earlier time points, most expression levels were reduced in strain 1052 at the late time point. The expression of genes in strain 499 was also decreased at the late time point compared with the two earlier time points. The largest decline in expression was in the genes associated with translation and transcription.
[image:4.612.47.553.84.147.2]Targeted expression profiles of thepdrgenesPDR5,PDR10, andSNQ2in strains 1052 and 499 in the presence and absence of chloroquine.Figure 4 shows the expression profiles at three time points and in the absence or the presence of two different concentrations of the antimalarial drug chloroquine. The ex-pression of the genePDR5was decreased in the 1052 mutant strain in the presence and absence of the drug. In contrast, the expression of the genePDR10was increased in strain 1052 in the presence and the absence of chloroquine. The expression TABLE 2. Descriptive statistical analysis of the GeneChip control platform
Control type na Relative fluorescence intensity
bwith strain:
1052 499
Bio B, Bio C, Bio D, and Cre X 20 4.13⫾0.53 (r2⫽0.83) 3.27⫾0.56 (r2⫽0.81)
18S ribosomal genes (a–e) 40 0.98⫾0.38 1.04⫾0.43
Yeast actin, 3⬘and 5⬘ 36 2.74⫾0.55 3.04⫾0.55
aTotal number of data points in the analysis.
bData are expressed as the median⫾the standard error. Regression values for the standard curve are for linear regression calculations.
TABLE 3. Calculation of variance for two independently grown and tested samples of each strain
Strain No. of genes presentin both profiles
No. (%) of genes: Variance
With no change That increase That decrease Withno change⬍3-fold or That increaseⱖ3-fold That decreaseⱖ3-fold No. %
1052 1,450 786 (54.2) 394 (27.2) 270 (18.6) 1,302 (89.8) 32 (2.2) 116 (8.0) 148 10.2 499 1,439 690 (47.9) 421 (29.3) 328 (22.8) 1,214 (84.4) 72 (5.0) 153 (10.6) 225 15.6
1904 NAU ET AL. J. CLIN. MICROBIOL.
on May 15, 2020 by guest
http://jcm.asm.org/
[image:4.612.55.553.666.729.2]of the geneSNQ2was moderate but level in strain 1052 in the presence of drug and moderate with a minor increase in slope in the absence of the drug. The wild-type strain 499 exhibited an increase in the expression levels ofPDR5in the presence of drug but not in the absence of drug. In the absence of drug, the expression of the genePDR5was moderate and level across all time points. The expression levels of PDR10 and SNQ2 in strain 499 remained low and level in both the presence and absence of the drug.
DISCUSSION
Template preparation.Several approaches to the extraction of total RNA and the subsequent preparation of mRNA are currently available. We found that the combination of two commercially available kits, the Tri-Reagent and Qiagen Oligo-tex kits, gave the most dependable results with yeast. The most critical aspects of the preparation of template for the Affy-metrix GeneChip YE6100 platform are the quality of the mRNA and the degree to which it is representative of the biological nature of the sample. To ensure a representative sample, it is imperative to standardize the growth and handling of the yeast cultures. Holstege et al. first suggested that the attention to detail involved in the growth and harvest of yeast cultures for expression profiling was critical to the dependabil-ity of the data generated (11). We confirm and extend that observation by emphasizing the added importance of standard-izing the treatment of these strains with the drug chloroquine
and minimizing experimental variance by splitting single cul-tures for drug treatment. It is imperative to ascertain the phe-notypes of the wild-type and mutant strains in the presence of a drug prior to the characterization of the expression profiles generated as a result of treatment with that drug.
Quality control and assessment.The Affymetrix GeneChip YE6100 is exquisitely sensitive and necessitates the use of powerful controls to assure that all aspects of the procedure are consistent and reliable. Of the four types of controls avail-able for expression profiling, using the Affymetrix GeneChip YE6100, we chose to apply three. The only control that we did not utilize involved the addition of synthetic total RNA tem-plate to the RNA samples extracted from the yeast strains. Instead, we chose to use data from the 3⬘and 5⬘ends of the yeast actin gene as a more accurate and less intrusive measure of the yield, quality, and representative nature of the mRNA. The data generated by these controls result directly from the sample tested and are not enhanced or quenched by the pres-ence of artificial template.
[image:5.612.65.540.77.373.2]We have determined that the battery of three controls that we routinely employ are essential to the interpretation, consis-tency, and reliability of expression profiling experiments. Per-haps the most powerful of the sets of controls is the standard curve generated by the synthetic templates Bio B, Bio C, Bio D, and Cre X. These data points offer the investigator the power to express GeneChip data on a semiquantitative level. The 18S ribosomal protein series and the yeast actin 3⬘and 5⬘ FIG. 2. Cumulative change of gene expression levels in the mutant strain 1052 in the presence of chloroquine. The ordinate shows the cumulative fold changes for the expression levels of genes categorized by the functional family designation shown on the abcissa. The functional families are cell cycle and division proteins (CCD), drug resistance membrane proteins (DRM), kinases (KIN), membrane proteins (MEM), metabolic pathway proteins (MET), ribosomal proteins (RIBO), respiratory chain proteins (RSP), synthetic metabolic pathways (SMP), transcription and translation proteins (TRAN), pathology-related proteins (PATH), and stress-related proteins (SR). The expression level of genes in the untreated sample is used to determine the baseline for the degree of change of gene expression. The profiles for the early time point, the middle time point, and the late time point are shown.
on May 15, 2020 by guest
http://jcm.asm.org/
end targets provide critical information on the preparation of the RNA and on the representative quality of the cDNA sub-sequently produced. The fact that all of these controls reside on each GeneChip further supports and ensures the genera-tion of dependable data both within and between experiments. Most importantly, remarkably low levels of intraexperimental variance can be achieved, despite the enormous number of complex steps involved in generating an expression profile, by faithful attention to optimized laboratory protocols and by the vigilant use of the battery of GeneChip controls.
Interpretation of GeneChip expression profiles. We em-ployed a well-characterized heterologous yeast model to assess the impact of the drug chloroquine on the yeastpdr genes PDR5,PDR10, andSNQ2. We assessed the expression profile data on two levels: (i) the global analysis of cumulative changes in expression of genes classified into broad functional families and (ii) the targeted expression analysis of the threepdrgenes across the three time points and two drug concentrations used in the study. Jelinsky and colleagues used the global assess-ment of expression profiles to assess changes in gene expres-sion in yeast in response to alkylating agents (12). Alon and colleagues employed targeted expression and cluster analysis to define expression patterns in colon tumors (1).
The assessment of the global alterations in expression pro-files of broadly defined functional families in each of the strains in the presence of drug clearly identifies that in the mutant, the functional family most significantly affected by the drug is the membrane protein group. Strain 1052 exhibits a 250-fold re-duction in the cumulative gene expression in the membrane
protein group. The functional family of drug resistance-related membrane proteins is also reduced in cumulative gene expres-sion by 75-fold. In contrast to these observations, the wild-type strain exhibits an increase in the expression of membrane-associated proteins and, most significantly, in proteins involved with the processes of transcription and translation. By the late time point, the wild-type strain exhibits a 100-fold decrease in the expression of proteins related to transcription and trans-lation. Clearly these two strains respond with distinct strategies to the presence of drug. The assessment of the degree of cumulative change in the expression profiles of broadly defined functional families of genes can be readily made from the data reported by the Affymetrix GeneChip YE6100 platform. This information is most useful in suggesting the focus of further data mining to elucidate the specifics of a biological pathway affected by the drug.
[image:6.612.59.545.72.362.2]The GeneSpring bioinformatics platform commercially available from Silicon Genetics interrogates the Affymetrix GeneChip YE6100 data in a significantly more powerful way. This tool allows for the identification of the patterns and mag-nitude of expression of any single gene assessed by the Af-fymetrix GeneChip YE6100 over the course of the study. The expression profile of individual targeted genes as well as the patterns or clusters of related genes can also be elucidated by the analysis. In the model system employed in this study, the promoter region of thePDR10 gene was disrupted. An un-changed or reduced expression of this gene might be predicted as a result of this deletion. The expression profiles derived by GeneSpring analysis of thePDR10gene in the mutant strain FIG. 3. Cumulative change of gene expression levels in the wild-type strain 499 in the presence of chloroquine. The ordinate shows the cumulative fold change for the expression levels of genes categorized by the functional family designation shown on the abcissa. The functional families are cell cycle and division proteins (CCD), drug resistance membrane proteins (DRM), kinases (KIN), membrane proteins (MEM), metabolic pathway proteins (MET), ribosomal proteins (RIBO), respiratory chain proteins (RSP), synthetic metabolic pathways (SMP), transcription and translation proteins (TRAN), pathology-related proteins (PATH), and stress-related proteins (SR). The expression level of genes in the untreated sample is used to determine the baseline for the degree of change of gene expression. The profiles for the early time point, the middle time point, and the late time point are shown.
1906 NAU ET AL. J. CLIN. MICROBIOL.
on May 15, 2020 by guest
http://jcm.asm.org/
1052 exhibit an unexpectedly high level of expression in both the presence and absence of chloroquine. Several explanations for this observation can be proposed.
The elevated levels of the mutantPDR10gene expression may reflect the bias of the GeneChip to assess the 3⬘region of a gene. It is important to take into account that the Affymetrix GeneChip YE6100 platform interrogates 25-mer regions that cover the last 600 bp of the 3⬘end of the gene (5). This region is distal to the deletion made at the 5⬘promoter region of the PDR10 gene. Alternatively, there may be a difference in the efficiency of the promoter region, or in the stability or rate of turnover of the gene product, in the mutant as compared to that of the intact gene in the wild-type strain. In the wild-type strain, there is an increase in the production of PDR5in re-sponse to drug treatment, while thePDR10andSNQ2 expres-sion levels remain moderate and unchanged, respectively. This pattern may reflect the specificity of thePDR5response to the drug chloroquine in this strain (9). In contrast, expression levels ofPDR5andSNQ2in the mutant strain show little or no response to the presence of the drug. Mechanistic explanations of the biological function of the gene products of PDR5, PDR10, andSNQ2in the mutant and wild-type strains warrant further investigation. These observations show the complexity of the interpretation of expression profile data and underscore the necessity of ascertaining, by an independent assessment, information on the functional status of a gene target.
In summary, the utilization of optimized laboratory proto-cols, monitored by stringent controls, generates a powerful data set from the Affymetrix Expression GeneChip platform. The interpretation of the patterns and magnitudes of expres-sion profiles represented in the data set requires the
applica-tion of bioinformatics tools and a fundamental knowledge of the model being examined. The power of the method resides in the sensitivity, accuracy, and speed with which the expression of over 6,000 genes in response to experimental conditions can be simultaneously assessed. Confirmation of the trends ob-served in the data generated by expression profiling serves as a point of departure for further analysis of gene function and thus of the molecular mechanisms of drug action.
ACKNOWLEDGMENTS
We thank Karl Kuchler for the yeast strains YHW 1052 and YPH 499 used in this study, Anthony Lailin of Silicon Genetics and Brian Shimada and Mark Hurt of Affymetrix for their technical advice, and Deborah L. Birx and Nelson L. Michael for helpful discussions.
This work was supported in part by Cooperative Agreement no. DAMD17-93-V-3004 between the U.S. Army Medical Research and Materiel Command and the Henry M. Jackson Foundation for the Advancement of Military Medicine.
REFERENCES
1.Alon, U., N. Barkai, D. A. Notterman, K. Gish, S. Ybarra, D. Mack, and S. J. Levine.1999. Broad patterns of gene expression revealed by clustering anal-ysis of tumor and normal colon tissues probed by oligonucleotide arrays. Proc. Natl. Acad. Sci. USA96:6745–6750.
2.Balzi, E., M. Wang, S. Leterme, L. Van Dyck, and A. Goffeau.1994.PDR5, a novel yeast multidrug resistance conferring transporter controlled by the transcription regulator PDR1. J. Biol. Chem.269:2206–2214.
3.Bauer, B. E., H. Wolfger, and K. Kuchler.1999. Inventory and function of yeast ABC proteins: sex, stress, pleiotropic drug and heavy metal resistance. Biochim. Biophys. Acta1461:217–236.
[image:7.612.89.516.72.361.2]4.Bissinger, P. H., and K. Kuchler.1994. Molecular cloning and expression of theSaccharomyces cerevisiaeSTS1 gene product. A yeast ABC transporter conferring mycotoxin resistance. J. Biol. Chem.269:4180–4186.
FIG. 4. Expression profiles of the yeastpdrgenesPRD5,PDR10, andSNQ2. The ordinate shows the relative fluorescence intensity for (i) each of the study time points (early [E], middle [M], and late [L]), (ii) the two experimental treatments (drug treated [T] and untreated [U], and (iii) each of the two strains (1052 and 499), as shown on the abcissa.
on May 15, 2020 by guest
http://jcm.asm.org/
5.Chee, M., R. Yang, E. Hubbell, A. Berno, X. C. Huang, D. Stern, J. Winkler, D. J. Lockhart, M. S. Morris, and S. P. A. Fodor.1996. Accessing genetic information with high density DNA arrays. Science274:610–614. 6.Cho, R. J., M. Fromont-Racine, L. Wodicka, B. Feierbach, T. Strearns, P.
Legrain, D. J. Lockhart, and R. W. Davis.1998. Parallel analysis of genetic selections using whole genome oligonucleotide arrays. Proc. Natl. Acad. Sci. USA95:3752–3757.
7.Decottignies, A., and A. Goffeau.1997. Complete inventory of the yeast ABC proteins. Nat. Genet.15:137–145.
8.Delling, U., M. Raymond, and E. Schurr.1998. Identification of Saccharo-myces cerevisiaegenes conferring resistance to quinoline ring containing antimalarial drugs. Antimicrob. Agents Chemother.42:1034–1041. 9.Egner, R., F. E. Rosenthal, A. Kralli, D. Sanglard, and K. Kuchler.1998.
Genetic separation of FK506 susceptibility and drug transport in the yeast
PDR5ATP binding cassette multidrug resistance transporter. Mol. Biol. Cell 9:523–543.
10. Hirata, D., K. Yano, K. Miyahara, and T. Miyakawa.1994.Saccharomyces cerevisiae YDR1, which encodes a member of the ATP-binding cassette (ABC) superfamily, is required for multidrug resistance. Curr. Genet.26: 285–294.
11. Holstege, F. C. P., E. G. Jennings, J. J. Wyrick, T. I. Lee, C. J. Hengartner, M. R. Green, T. R. Golub, E. S. Lander, and R. S. Young.1998. Dissecting the regulatory circuitry of a eukaryotic genome. Cell95:717–728. 12. Jelinsky, S. A., and L. Samson.1999. Global response ofSaccharomyces
cerevisiaeto an alkylating agent. Proc. Natl. Acad. Sci. USA95:1486–1491. 13. Kralli, A., S. P. Bohen, and K. R. Yamamoto.1995. LEM1, an ATP-binding-cassette transporter, selectively modulates the biological potency of steroid hormones. Proc. Natl. Acad. Sci. USA92:4701–4705.
14. Kuchler, K., and R. Egner.1997. Unusual protein secretion and transloca-tion pathways in yeast: implicatransloca-tion of ABC transporters, p. 49–85.InK.
Kuchler, A. Rubartelli, and B. Holland (ed.), Unusual secretory pathways: from bacteria to man. Landes Bioscience, Austin, Tex.
15. Mahe, Y., Y. Lemoine, and K. Kuchler.1996. The ATP binding cassette transportersPdr5andSnq2ofSaccharomyces cerevisiaecan mediate trans-port of steroids in vivo. J. Biol. Chem.271:25167–25172.
16. Miyahara, K., M. Mizunuma, D. Hirata, E. Tsuchiya, and T. Miyakawa. 1996. The involvement of theSaccharomyces cerevisiaemultidrug resistance transporters Pdr5p and Snq2p in cation resistance. FEBS Lett.399:317–320. 17. Ruetz, S., U. Delling, M. Brault, E. Schurr, and P. Gros.1996. The pmdr1 gene ofPlasmodium falciparumconfers cellular resistance to antimalarial drugs in yeast cells. Proc. Natl. Acad. Sci. USA93:9942–9947.
18. Servos, J., E. Haase, and M. Brendel.1993. GeneSNQ2ofSaccharomyces cerevisiae, which confers resistance to 4-nitroquinoline-N-oxide and other chemicals, encodes a 169 kDa protein homologous to ATP-dependent per-meases. Mol. Gen. Genet.236:214–218.
19. Taglicht, D., and S. Michaelis.1998.Saccharomyces cerevisiaeABC proteins and their relevance to human health and disease. Methods Enzymol.292: 130–162.
20. Wendler, F., H. Bergler, K. Prutej, H. Jungwith, G. Zisser, K. Kuchler, and G. Hogenauer. 1997. Diazaborine resistance in the yeastSaccharomyces cerevisiaereveals a link between YAP1 and the pleiotropic drug resistance genesPDR1andPDR3. J. Biol. Chem.272:27091–27098.
21. Winzeler, E. A., D. R. Richards, A. R. Conway, A. L. Goldstein, S. Kalman, M. J. McCullough, J. H. McCusker, D. A. Stevens, L. Wodicka, D. J. Lock-hart, and R. W. Davis.1998. Direct allelic variation scanning of the yeast genome. Science281:1194–1197.
22. Wodicka, L. H. Dong, M. Mittman, M. H. Ho, and D. J. Lockhart.1997. Genome-wide expression monitoring inSaccharomyces cerevisiae. Nat. Bio-technol.15:1359–1367.
1908 NAU ET AL. J. CLIN. MICROBIOL.


![FIG. 4. Expression profiles of the yeast pdrpoints (early [E], middle [M], and late [L]), (ii) the two experimental treatments (drug treated [T] and untreated [U], and (iii) each of the two strains (1052 and 499), genes PRD5, PDR10, and SNQ2](https://thumb-us.123doks.com/thumbv2/123dok_us/8232617.827489/7.612.89.516.72.361/expression-proles-pdrpoints-experimental-treatments-treated-untreated-strains.webp)
