444 The Re-afforesting of Ireland. [August, upon the farm, so that the landowner should not be mulcted by having to allow a higher rent value for the part hefrosumed, than the judicial rent put upon the best bit of land upon the whole farm by the Commissioners, when engaged in the simple and now stereotyped operation of reducing the rent by 25 per cent.
Finally, we may sum up the question of whether we shall re-afforest or not, by saying :—If you want shelter, then plant for shelter. If you want to add to the beauty of the scenery or to give employment to the labourers, then plant for that. But as to planting trees as a speculation, and waiting for twenty-five years to get some profit, one feels inclined to give the same advice that Punch gave to those about to get married—Don't.
VI,—On some Comparative Statistics of Irish Counties, compiled from the Returns obtained during the late Census and the Census of 1841, and other publications issued by the General Register Office of Ireland. By T. W. Grimshaw, M. A. M.D. Registrar-General for Ireland.
[Read Tuesday, 22nd May, 1883.]
IN the following statement I wish to bring under review a number of statistics which I have arranged since the completion of the Census of 1881. These statistics are not altogether derived from the census reports, but are to some extent extracted from the other publications issued by the General Eegister Office of Ireland.
The main features are founded on comparisons instituted between the years 1841 and 1881, as derived from the census enumerations of these periods. The reason why I have selected these epochs for comparison with one another, is that the earlier period was before the great crisis of 1847, a n (^ w n at is equally important from my point
of view, was the census year immediately preceding the year 1845, when the population of Ireland is supposed to have reached its maxi-mum—being estimated in the middle of the year at 8,295,061. The remaining items of comparison are extracted from the published reports on Agricultural Statistics in Ireland, Emigration Eeports, Keports on Births, Deaths, and Marriages, and Migratory Labourer Eeturns. Tt is especially gratifying to note that several of the items of information have been collected at the instance of the Statistical and Social Inquiry Society of Ireland. In arranging these statistics, I have endeavoured to place them so that the principal statistical facts with regard to the Counties of Ireland will be presented in such a way that the more important social conditions of each may be com-pared with any other, or with a selected group of counties, with a province, or with the whole of Ireland—the provinces with one another, and with the country as a whole.
1883.] Comparative Statistics of Irish Counties. 445 criticism as to what they really represent; and which tell their own tale in the most emphatic and least ambiguous manner.
The accompanying table (Table I.) may seem somewhat startling in its complexity and extent; but a careful analysis of the headings of its columns will show that each expresses a very distinct idea. No doubt the heading of each column might serve as a text for a long discourse, raising many questions difficult of solution; indeed this is so much the case that many might think that my part of the duty had been sufficiently performed when I had compiled and tabulated the statistics, leaving it to others to draw conclusions.
While the main object of this paper is to supply certain materials which can be utilized by anyone, I think it right to make some remarks indicating the manner in which I consider these important statistics may be dealt with as tests of the social condition of the people in various parts of Ireland. In giving examples of the manner in which the statistics may be employed, I shall avoid sentimental and controversial considerations, as far as possible, and look at the question from practical points of view. I have no wish to despise sentiment, which must be always taken into consideration when applying the maxims of political economy; but I wish to leave senti-ment to others, and deal only with the hard facts and figures now before me.
Looking generally at the table, the subjects dealt with therein divide themselves into four great groups—(i) Population and vital statistics ; (2) Statistics of the relation of the population to the land ; (3) Occupation statistics; and (4) Education statistics. Looking at these generally, we find that the first group indicates the increase and decrease of population, and the causes which have influenced these movements ; the second and third groups deal with the means of subsistence of the population 3 and the fourth group indicates how far the population is in a condition to take advantage of the means of subsistence, so as to increase in wealth and comfort, or, what is equally important—avoid pauperism and misery. I think it will be admitted that the best means of avoiding pauperism and misery, with their attendants of crime and disease, is the great problem to be solved in Ireland; and it is chiefly with a view of assist-ing those who are endeavourassist-ing to solve this problem that I have arranged the facts which I now bring forward. I believe these statistics will indicate with tolerable clearness those parts of Ireland where prosperity and the conditions for prosperity prevail to the greatest extent, and on the other hand where the contrary conditions are to be found developed in the greatest intensity.
A review of the columns of this table will show that in some the variations are great indeed, and point to very different social conditions, in so far as the particular item dealt with is concerned, while in others the variations are slight, and so liable to influence by adventitious circumstances that they point to but small compara-tive differences.
446 Comparative Statistics of Irish Counties. [August, the per-centage of total increase or decrease of population for each county, province, etc.—are the most important. Next in order are columns 20 and 21, relating to emigration, whichfforms the most important factor in the increase and decrease of the popu-lation of Ireland, overshadowing in importance the birth rate (column 23), and death rate (column 24), wliich in most communities are the principal elements influencing the movement of populations. Similarly, leading columns will be found in the other branches of inquiry dealt with in the table.
In order that these, which I consider the more important items, may be most readily compared, I have arranged the counties in lists according to the numerical position which they occupy in each of the leading columns.
A comparison of these lists will show that certain7counties are generally found at the extremes of the list, either at or near the head, or at or near the foot, and those who are familiar with con-ditions of life in Ireland will find those counties where the means of subsistence are lowest and resources either small or badly devel-oped, grouped towards one end (we may call it the minimal end) of most of the lists, whereas the more prosperous counties will be found grouped at the other, or maximal, end of the columns.
It will here be convenient to state that when I use the term "western counties," I mean the counties contained in the province of Connaught, together with Donegal, Clare, and Kerry. I shall have to refer to this division of the counties further on.
Now without entering upon the domain of controversy, I think it will be admitted that in those portions of an agricultural country like Ireland, where the population is increasing, stationary, or but slightly decreasing, and therefore continues comparatively dense, the means of subsistence are at the minimum, and that this state is intensified where the land is poor, the agricultural holdings small, trade and manufactures absent, or pursued but to a small extent, or where, as in many parts of Ireland, the people have to follow the precarious occupation of migratory agricultural labourers, in order to make up the balance of income necessary to existence—and that these conditions will culminate in a state almost verging on disaster, when they are increased by a deplorable deficiency of elementary educa-tion. If this statement is admitted, and I think it cannot be denied, we have a series of standards established by which we can measure each principal social element in each county in Ireland, and by the combination of which we can fairly, though roughly, estimate the social condition and probable degree of prosperity of the population in each part of the country. I have accordingly selected certain items as standards of measurement, and arranged the counties of Ireland in lists which represent their order of merit in relation to those standards.
1883.] By T. W. Grimshaiv, M.A. M.D. 447 columns 4 and 6, indicating the per-centage increase and decrease of the total population between the Census of 1841 and that of 1881. The counties arranged in order from the greatest increase (in Antrim of 19.1 per cent.), to the greatest decrease (in Tipperary of 54.2 per cent.), are shown in Table I I .
TABLE II.
SHOWING INCREASE AND DECREASE PEB CENT, IN POPULATION OP IRISH COUNTIES BETWEEN 1841 AND 1 8 8 1 , ARRANGED FROM THE GREATEST INCREASE TO THE GREATEST DECREASE.
Per cent. 1 Antrim, Increase 19.1 2 Dublin, ,, 12.4 3 Londonderry, Decrease 25.7 4 Down, ,, 26.1 5 Armagh,
6 Donegal, 7 Kerry, 8 Kildare, 9 Mayo,
, 29*8 „ 30.5 , 3i.6 „ 33.8 , 36.7
)erage Decrease for Ireland, 36
10 Tyrone, Decrease 36.8 11 Sligo, ,, 12 Wexford, - ,, 13 Louth, ,, 14 Leitrim, ,, 15 Cork,
38.3 38.7 39-4 41.8 42.0
16 Waterford, 17 Wicklow, 18 Gal way, 19 Limerick, 20 Fermanagh, 21 Carlow, 22 Cavan, 23 Longford, 24 Roscommon, 25 Monaghan, 26 Westmeath, 27 King's, 28 Clare, 29 Kilkenny, 30 Meath, 31 Queen's, 32 Tipperary,
DecreasePer cent.42.5 44-2 45-2 45-3 45-8 46.0 46.8 47.2 47.8 48.7 49.2 5O.4 50.6 50.8 52.2 52.5 54.2
Now if all other conditions were equal—which they are not—it is manifest that the struggle for existence would be greatest where the population has increased, remained stationary, or but slightly dimin-ished ; whereas it would be least where the population has consider-ably diminished. Therefore life would be harder in Antrim and Dublin than in Queen's County and Tipperary. There are mitigating influences in force—namely, the presence of large and thriving towns in the two former counties, which make their population as pros-perous, if not more prospros-perous, than the population in the two latter. If, however, we take other counties near the minimal end of the list, where there are no mitigating causes, we find a very unfavourable contrast in the cases of Donegal, Kerry, and Mayo, when compared with the counties at the other extreme of the list. This will be more strikingly illustrated when I deal with the statistics of occupation and education.
448 Comparative Statistics of Irish Counties. [August,
TABLE III.
SHOWING THE PROPORTION OF EMIGRANTS PER CENT, OF THE MEAN POPULATION WHO LEFT EACH COUNTY OF IRELAND FROM THE YEAR 1851 TO THE YEAR
L88L, ARRANGED FROM THE LOWEST TO THE HIGHEST.
1 Dublin, 2 Wicklow, 3 Kildare, 4 Sligo, 5 Mayo, 6 Donegal, 7 Down, 8 Louth, 9 Armagh, 10 Wexford, 11 Fermanagh, 12 Carlow, 13 Londonderry, 14 Tyrone, 15 Roscommon, 16 Westmeath, 17 Galway,
Percent. 19.1 26.2 3i.o 32.9 - 33.6 .. 36.3 36.5 37-2 37-7 39-5 39-7 40.9 i1'2 .. 42.2
43.o 43.1 43.2
18 Queen's, 19 Leitrim, 20 Kilkenny, 21 Monaghan, 22 Meath,
Average for Ireland,
23 King's, 24 Antrim, 25 Cavan, 26 Waterford, 27 Longford, 28 Kerry, 29 Clare, 30 Cork, ^ 31 Limerick, 32 Tipperary,
Per cent. 45-O 45.5 45.9 46.4 46.6 47-3 49-3 So.5 53.6 54.3 58.2 60.1 61.9 62.7 62.8 63.2
As a matter of course, it will be found that the order in this table is very similar to that in Table I I .
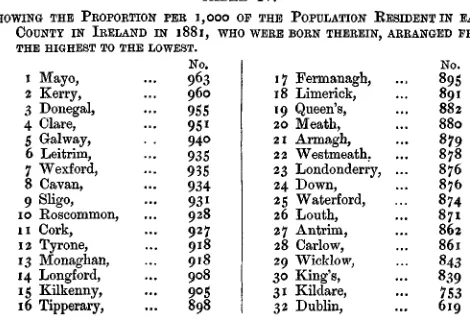
Closely related to the emigration statistics are those found in column 19, Table I., respecting the birth-places of the people. Just as the rate of emigration indicates the desire or the ability of the most enterprising members of a community to seek a larger field for the employment of their energies, so the proportion of population residing in the locality in which they were born is an indication of the degree of activity of the community. If the locality is a pros-perous one, with plenty of employment, strangers will flock into it, and the native population will be diluted by persons born outside its boundaries.
The counties of Ireland have been arranged in Table IV. in the order represented by the figures in column 19 of Table I.
TABLE IV.
SHOWING THE PROPORTION PER 1,000 OF THE POPULATION EESIDENTIN EACH COUNTY IN IRELAND IN 1881, WHO WERE BORN THEREIN, ARRANGED FROM THE HIGHEST TO THE LOWEST.
1 Mayo, 2 Kerry, 3 Donegal, 4 Clare, 5 Galway, 6 Leitrim, 7 Wexford, 8 Cavan, 9 Sligo, 10 Roscommon, 11 Cork, 12 Tyrone, 13 Monaghan, 14 Longford, 15 Kilkenny, 16 Tipperary,
No.
963
960
955
95i 940
935 935
934 93i 928 927 918 918 908 905
898
17 Fermanagh, 18 Limerick, 19 Queen's, 20 Meath, 21 Armagh, 22 Westmeath. 23 Londonderry, ... 24 Down,
25 Waterford, 26 Louth, 27 Antrim, 28 Carlow, 29 Wicklow, 30 King's, 31 Kildare, 32 Dublin,
No.
895
891 882 880
879 878 876 876 874
871 862 861 843 839
753
1883.]
By T. W. Grimshaw, MA. M.D.
449 In this case, the contrast "between the minimal and maximal extremities of the tahle is particularly well marked. We find some half-dozen of the least prosperous counties of Ireland at one end, and a similar number of the most prosperous at the other end of the list. We next come to a very important element in the social condition of an agricultural country, namely, the relations of the population to the land. These relations are dealt with in columns 25 to 39 inclusive of Table I., which are principally extracted from the tables compiled during the late census at a request from this Society founded on the very suggestive paper of Mr. Jephson, read before the Society on 17th of February, 1880. Columns 25 and 26 show the number of acres of arable and pasture land to each person in the years 1841 and 1881 respectively. It will be observed that where large town populations exist, as in Dublin, Antrim and Down, little alteration has taken place in the forty years in the pro-portion between the area of land and the number of people; whereas in the more rural districts the amount of land to persons has gene-rally doubled. The practical question, however, is—how does it stand at present? Table V. illustrates this point.TABLE V.
SHOWING NUMBER OF A C R E S OF A R A B L E AND PASTURE L A N D TO EACH PERSON I N EACH COUNTY OF IRELAND I N 1881, ARRANGED FROM THE LOWEST TO THE
HIGHEST.
Acres. 0.5
1 Dublin, 2 Antrim, 3 Armagh, 4 Down, 5 Louth, 6 Londonderry, 7 Monaghan, 8 Tyrone, 9 Mayo, 10 Sligo, 11 Cork, 12 Waterford, 13 Cavan, 14 Donegal,
Average for Ireland,
15 Limerick,
1.4 '•7 1.9
2.2
2.4 2.7 2.9 2.9 2.9 2.9 2.9
3-2
16 Leitrim, 17 Longford, 18 Eoscommon, 19 Kerry, 20 Fermanagh, 21 Galway, 22 Carlow, 23 Wexford, 24 Tipperary, 25 Clare, 26 Kilkenny, 27 Kildare, 28 Queen's 29 Wicklow, 30 King's, 31 Westmeath, 32 Meath,
Acres. 3-2 33 3.6 3.7 4.0 4.0 4.2 4-2 4.3 4.3 4.5 4.8 4.8 4.8 5-o 6.3
450 Comparative Statistics of Irish Counties. [August, I 2 3 4 5 6 7 8 9 I O i i 1 2 13 14 15 Mayo, Leitrim, Kerry, Donegal, Sligo,
Gal way, ... 5 Cavan,
Clare, ... : Tyrone, ... 2 Londonderry, : Roscommon, 2 Cork, ... : Longford, Armagh, ... : Monaghan, ...
I s. [ 6 [ 8 1 9 E 1 0 [ 1 7 1 O
I 2
* 3 * 3 » S 5 6 1 9 2 9
> 1 1 2 1 1
d 1 9 7 0 8 0 0 0 6 7 9 3 6 0 3
Average for Ireland, 2 14 o
[image:7.366.69.332.44.359.2] [image:7.366.73.327.372.534.2]£ 2 2 2 2 2 2 .• 3 ... 3 ... 3 - 3 ••. 3 .. 3 3 ... 3 ... 4 - 4 ... 6 s. 16 16 17 18 18 19 3 8 1 0 1 1 1 1 1 2 1 2 16 5 1 1 6 d. 0 0 7 0 1 0 4 0 9 0 4 6 0 0 9 0 2 0 TABLE VI.
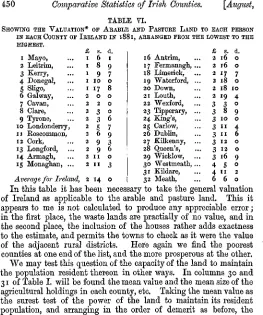
SHOWING THE VALUATION* OF AEABLE AND PASTUEB LAND TO EACH PERSON IN EACH COUNTY OF IRELAND IN 188 I, ARRANGED FROM THE LOWEST TO THE HIGHEST.
£ s. rl
16 Antrim, 17 Fermanagh, . 18 Limerick, 19 Waterford, 20 Down, 21 Louth, 22 Wexford, 23 Tipperary, 24 King's, 25 Carlow, 26 Dublin, 27 Kilkenny, 28 Queen's, 29 Wicklow, 30 Westmeath, . 31 Kildare, 32 Meath,
In this table it has been necessary to take the general valuation of Ireland as applicable to the arable and pasture land. This it appears to me is not calculated to produce any appreciable error; in the first place, the waste lands are practially of no value, and in the second place, the inclusion of the houses rather adds exactness to the estimate, and permits the towns to check as it were the value of the adjacent rural districts. Here again we find the poorest counties at one end of the list, and the more prosperous at the other. We may test this question of the capacity of the land to maintain the population resident thereon in other ways. In columns 30 and 31 of Table I. will be found the mean value and the mean size of the agricultural holdings in each county, etc. Taking the mean value as the surest test of the power of the land to maintain its resident population, and arranging in the order of demerit as before, the result is Table VII.
TABLE VII.
SHOWING MEAN VALUE OF HOLDINGS IN EACH COUNTY OF IRELAND IN 1881, ARRANGED FROM THE LOWEST TO THE HIGHEST.
i Mayo, 2 Donegal, 3 Leitrim, 4 Kerry, 5 Galway, 6 Sligo, 7 Cavan, 8 Roscommon, 9 Monaghan, IO Tyrone, I I Armagh, 12 Fermanagh, 13 Londonderry, 14 Longford, 15 Clare,
Average for Ireland,
1883.]
By T. W. Grimshaw, M.A. M.D.
451 The likeness of Table VII. to the arrangement of the preceding tables is manifest.Now as a still further test of the maintaining power of the land in its relation to the population, the average size of the holdings must be taken into consideration. This element is dealt with in columns 32 to 38 inclusive of Table I.
It has always been a difficult, and 1 think must still be considered an unsolved question: What is the smallest area of average land which will support an Irish family dependent upon agriculture as a means of subsistence 1 I do not profess to be able to answer this question, but for many reasons which I cannot here discuss, I have classified holdings into those above thirty acres and those under thirty acres, the latter being taken to mean " small holdings," and the holders therefore small agriculturists and persons whose means of subsistence are of a very narrow character. I am aware that some think this line should be drawn at fifteen acres, and for the information of these I have provided column 32, Table L; but I must say that I cannot myself draw any conclusion, which I con-sider of value, from the information contained in this column. I therefore now call attention to Tables VIII. and IX. In Table VIII. the counties are arranged according to the proportion per cent, of holdings under thirty acres, and, as usual, we here find several of the poor western counties near the head of the list.
TABLE VIII.
SHOWING THE PER-CENTAGE OF HOLDINGS NOT EXCEEDING THIRTY ACRES IN EACH COUNTY IN IRELAND IN 188 I, ARRANGED FROM THE HIGHEST TO THE LOWEST.
1 Armagh, 2 Monaghan, 3 Roscommon, 4 Mayo, 5 Sligo, 6 Leitrim, 7 Cavan, 8 Galway, 9 Louth, 10 Down, 11 Longford, 12 Londonderry, 13 Tyrone, 14 Donegal, 15 Dublin,
Per cent. 89-S 86.6 85.2 85.0 83.0 81 2 80.6 79-4 78.9 78.8 75-8 73-8 73.2 72.1 71.5
Average for Ireland, 69.9
16 Fermanagh, 17 Westmeath, 18 Antrim, 19 Queen's, 20 King's, 21 Kildare, 22 Meath, 23 Wexford, 24 Kilkenny, 25 Tipperary, 26 Clare, 27 Carlow, 28 Limerick, 29 Waterford, 30 Kerry, 31 Wicklow, 32 Cork,
Per cent. 69.4 69.4 67.2 67.o 66.9 65.2 64.6 55-9 55-7 55.o 54-9 544 S2.5 49.9 49.6 46.9 49-3
When we look at Table IX. dealing with the value of these small holdings, the arrangement is still more remarkable. Here we find seven out of the eight western counties at the head of the list.
452 Comparative Statistics of Irish Counties., [August\
TABLE IX.
SHOWING THE AVERAGE VALUATION I N POUNDS OF EACH HOLDING NOT EXCEEDING 3 0 ACRES IN EACH COUNTY IN IRELAND IN l 8 8 l , ARRANGED FROM THE LOWEST TO THE HIGHEST.
1 Mayo, 2 Galway, 3 Donegal, 4 Kerry, 5 Leitrim, 6 Roscommon, 7 Sligo, 8 Kildare, 9 King's, 10 Queen's, 11 Clare, 12 Carlow, 13 Kilkenny, 14 Longford, 15 Westmeath, 16 Wexford, 17 Tipperary, 18 Waterford,
It will be observed that while Armagh and Monaghan stand at the minimal end of Table VIII., having the largest proportion of small holdings, they stand near the maximal end when the value of these holdings is dealt with in Table IX. Thus, the greater value of the land in Armagh and Monaghan mitigates the poverty which would otherwise arise among the small farmers, owing to the diminutive size of their holdings.
The last point which I shall refer to regarding the land is its average worth in each county as measured by the value per acre. This is shown in column 39, Table L, and the counties are arranged in the order of the average value of their area in Table X.
TABLE X.
SHOWING THE AVERAGE VALUATION* IN 188I, PER STATUTE ACRE, FOR EACH £ 4 5 5 5 .. 6 6 7 7 7 7 7 8 8 8 8 8 0 5 8 £
Average for Ireland, 8
19 Louth, 20 Meath, 21 Wicklow, 22 Limerick, 23 Cavan, 24 Londonderry, 25 Tyrone, 26 Cork, 27 Fermanagh, 28 Monaghan, 29 Armagh, 30 Down, 31 Antrim, 32 Dublin, 9 9 9 9 9 9 9 1 0 1 0 1 0 1 1 1 2 • 13 • 23
COUNTY IN IRELAND, , 1 Mayo, 2 Kerry, 3 Donegal, 4 Galway, 5 Leitrim, 6 Clare, 7 Sligo, 8 Roscommon, 9 King's, 10 Wicklow, 11 Fermanagh,.. 12 Tyrone, 13 Longford, .. 14 Queen's, 15 Cavan, 16 Wexford, .. 17 Cork, 18 Tipperary, ..
£ 0 0 0 0 0 0 0 0 0 0 0 0 0 0 0 0 0 0
ARRANGED PROM THE LOWEST TO THE HIGHEST. s. 5 5 5 6 7 8 9 1 0 1 0 1 1 1 1 i r 1 2 1 2 1 2 13 13 13 d. 0 0 0 0 0 0 0 0 0 0 0 0 0 0 0 0 0 0
19 Kilkenny, ... 20 Waterford, ...
Average for Ireland,
21 Carlow, 22 Westmeath,... 23 Londonderry, 24 Kildare, 25 Limerick, 26 Monaghan, ... 27 Meath, 28 Louth, 29 Down, 30 Armagh, 31 Antrim, 32 Dublin, £ s. 0 14 0 14 0 14 0 '5 0 15 0 is 0 16 0 16 0 17 0 19 1 3 1 5 1 7 1 14 6 2 d. 0 0 0 0 0 0 0 0 0 0 0 0 0 0 0
1883.] By T. W. Grimshaw, M.A. M.D. 453 Now here we find the valuation ranging from but five shillings per acre in Mayo, Kerry, and Donegal, to thirty-four, and one hun-dred and twenty-two in Antrim and Dublin—these latter being influenced by the presence of great towns; excluding these, the contrast between the western counties at the head of the list, and those agricultural counties towards the other end of the table, is very remarkable, as, for instance, the contrast between five shillings per acre in Mayo, and nineteen shillings per acre in Meath. It will be observed thai: the eight counties at the minimal end of Table X. are those which constitute the western portion of Ireland.
Now leaving these statistics which relate especially to land, we come to those dealt with in columns 40 to 46 inclusive of Table I. The information contained in columns 40 to 43 is of special interest when compared with the land statistics comprised in the columns im-mediately preceding. These columns relate altogether to the migratory agricultural labourers—"harvestmen" as they are popularly called— in the years 1841 and 1881. Columns 40 and 41 show that the cus-tom of visiting England and Scotland to assist in harvest operations was almost universal in Ireland in the year 1841, and that in that year the number for the County of Dublin alone reached 5,625 or 15.1 per 1,000 of the population; while in 1881 the number for the same County was but 65 or o. 2 per 1,000 of the population. A similar decrease has taken place generally throughout Ireland; but in those counties which are shown by the previous tables to possess the poorest soil and the least means of subsistence, the decrease is less in proportion, and in the County of Mayo the number is actually proportionately greater than it was forty years ago—the absolute number being almost the same; namely—10,430 in 1841, and 10,742 in 1881, the proportion to the population having increased from 26.9
per 1,000 in 1841, to 43.8 per 1,000 in 1881.
In Table XI. the results are given for 1881 and the counties arranged in order. Here, again, we find six of the eight western
TABLE XI.
SHOWING THE EATE PER 1,000 OP THE POPULATION OF MIGRATORY AGRICULTURAL LABOURERS IN 1881, FOR EACH COUNTY OF IRELAND, ARRANGED FROM THE HIGHEST TO THE LOWEST.
1 Mayo, 2 Roscommon, 3 Galway, 4 Leitrim, 5 Sligo, 6 Donegal,
Average jor Ireland,
7 Armagh, 8 Monaghan, 9 Longford, 10 Louth, 11 Cavan, 12 Meath, 13 Tyrone, 14 Fermanagh, 15 Down,
1 4 3
13.1
9-7
8.0
7-6 7.2
4.1
3.6 3.6
3-1 2.8 2 . 3 1.6 i . 5 1 . 0
0.9
16 Londonderry, 17 Waterford, 18 Kilkenny, 19 Kerry, 20 Antrim, 21 Cork, 22 Tipperary, 23 Westmeath, 24 Carlow, 25 Wicklow, 26 Limerick, 27 Wexford, 28 King's, 29 Dublin, 30 Clare, 31 Queen's, 32 Kildare,
0.8 0.6
0.4 0.4 O-3 0.3
454 Comparative Statistics of Irish Counties. [August, counties heading the list, and showing by the proportion of migratory-labourers furnished by each, that the means of subsistence and em-ployment at home are insufficient for the support of the population* In Mayo not less than 14.3 per cent, of the adult male population went to England last year (188 2) to earn the balance of their means of living. Leaving this peculiar feature in the occupation of the western peasantry of Ireland, and turning to those occupations which afford the usual means of subsistence, we find the occupations of the people in 1881 set out in columns 44, 45, and 46 of Table I. under three great heads of occupation. In Tables XII., XIII., and XIV. the counties are arranged in order according to the proportional number of persons employed in each class of pursuit.
TABLE XII.
SHOWING THE AVERAGE NUMBER OF PERSONS TO EVERT 1,000 OF THE POPULATION OF EACH COUNTY IN IRELAND, I N 188 I , BELONGING TO THE COMMERCIAL CLASS, ARRANGED FROM THE LOWEST TO THE HIGHEST.
1 Leitrim, 2 Longford, 3 Cavan, 4 Mayo, 5 Roscommon, 6 Fermanagh, 7 Monaghan, 8 Clare, 9 Donegal, 10 Tyrone, 11 Galway, 12 King's, 13 Meath, 14 Queen's, 15 Westmeath, 16 Kerry, 17 Sligo, 18 Carlo w,
No.
2
3 3 3 3 4 4
5
s
5 5
6 6 6 6 6
7
8
19 Kilkenny, 20 Tipperary, 21 Armagh, 22 Kildare, 23 Wexford, 24 Wicklow, 25 Limerick,
Average for Ireland
26 Down, 27 Londonderry, 28 Cork, 29 Louth, 30 Waterford, 31 Antrim, 32 Dublin,
No. 8 9 9
1 0 1 2 1 2
J4
16 . 16 • 19 2 1 • 23
. 27
• 4 8
TABLE XIII.
SHOWING THE AVERAGE NUMBER OF PERSONS I N EVERY 1,000 OF THE POPULATION OF EACH COUNTY IN IRELAND IN 1881, BELONGING TO THE AGRICULTURAL CLASS, ARRANGED FROM THE LOWEST TO THE HIGHEST.
1 Dublin, 2 Antrim, 3 Cork, 4 Down, 5 Limerick, 6 Louth, 7 Waterford, 8 Armagh,
Average for Ireland,
9 Kerry, 10 Kildare, 11 Londonderry, 12 Wicklow, 13 Tipperary, 14 Sligo, 15 Kilkenny,
No.
34 99 164 165
171
173
1 8 1
186
193
2 0 0 2 0 1 2 0 5 2 1 4 217 2 2 7 2 2 8
16 Clare, 17 Carlow, 18 Meath, 19 Wexford, 20 King's, 21 Eoscommon, 22 Galway, 23 Mayo, 24 Westmeath, 25 Longford, 26 Tyrone, 27 Queen's, 28 Fermanagh, 29 Leitrim, 30 Donegal,
2,1 Cavan, *
32 Monaghan,
No. . 229 .. 234 • 238 • 239
2 4 0 2 4 1
1883.]
By T. W. Grimshaiu, M.A. M.D.
455TABLE XIV.
SHOWING THE AVERAGE NUMBER OF PERSONS TO EVERT 1,000 OF THE POPULATION OF EACH COUNTY IN IRELAND, IN 1881, BELONGING TO THE INDUSTRIAL CLASS, ARRANGED FROM THE LOWEST TO THE HIGHEST.
1 Mayo, 2 Leitrim, 3 Roscommon, 4 Cavan, 5 Galway, 6 Sligo, 7 Kerry, 8 Longford, 9 Monaghan, 10 Clare, 11 Fermanagh, 12 Westmeath, 13 Queen's, 14 Wicklow, 15 Meath, 16 Tipperary, 17 Donegal, 18 King's,
No. 50
55
... 63 ... 67
68 ... 76 ... 78 ... 79 8r» ... oO
82 ... 87 95 ... 98 1 0 1 1 0 1 1 0 2
103 IO3
19 Carlow, 20 Kilkenny, 21 Wexford, 22 Kildare, 23 Limerick, 24 Cork, 25 Tyrone, 26 Waterford,
Average Jor Ireland,
27 Louth, 28 Londonderry, 29 Armagh, 30 Dublin, 31 Down,
32 Antrim, , .
No 104 108 109
ll5
1 2 1 1 2 2
126 127
134
151 167 2 1 4 223 232 274
A glance at these tables will show the extraordinary want of employment that must exist in some of the counties. It will be seen that in some, where the proportion of persons employed in commerce and manufactures is extremely small, this want of occupation is not sufficiently counterbalanced by an unusually large amount of em-ployment in agricultural pursuits, and, therefore, the occupation of migratory labourer, already referred to, comes in to make up the deficiency.
I now come to deal with the last group of statistics in Table I., that relating to education, contained in columns 47 to 52 inclusive. The test usually applied to measure the state of education in Ireland is the number above the age of five years who are able to read. No doubt five years is a low limit \ but as it applies equally over the whole country, for my present purpose it is accurate. On the other hand, the ignorance of the people is tested by their inability to read; and I have preferred illiteracy to knowledge as a test of education, in order to render the figures more easily comparable with the tests of backward civilization which, I regret to say, have of necessity chiefly constituted the illustrations derived from the statistics before us.
456 Comparative Statistics of Irish Counties. [August,
TABLE XV.
SHOWING THE PEOPOETION PEE CENT, OF PEESONS OF FIVE YEAES OLD AND UPWAEDS, IN EACH COUNTY OF lEELAND, IN 1 8 8 1 , WHO COULD NEITHEE BEAD NOE WEITE, AEEANGED FEOM THE HIGHEST TO THE LOWEST.
i Galway, 2 Mayo," 3 Donegal, 4 Waterford, 5 -Kerry, 6 Sligo, 7 Louth, 8 Cork, 9 Eoscommon, io Clare, I I Wexford,
Average for
12 Limerick, 13 Westmeath, 14 Meath, 15 Longford,
Rate per cent. 45.8 44.8 - 39-8 36.9 35-i 30.9 29.4 28.8 27.3 27.3 ... 25.6
Ireland, 25.2
24.0 23.4 23.4 23.1
16 Monaghan, 17 Armagh, 18 Tyrone, 19 Leitrim, 20 Cavan, 21 King's, 22 Kilkenny, 23 Tipperary, 24 Wicklow, 25 Fermanagh, 26 Queen's, 27 Kildare, 28 Carlo w, 29 Londonderry, 30 Dublin, 31 Down, 32 Antrim,
Rate per cent. 23.0 22.6 22.6 22.5 22.4 22.3
22.O
21.7 21.7 21.5 2O.4 20.2 19.8 17.6 14.5 14.3
I2.I
A point closely bearing upon education is the distribution of the Celtic speaking population throughout Ireland, and I regret to say there is a close parallelism between the proportion of Irish speaking people and illiterate people in the various counties. This will be evident if Table XV. be compared with XVL, which is con-structed from the information contained in column 52 of Table I.
TABLE XVL
SHOWING THE AVEEAGE NUMBEE OF PEESONS TO EVEEY 1,000 OF THE POPULATION IN EACH COUNTY O F IEELAND I N 1881, WHO COULD SPEAK I E I S H , AEEANGED FEOM THE HIGHEST TO THE LOWEST.
1 Galway, 2 Mayo, 3 Kerry, 4 Clare, 5 Waterford, 6 Cork, 7 Donegal, 8 Sligo,
No. 642 602 494 460 458 350 348 286
A verage for Ireland, 182
9 Limerick, 10 Eoscommon, 11 Tipperary, 12 Leitrim, 13 Kilkenny, 14 Louth, 15 Monaghan,
178 163
93 72 64
16 Cavan, 17 Tyrone, 18 Armagh, 19 Meath, 20 Londonderry, 21 Fermanagh, 22 Westmeath, 23 Dublin, 24 Longford, 25 Kildare, 26-King's, 27 Antrim, 28 Wexford, 29 Queen's, 30 Carlow, 31 Down, 32 Wicklow,
No
54 5o 4 2 4 0 2 2 '5 1 2 1 2 1 1
8
1
6
4 4 4 3 3
1883.]
By T. W. Grinishaw, M.A. M.D.
457 selection of standards wherewith to test the social conditions I have been dealing with, I determined to try a statistical experiment, just as a physical scientist tests by experiment the truth of the results he has arrived at by arguments founded on physical laws. I there-fore proceeded in the following manner:—It is well known that during the period of distress in the winter of 1879-80, following the failure of the potato crop in 1879, and the extremely bad yield of the other crops during that disastrous year, the distress fell with special severity on particular districts. During that sad period of depression, I had the honour of being selected one of the honorary secretaries of the Duchess of Marlborough's fund; and it became my duty, in conjunction with my colleagues, to determine which districts were most in need of charitable aid. By information collected from various sources, and especially that obtained from the Local Govern-ment Board, we ascertained that if a line were drawn from London-derry to Skibbereen, it would roughly divide Ireland into districts; the district in urgent need of charitable assistance being situate to the "West of the line, and that to the East requiring comparatively little aid. Thus Ireland would be divided into two large social provinces, the Western being the less prosperous and always liable to distress, amounting in bad seasons to famine, the Eastern being the more prosperous. Practically the Western division includes the six counties on the Atlantic seaboard with Eoscommon and Leitrim; and the Eastern the rest of Ireland.Now it appeared to me that if the statistical facts which I have selected from Table I. and applied as tests of social condition were sound, then these tests when combined should produce a result which must place these eight counties in one group at the minimal end of a list representing the rate of prosperity, and the other counties should follow. The result is more remarkable, and a much nearer approach to accuracy than I anticipated. In order to carry out the experiment, I put all the thirty-two counties through what I may call a competitive examination under the fifteen heads which I have dealt with. In analysing Table L, I numbered the counties from 1 to 32, using the numbers denoting their order in the lists as examination marks of merit or, more generally, demerit. Now, if the numbers attached to each county as marks be added together—cross-totted—as in Table XVII., a new set of numbers, ranging from 65 to 332, will be obtained; if these be arranged from the lowest to the highest, we will find that—
If all the conditions which represent density of population in relation to productive land, scanty means of subsistence, and low standard of education, be added together, the result will be that the counties will be arranged in the following order :—
1 Mayo. 2 Sligo. 3 Donegal. 4 Galway. 5 Leitrim. 6 Roscommon. 7 Kerry. 8 Cavan.
9 Tyrone. 10 Armagh. 11 Longford. 12 Clare. 13 Monaghan. 14 Louth. 15 Fermanagh. 16 Londonderry.
17 Cork. 18 Wexford. 19 Waterford. 20 Down. 21 Limerick. 22 Kilkenny. 23 King's. 24 Westmeath.
458 Comparative Statistics of Irish Counties. [August, It will be observed that of the eight western counties seven are found at the head of the list, and that the eighth, the County of Clare, is found no further down than twelfth, and a reference to the "Total" column of Table XVII. will show that the total number of its marks varies but slightly from those which are interposed between it and Kerry, which stands seventh on the list.
Another mode in which the leading items in Table I. may be readily compared with one another is by the construction of a diagram representing the various conditions by curves placed one above the other, so as to facilitate comparison. I have had such a diagram constructed by Mr. George Dewar of my office, and it admirably and graphically illustrates the points dealt with in this paper.*
The result to which I have adverted was so surprisingly in accord-ance with the well-known condition of chronic poverty of the Western counties of Ireland, that I introduced two special lines of figures at the foot of Table I. giving particulars under each head for the Eastern and Western divisions of Ireland respectively. It would take too long to discuss the items concerning these divisions, and to compare one set with the other, or to enter into a comparison of the statistics of the four provinces of Ireland. I have, however, looked into these matters, and I trust that others may be induced by these remarks further to investigate the question. The object of this paper has been fulfilled if I have succeeded in attracting attention to these very valuable statistics, and suggesting methods by which they may be utilized as standards for measuring the many curious social con-ditions of Ireland. In conclusion, I have to thank those members of my official staff who have aided me in compiling these figures, and have especially to call attention to the valuable assistance I have received from Messrs. Wilson and O'Neill of the General Eegister Office.
TABLE XVII.
Summary exhibiting the Order of the 32 Counties as regards condition with respect to each of the subjects dealt with in Tables II. to XVI. with the
corresponding order shown by aggregating the several results for each county.
NAME OF ('OUSTS.
Number of Table ...
Lfinster Province. Cai'Iow. Dublin, Kildare, Kilkenny, King's, Longford, Loutli, Meath, Queen's, Westmeath, Wexford. Wicklow, JUititstrr J*rot:incc. Clare, Cork, Kerry, Limerick, Tipperary, Waterford, Ulster Province. Antrim, Armagh, Cavan, Donegal, Down, Fermanagh, Londonderry, Monaghan, Tyrone, Comwmght Province. Gal way, Lei trim, Mayo, Roscommon, Sligo, Decrease per cent, in
total population
between
w S i i ttnti , [ J A i
11. 31 2 8 *9 *7 23 13 3° 3 ' 26 12 17 28 '5 7 •9 3 2 16 1 S 22 6 4 2 0 3 25 1 0 18 •4 9 24 1 1 Emigration from tst May,
1851, t<> 3i>t l ) e c , 1SS1.
Bute per cent, of tbe population. III. 12 I 3 2 0 23 27 8 2 2 18 16 1 0 2 2 9 3° 2 8 3 ' 3 2 2 6 *4 9 2 5 6 7 i i •3 2 1 • 4 •7 •9 5 ' 5 4 Birth-place. Number in every i.oooof the population of tbe County
(in ISSI)
wbo were born therein. IV. 28 3 2 3 1 15 3 0 ' 4 26 2 0 •9 2 2 7 29 4 11 2 18 16 25 27 21 8 3 *4 17 2 3 13 12 S 6 1 1 0 •i Arabic and Pasture. Number of acres to each
person in 1881. V. 12 I 17 l 6 3° '7 5 3» 28 3< 33 29 2J 1 1 •9 15 24 12 2 3 13 •4 4 2 0 6 7 8 21 . 16 9 18 1 0 Valuation of Arable and Pasture Land to each person in 1881.
V I .
25 26 31 27 24 13 2 1 32 28 3° 2 2 29 8 12 3 18 23 •9 16 •4 7 4 2 0 ' 7 1 0 15 9 6 2 1 11 5 OBDEB OI Mean value of Holdings in ISSI. VII. 28 3 * 3° 2 4 16 ' 4 2 1 3» 17 25 '9 2 6 '5 2 2 4 27 23 29 2 0 1 1 7 2 18 1 2 >3 9 1 0 S 3 8 6 CODKTY AS Percentage of Holdings not exceeding thirty acres in 18S1.
V I I I .
27 >S 2 1 24 2 0 11 9 2 2 ' 9 17 23 3> 26 32 3° 28 25 29 18 1 7 14 1 0 16 1 2 2 13 8 6 4 3 5
REGARDS CONDITION WITH
Average valuation of each Holding not exceeding thirty acres in 1881•
I S .
1 2 32 8 ' 3 9 •4 ' 9 2 0 1 0 15 16 2 1 1 1 26 4 2 2 17 18 3 ' 29 23 3 3 " 27 24 28 25 2 5 ' 1 6 7 Average value of land per statute acre
in 1881.
X .
2 1 . i 2 24 ' 9 9 13 28 27 •4 2 2 16 1 0 6 17 2 25 18 2 0 3 ' 3° 15 3 29 11 23 26 1 2 4 5 1 8 7 RESPECT TO Migratory Labourers in 1881. Rate per i,ooo
of the population*
X I .
2 4 29 32 18 28 9 I O 1 2 31 23 27 25 3° 2 1 ' 9 26 2 2 «7 2 0 7 1 1 6 15 ' 4 16 8 13 3 4 1 2 5 Commercial Class. Average number of persons to
every 1,000 of
the population 111 1881. XIL 18 32 2 2 •9 1 2 2 29 13 ' 4 15 23 2 4 8 28 16 25 2 0 3° 31 2 1 3 9 26 6 27 7 1 0 11 1 4 5 »7 Agricultural Class. Average number of porsouBtoevery
1,000 of the
population in rSSt. xm. 17 1 0 '5 2 0 25 6 18 27 2 4 •9 1 ; 16 3 9 5 ' 3 7 2 8 3 1 3° 4 28 1 1 3 2 26 2 2 2 9 2 3 2 1 <4 Industrial Class. Average number of persons toevery
1,000 of the
population in 1881. XIV. ' 9 3 0 2 2 2 O 18 8 27 ' 5 i.i 12 2 1 ' 4 1 0 24 7 23 16 26 3 2 29 4 ' 7 31 1 1 28 9 2 5 5 2 1 3 6 Illiteracy. Among persons
five years old and upwards
in iSSt. Bate per cent.
XV. 28 3° 27 2 2 2 1 I J 7 14 26 >3 11 24 1 0 8
s
1 2 23 4 3* ' 7 2 0 3 3 t 25 29 16 18 1 ' 9 2 9 6 Irish-speaking persons in 1881. Average number of persons to every1.000 of the
population XVI. 3° 2.5 25 13 26 24 '4 ' 9 29 2 2 28 32 4 6 3 9 11 5 27 18 16 7 3 1 21 2 0 15 ' 7 1 12 2 1 0 8
Combination of the foregoing.
Total.
Order of County.
332 32
3 . 8 27 121 28 3O4 22
3>3 2 3 229 • '
243 ' +
327 3' 324 29
313 24
277 '8
3 2 5 3°
2.50 12
266 I ; 158 7 3O3 2 1 3 ' 5 26
283
3»4 " 3
i n
'I
72 8 4
'9 *5 1 0 8 3 2 0
256 ' 5 2j8 16 233 "3
2 2 2 n
129 4 143 5
65
153 6
1 2 0 2
S u m o r coiiSTT.