2 3 4 5 6 7 8 9 10 11 12 13 14 15 16 17 18 19 20 21 22 23 24 25 26 27 28 29 30 31 32 33 34 35 36 37 38 39 40 41 42 43 44 45 46 47
Numerical Investigation of Bubble Induced
Marangoni Convection
S ´eamus M. O’Shaughnessy and Anthony J. Robinson
Department of Mechanical & Manufacturing Engineering, Trinity College Dublin, Ireland
The liquid motion induced by surface tension variation, termed the thermocapillary or Marangoni effect, and its contribution to boiling heat transfer has long been a very controversial issue. In the past this convection was not the subject of much attention because, under terrestrial conditions, it is superimposed by the strong buoyancy convec-tion, which makes it difficult to obtain quantitative experimental results. The scenario under consideration in this paper may be applicable to the analysis of boiling heat transfer, specifically the bubble waiting period and, possibly, the bubble growth period. To elucidate the influence of Marangoni convection on local heat transfer, this work numerically investigates the presence of a hemispherical bubble of constant radius,
Rb =1.0 mm, situated on a heated wall immersed in a liquid silicone oil (Pr= 82.5) layer of constant depthH=5.0 mm. A comprehensive description of the flow driven by surface tension gradients along the liquid–vapor interface required the solution of the nonlinear equations of free-surface hydrodynamics. For this problem, the procedure in-volved solution of the coupled equations of fluid mechanics and heat transfer using the finite-difference numerical technique. Simulations were carried out under zero-gravity conditions for temperatures of 50, 40, 30, 20, 10, and 1 K, corresponding to Marangoni numbers of 915, 732, 550, 366, 183, and 18.3, respectively. The predicted thermal and flow fields have been used to describe the enhancement of the heat transfer as a result of thermocapillary convection around a stationary bubble maintained on a heated surface. It was found that the heat transfer enhancement, as quantified by both the radius of enhancement and the ratio of Marangoni heat transfer to that of pure molecular dif-fusion, increases asymptotically with increasing Marangoni number. For the range of Marangoni numbers tested, a 1.18-fold improvement in the heat transfer was predicted within the region ofRb≤r≤7Rb.
Key words: Marangoni; thermocapillary; convection; bubble; microgravity; heat transfer; numerical
Nomenclature
Bo Bond number
Cp specific heat [J·kg−1K−1]
H liquid layer height [m]
k thermal conductivity [W·m−1K−1]
Ma Marangoni number
n unit normal vector
p pressure [N·m−2]
Pr Prandtl number
Address for correspondence: Dr. Anthony J. Robinson, Department of Mechanical & Manufacturing Engineering, Parsons Building, Trinity College, Dublin 2, Ireland. Voice:+353 1 896 3919. arobins@tcd.ie
q heat flux [W·m−2]
r radial direction [m]
Rb bubble radius [m]
Reff effective radius [m]
Renhancement enhancement radius [m]
T temperature [K]
v velocity [m·s−1]
x axial direction [m]
Greek Symbols
α thermal diffusivity [m2·s−1]
difference
θ azimuthal direction [rad]
μ dynamic viscosity [kg·m−1s−1]
ρ density [kg·m−3]
Interdisciplinary Transport Phenomena V: Ann. N.Y. Acad. Sci. xxxx: 1–17 (2009). doi: 10.1111/j.1749-6632.2008.04332.x C 2009 New York Academy of Sciences.
2 3 4 5 6 7 8 9 10 11 12 13 14 15 16 17 18 19 20 21 22 23 24 25 26 27 28 29 30 31 32 33 34 35 36 37 38 39 40 41 42 43 44 45 46 47
σ surface tension [N·m−1]
τ shear stress [N·m−2]
υ kinematic viscosity [m2·s−1]
Subscripts
2D two-dimensional
3D three-dimensional
c cold side
cond conduction
crit critical point property
h hot side
Ma Marangoni
oil oil property
r radial
w wall
x axial
Introduction
Most natural convection processes in terres-trial environments are buoyancy driven and caused by unstable density gradients that are due to temperature differences within the sys-tem.1 The presence of a liquid–vapor
inter-face subject to a temperature gradient can initiate another form of natural convection, which is independent of gravitational accelera-tion and therefore the only natural convecaccelera-tion mechanism for microgravity applications. This other mode of convection is dependent on sur-face tension variations with temperature and is termed thermocapillary convection and/or thermal Marangoni convection.
The temperature dependence of surface ten-sion was described by Straub2 and Larkin.3
At a liquid–vapor interface, attractive forces among liquid molecules cause surface tension effects. These interfacial tension forces increase or decrease with temperature, depending on the working fluids. In most cases, higher tem-peratures cause a reduction in strength of the intermolecular forces that bind the liquid to-gether at the surface. The surface tension con-sequently decreases and becomes equal to zero at a critical temperatureTcrit. If a temperature gradient is present at the surface, local stresses
diminish toward the hot side and intensify to-ward the cold side. The surface tension varia-tion induces a “tank-treadlike” movaria-tion of the vapor–liquid interface that, owing to the no-slip condition, causes a convective flow tangen-tial to the interface. For the case of a bubble affixed to a heated surface, the thermocapil-lary or Marangoni convection can influence the wall heat transfer by acting as a pump that transports hot fluid near the wall into the cool bulk liquid, as depicted in Figure 1.
For Marangoni convection around a bub-ble of radiusRbwithin a channel of heightH, the mass and heat transport mechanisms are characterized by the Prandtl and Marangoni numbers, defined, respectively, as4–6:
Pr= υ
α (1)
M a = −
∂σ ∂T
×Th −Tc
μα ×
R2b
H (2)
The Prandtl number represents the ratio of vis-cous to thermal diffusivity in the fluid, and may be assumed constant for a particular liquid if variations in viscosity and thermal diffusivity with temperature can be neglected, as is the case in this study. The Marangoni number rep-resents the ratio of heat transfer by convec-tion to that by conducconvec-tion and is synonymous with the Peclet number. In experimental inves-tigations, Ma is typically varied by changing the temperature difference within the system or by varying the height of the test domain channel. The latter method is sometimes the preferred approach as it prohibits any change in thermophysical conditions due to changing temperatures.
2 3 4 5 6 7 8 9 10 11 12 13 14 15 16 17 18 19 20 21 22 23 24 25 26 27 28 29 30 31 32 33 34 35 36 37 38 39 40 41 42 43 44 45 46 47
Figure 1. Surface-tension-induced flow around an air bubble at a heated wall.
condensation phenomena, the mechanisms of heat transfer are still poorly understood in the sense that predictive capabilities of theories and empirical correlations break down quickly once outside the parameter range in which they were developed.7,8For both terrestrial and space
ap-plications, research has indicated that the often neglected Marangoni convection may play an important role in the heat transfer during phase change processes.2,9,10
Thermocapillary convection has been the subject of some experimental work. Much of the recent literature focuses on flow analysis techniques and flow imaging of thermocapil-lary convection. Wozniak and colleagues11–13
utilized particle-image-velocimetry and liquid-tracer techniques as well as interferometry to investigate the flow field resulting from the pres-ence of a bubble in a fluid test cell with an ap-plied temperature gradient under both terres-trial and microgravity conditions. Priedeet al.14
studied the effect of a free-surface contami-nant in liquid semiconductors, highlighting an increase in surface tension with temperature, which resulted in an anomalous flow direction. There have also been analytical studies of ther-mocapillary convection concerned specifically with the temperature–velocity coupling at low Marangoni numbers.15,16
Younget al.17were the first to examine the
ef-fect of spherical free surfaces in the presence of a temperature gradient. They discovered that small air bubbles in a liquid sample could be
held stationary or even driven against gravity with a sufficiently strong temperature gradient in the direction adverse to gravity. This was at-tributed to the variation in surface tension along the bubble surface, a condition caused by varia-tions in the temperature field of the fluid. Some years later, McGrew et al.18 argued that high boiling heat transfer rates are due to intense vapor bubble agitation of the liquid boundary layer close to the heating surface and bulk liquid disturbance due to bubble detachment from the surface. Utilizing tracer particles to observe the flow pattern around air bubbles placed on the heating surface and vapor bubbles produced during boiling, they conducted experiments in which the liquid was heated from above and cooled from the bottom, with slowly increasing heat flux levels. The flow profiles were identi-cal for both air and vapor bubbles. They con-cluded that Marangoni convection would occur around any bubble present in a region subjected to a temperature gradient. They also suggested that this served as a primary factor in the heat transfer mechanism in those situations in which bubbles remained attached to the surface for relatively long periods of time.
2 3 4 5 6 7 8 9 10 11 12 13 14 15 16 17 18 19 20 21 22 23 24 25 26 27 28 29 30 31 32 33 34 35 36 37 38 39 40 41 42 43 44 45 46 47
wall before being dragged along the bubble, fi-nally leaving the bubble as a jet, the strength of which increased with increasing Marangoni number. Larkin investigated the influence of the surface-tension-driven flow on the Nusselt number, concluding that above a Marangoni number of 105, an increase in the rate of heat transfer of 30% was achievable. It was assumed that until this critical Marangoni number was reached, thermocapillary convection was not an important heat transfer mechanism. Unfor-tunately, owing to computational limitations of the time, Larkin was unable to continue the solution to steady state.
Later, Straubet al.9produced surprising re-sults that indicated that the heat transfer co-efficients measured for nucleate boiling in mi-crogravity were similar in magnitude to those measured for terrestrial gravity. Since the mi-crogravity experiments rule out buoyant natu-ral convection as a heat transfer mechanism in the regions on the heated surface where bubble activity is not influential, Straubet al.proposed that the results could be attributed to the pres-ence of thermocapillary convection.
Arlabosseet al.5investigated experimentally the contribution of Marangoni convection to heat transfer around bubbles attached to a heated surface within a channel. A test cell con-sisting of an upper heated flat plate, a lower cooled plate and plexiglass walls enclosed a sil-icone oil layer, into which an air bubble was injected and maintained on the upper heated surface. Tests were carried out for Prandtl num-bers of 220, 440, and 880, and for a range of Marangoni numbers from 0 to 600. From the results obtained, it was determined that the ra-tio of heat transfer by Marangoni convecra-tion to that solely by conduction was well correlated by the relation
qMa
qcond =1+0.00841M a
0.5 (3)
In a similar study, Reynardet al.8,19performed experiments on test fluids of silicone oil with Prandtl numbers of 16.3 and 228 and FC-72 of
Prandtl number 12.3, investigating the onset of the 3D oscillatory thermocapillary convection and the effect of test cell height.
Petrovicet al.10carried out experiments in
or-der to examine the contribution of Marangoni convection to the rate of heat transfer in sub-cooled nucleate pool boiling using distilled wa-ter heated on a copper heawa-ter surface at atmo-spheric pressure and subcooling levels of 40◦, 50◦, 60◦, and 70◦C. The surface heat flux was incrementally increased from zero to a value sufficiently high to induce nucleate boiling. As the surface heat flux was increased for fixed liq-uid subcooling, the surface temperature contin-ually increased and buoyant natural convection was the sole mechanism of heat transfer. How-ever, at a critical surface heat flux, large and stationary air bubbles formed spontaneously Q1
on the surface with a significant increase in the heat transfer coefficient. The heat transfer mechanism was determined to be Marangoni convection and the heat transfer measurements were in agreement with the relationship pro-posed by Arlabosse et al.5 for air bubbles of similar size, albeit in silicone oils.
Currently there is still very little quanti-tative information regarding the influence of Marangoni convection on the heat transfer that is due to bubbles fixed to heated surfaces. The objective of this paper is to provide preliminary numerical results that quantify the influence of Marangoni convection on the local and surface average wall heat transfer. With the view of de-veloping the model for more complex situations such as nucleate pool boiling, this study consid-ers the simplified case of a 2.0-mm-diameter stationary and hemispherical air bubble im-mersed in silicone oil. The simulated test vessel consists of two isothermal surfaces spaced 5 mm apart and the simulations are carried out in microgravity.
Mathematical Formulation
2 3 4 5 6 7 8 9 10 11 12 13 14 15 16 17 18 19 20 21 22 23 24 25 26 27 28 29 30 31 32 33 34 35 36 37 38 39 40 41 42 43 44 45 46 47
convection is concerned with its possible cation to thermal management in space appli-cations. According to Bhunia and Kamotani,20 two-phase liquid control systems have been identified as a superior alternative to single-phase pumped liquid loops to meet the rising power demand for spacecraft thermal manage-ment. It is, however, impossible to separate the effects caused simultaneously by buoyancy and surface tension convection in experiments on earth. Owing to the high cost and limited avail-ability of microgravity experimentation, much of the work concerning thermocapillary con-vection has been implemented by numerical
Q2
methods.1–3,21,22 The accurate description of
flows driven by surface tension gradients along an interface generally requires the solution of the full three-dimensional nonlinear equations of free-surface hydrodynamics.22
For the problem considered here, the proce-dure involves solving simultaneously the cou-pled equations of fluid mechanics and heat transfer. For low enough Marangoni numbers it is known that the resulting flow field is sym-metric about the vertical bubble axis above the bubble centerline. Thus, a complicated and computationally expensive full 3D model is not utilized in favor of 2D axisymmetric formula-tions. From experimental observations,5,6,19 it is known that a strong jet-type flow is produced immediately after the appearance of a bubble on the surface. The liquid is projected verti-cally away from the center of the bubble with the colder liquid being drawn inward toward the heated surface and the regions of the bub-ble close to the heated surface.
The following work involves the numerical simulation of Marangoni convection and fo-cuses on the problem of thermocapillary flow induced by the presence of a hemispherical bubble attached to a heated planar surface. A two-dimensional axisymmetric model of the problem was formulated using the commer-cial software package FLUENT. The govern-ing equations that were solved were the steady-state continuity, momentum, and energy equations:
Continuity:
∂
∂x (ρvx)+
∂
∂r (ρvr)+ ρvr
r =0. (4)
Energy:
vx ∂T
∂x +vr
∂T
∂r =α
∂2T
∂x2 +
1
r
∂T
∂r +
∂2T
∂r2 . (5) Axial momentum: 1 r ∂ ∂x
rρvx2+1 r
∂
∂r (rρvxvr)= −
∂p
∂x +
1 r ∂ ∂x × rμ
2∂vx ∂x −
2 3(∇ · v)
+1 r ∂ ∂r × rμ
∂vx ∂r +
∂vr ∂x . (6) Radial momentum: 1 r ∂
∂x (rρvxvr)+
1
r
∂ ∂r
rρvr2= −∂p
∂r +
1 r ∂ ∂x × rμ
∂vr ∂x +
∂vx ∂r +1 r ∂ ∂r × rμ
2∂vr ∂r −
2 3(∇ · v)
−2μvr
r2
+2
3
μ
r (∇ · v). (7)
Here
∇ · v = ∂vx
∂x +
∂vr ∂r +
vr
r . (8)
In accordance with previous numerical in-vestigations on Marangoni convection, the fol-lowing assumptions are made in the analysis:
1. Motion is 2D axisymmetric in cylindrical coordinates.
2. A bubble can be represented by a hemi-spherical interface.
3. Heat flux is zero at the bubble interface. 4. Incompressibility of the liquid (ρ =
con-stant).
5. Constant physical properties [μ,k=f(T,
t. . .) etc.].
2 3 4 5 6 7 8 9 10 11 12 13 14 15 16 17 18 19 20 21 22 23 24 25 26 27 28 29 30 31 32 33 34 35 36 37 38 39 40 41 42 43 44 45 46 47
Since this work is approximate and not an exact numerical simulation, it is important to briefly discuss the major assumptions that were made during the physical modeling of the prob-lem, since they ultimately determine the useful-ness of any conclusions that are drawn from the results. The assumption that the flow is 2D is valid since it has been established that unsteady oscillatory and 3D flow occurs at a critical Marangoni number, Ma ∼ 12,000,23 which is considerably higher than the maxi-mum Marangoni number tested in this study.
Another major assumption is that the bub-ble interface maintained a spherical shape and did not deform from the presence of a pressure field. In order to determine the shape of the gas–liquid interface, two parameters are gener-ally required24; the size of the bubble or drop
and the contact angle. Experimental data con-cerning the material-dependent static contact angle for a 1.0-mm-radius air bubble immersed in silicone oil (Pr = 82.5) are not available. Thus, the concept of a macroscopic contact angle as discussed by Vafaei and Podowski24 is used. In that study, the gas–liquid contact angles were influenced by size and external conditions.
An example of this type of analysis can been seen in the work of Arlabosseet al.,5who noted that for their experiments, up to a radius of 1.3 mm, the bubble maintained a spherical shape. Under similar conditions, albeit at a lower Prandtl number, the bubble radius for this numerical study is 1.0 mm. Furthermore, in the work of Arlabosseet al.the macroscopic contact angle increased from 52◦ to 71.5◦for bubbles of equivalent radius 2.0 mm and 1.5 mm, re-spectively. This resulted in Bond numbers of approximately Bo = 0.64 and Bo = 0.36 for the 2.0 mm and 1.5 mm bubbles, respectively, which suggests that bubble size influences the contact angle and at lower values of the Bond number, bubbles tend toward a hemispherical shape. The Bond number for this study under conditions similar to those in Arlabosseet al.5is approximatelyBo=0.2, which suggests that a macroscopic contact angle of 90◦is reasonable.
As a means of provisionally investigating the in-fluence of the contact angle, some simulations were conducted for a 1.0-mm bubble with a contact angle of approximately 80◦. The differ-ence in the resulting heat transfer enhancement was found to be insignificant compared with the hemispherical bubble. Moreover, the present simulations are also performed under micro-gravity conditions, so there is no deformation of the interface from gravitational effects. Con-sistent with simulations performed by Straub2
and Larkin,3 a hemispherical bubble shape is employed.
Another key assumption that was made in developing the model was that no heat trans-fer occurred across the bubble interface. Thus the results presented herein are not immedi-ately applicable to nucleate pool boiling cir-cumstances, where evaporation at the interface creates a much more uniform temperature at the surface and thus acts to suppress the ther-mocapillary flow. The actual mechanism for the onset of thermocapillary flow during boiling is uncertain, although evidence seems to indicate that it is caused by variation in the evaporation and condensation heat transfer coefficient at the vapor–liquid interface,25–27which can
pos-sibly arise from the presence of noncondens-able gas.25,28,29Thus the assumption is consis-tent with the Marangoni heat transfer regime discovered by Petrovic et al.,10 where air bub-bles caused a significant enhancement in the heat transfer even when the heated wall tem-perature was below the saturation temtem-perature. The work is also qualitatively comparable to the situation of gas-saturated liquids, for example, the experimental results of Henry.29
Following these assumptions, it is possible to model thermocapillary convection caused by the bubble without modeling motion within the bubble itself. The bubble is represented by a boundary upon which a Marangoni stress is applied.
2 3 4 5 6 7 8 9 10 11 12 13 14 15 16 17 18 19 20 21 22 23 24 25 26 27 28 29 30 31 32 33 34 35 36 37 38 39 40 41 42 43 44 45 46 47
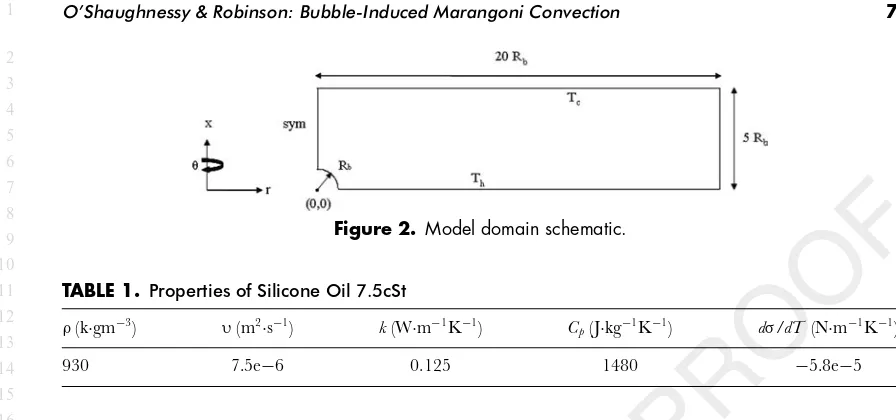
Figure 2. Model domain schematic.
TABLE 1. Properties of Silicone Oil 7.5cSt
ρ(k·gm−3) υ(m2·s−1) k(W·m−1K−1) C
p(J·kg−1K−1) dσ/dT (N·m−1K−1)
930 7.5e−6 0.125 1480 −5.8e−5
The two horizontal walls are separated by a distance H, which is equivalent to five times the bubble radius. The upper wall is no-slip, constant temperature:
v =0, T=T0 (9)
and is maintained at 300 K for all simulations. The lower horizontal wall is also no-slip, con-stant temperature:
v =0, T=T0 (10)
and the temperature of this wall is changed from one simulation to the next. The vertical wall placed 20 bubble radii from the center of the bubble has a no-slip, adiabatic condition:
v =0, n·(k∇T)=0 (11)
The bubble surface is comprised of a slip con-dition, an adiabatic concon-dition, and a directly applied Marangoni stress:
n· v =0, n·(k∇T)=0 (12)
τ= dσ
d T∇T, (13)
which relates the shear stress on the surface to the temperature derivative of surface tension. The test fluid was selected to have the same properties as silicone oil of kinematic viscos-ity 7.5cSt. The relevant physical properties are given in Table 1.
The commercial code FLUENT release 6.2.16 was utilized to solve the problem. From calculations of the Reynolds number, it was known that the resulting flow would be laminar. The segregated solver was selected on the ba-sis of computing power. The numerical scheme adopted was second order upwind. Solutions were carried out for temperature differences of 50, 40, 30, 20, 10, and 1 Kelvin, correspond-ing to Marangoni numbers of 915, 732, 550, 366, 183, and 18.3, respectively. Grid indepen-dence was achieved by increasing the number of quadrilateral cells from 1260 to 81,000, plot-ting the convergence of certain parameters of interest such as free surface velocity, and track-ing global parameters such as total rate of heat transfer through the system.
Numerical Validation
2 3 4 5 6 7 8 9 10 11 12 13 14 15 16 17 18 19 20 21 22 23 24 25 26 27 28 29 30 31 32 33 34 35 36 37 38 39 40 41 42 43 44 45 46 47
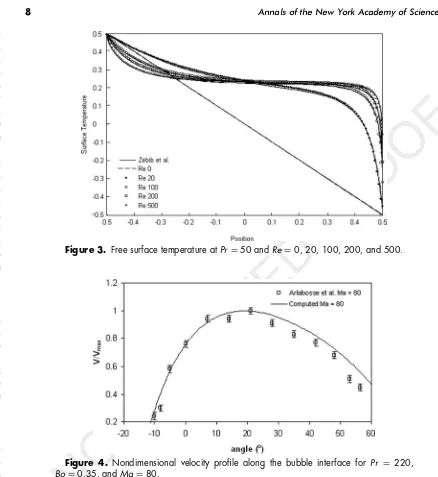
Figure 3. Free surface temperature atPr=50 andRe=0, 20, 100, 200, and 500.
Figure 4. Nondimensional velocity profile along the bubble interface for Pr = 220,
Bo=0.35, andMa=80.
Figures 4 and 5 show the comparison of the numerical simulations with the experimental data provided by Arlabosseet al.5Their
experi-mental data were obtained at terrestrial gravity for air bubbles affixed on the underside of a heated wall with the cooled wall below, such that buoyancy acted in opposition to the ther-mocapillary convection. In order to simulate this condition, the Boussinesq approximation was applied within FLUENT as a body force
FBon the right-hand side of the axial
momen-tum equation [Eq. (6)] and simulations forBo=
0.35,Pr=220, andMa=80 were carried out, where the Bond number is calculated from the expression
Bo= ρoilβoilg R 2
b ∂σ ∂T
(14)
2 3 4 5 6 7 8 9 10 11 12 13 14 15 16 17 18 19 20 21 22 23 24 25 26 27 28 29 30 31 32 33 34 35 36 37 38 39 40 41 42 43 44 45 46 47
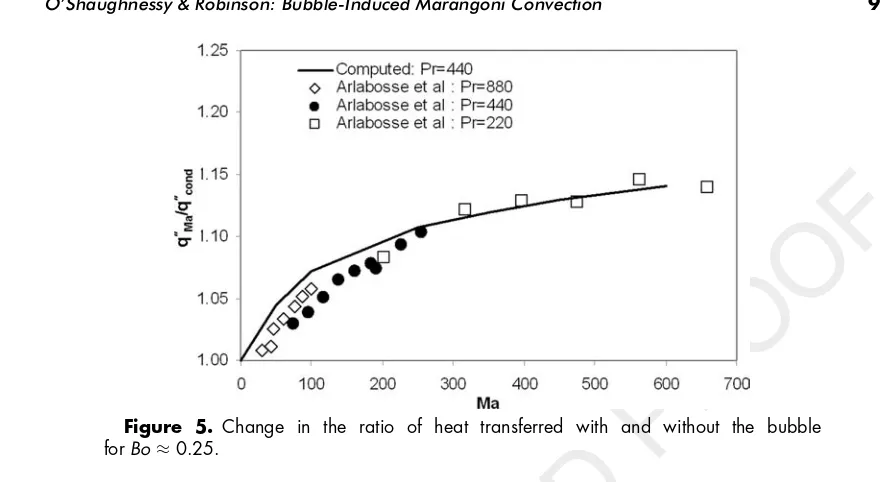
Figure 5. Change in the ratio of heat transferred with and without the bubble
forBo≈0.25.
velocity and the simulation is quite good. Any deviations are possibly due to small variations in the thermophysical properties with tempera-ture or the small difference in shape of the bub-ble in Arlabosse et al.,5 which, although very nearly hemispherical with a contact angle of 71.5◦, is slightly ellipsoidal.
Since the primary objective of this investi-gation is to quantify the local heat transfer behavior in the vicinity of bubbles affixed to a heated surface, it is imperative that the nu-merical simulations be validated against avail-able empirical heat transfer data. Utilizing a heat flux sensor glued to the cold wall below the bubble, Arlabosse et al.5quantified the in-crease in the average heat flux across the sen-sor situated on the wall opposite to that of the bubble. Comparison between the experimental and numerically simulated heat flux enhance-ment ratio shown in Figure 5 is acceptable. For this comparison, the net power across a fixed area of 57 mm2was chosen to determine the heat flux for the simulations. This is the same, typical, active area of 10×10 mm2heat flux sensors as was used in that work. It should be noted that the Bond number for the ex-periments was Bo= 0.25, which corresponds to the small bubbles that retain their spherical shape,5which is consistent with the simulated geometry.
Results and Discussion
Marangoni Number=915
Figure 6 shows the temperature and velocity profile forMa =915. For the fixed geometry, this was the largest Marangoni number sim-ulated and corresponds to the largest temper-ature differential across the upper and lower plates. The vector plot details the motion of the fluid. The flow field consists of a major vortex that recirculates colder fluid from the upper re-gion, pulling it toward the hot surface to the point where the bubble meets the heated wall. Interestingly, the fluid begins to accelerate be-fore reaching the vapor–liquid interface. The fluid is then dragged along the bubble surface. In this region the highest velocities are found as the fluid is accelerated by surface tension effects. The fluid then leaves the bubble as a jet, which decelerates with increasing distance from the bubble. This type of flow pattern has been seen in various experiments.5,6,19
2 3 4 5 6 7 8 9 10 11 12 13 14 15 16 17 18 19 20 21 22 23 24 25 26 27 28 29 30 31 32 33 34 35 36 37 38 39 40 41 42 43 44 45 46 47
Figure 6. Temperature contours/velocity vectors forMa=915.
Figure 7. Surface heat flux along the heated wall.
to which subsequent conditions can be com-pared. Consistent with analytical predictions, the heat flux along the channel walls was con-stant in the absence of the bubble.
Figure 7 illustrates the heat flux profile along the heated wall caused by Marangoni convec-tion forMa=915. The heat flux from pure con-duction in the absence of the bubble is depicted by the horizontal dashed line. It is evident that the presence of the bubble causes a sharp in-crease in surface heat transfer in the immediate vicinity of the bubble. The peak heat flux oc-curs at a distance of just over two radii from the bubble. Moving further away from the bubble in the radial direction, the surface heat transfer decreases and eventually approaches the pure conduction heat flux as expected. Most impor-tantly, it is noted that significant heat
trans-fer enhancement is observed over a consider-able distance from the contact line, in this case nearlyr∼8Rb, which is significant.
2 3 4 5 6 7 8 9 10 11 12 13 14 15 16 17 18 19 20 21 22 23 24 25 26 27 28 29 30 31 32 33 34 35 36 37 38 39 40 41 42 43 44 45 46 47
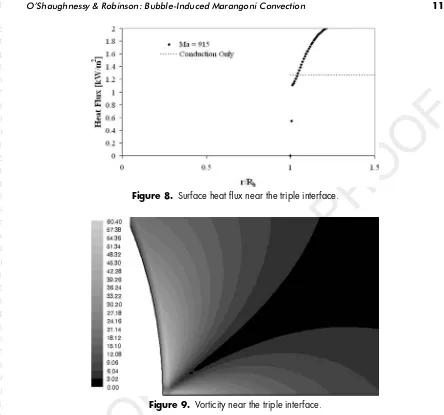
Figure 8. Surface heat flux near the triple interface.
Figure 9. Vorticity near the triple interface.
quite low in this region, the increased mixing associated with the high vorticity has the ef-fect of increasing the rate of heat transfer. In the near region, the vorticity drops dispropor-tionately to the increase in bulk convection. Af-ter this point the heat transfer begins to rise considerably as the primary and largely irro-tational vortex becomes the primary mecha-nism for heat transport. This is highlighted by the velocity vector plot shown in Figure 10. The no-slip wall boundary condition ensures that minimal fluid velocities are found near the triple interface. The geometry of the bubble causes a rotation in the fluid as it approaches the bubble. The no-slip point between the bub-ble and the wall results in a sudden and sharp
rotation of the fluid, resulting in high vorticity in this region. By comparing the vorticity and velocity plots it is evident that the region of low vorticity corresponds to the region where the velocity vectors travel mostly in the same di-rection. This region represents the bulk cooler fluid being recirculated from above by thermo-capillary convection.
Effect of Marangoni Number on Flow and Heat Transfer
Velocity and temperature data have been ob-tained for each of the six test cases.
2 3 4 5 6 7 8 9 10 11 12 13 14 15 16 17 18 19 20 21 22 23 24 25 26 27 28 29 30 31 32 33 34 35 36 37 38 39 40 41 42 43 44 45 46 47
Figure 10. Velocity near the triple interface: (A)T =50 K,Ma=915; (B)T =40 Q3
K, Ma=732; (C)T = 30 K,Ma= 550; (D)T = 20 K,Ma= 366; (E)T = 10 K,
Ma=183.
2 3 4 5 6 7 8 9 10 11 12 13 14 15 16 17 18 19 20 21 22 23 24 25 26 27 28 29 30 31 32 33 34 35 36 37 38 39 40 41 42 43 44 45 46 47
Figure 12. Velocity along bubble for varying Marangoni number.
Marangoni numbers. By applying the same temperature and stream function scales to each plot, it is evident that with decreasing tem-perature the thermocapillary effect decreases in strength. The plot for Ma = 18.3 is not presented as there is little distinguishable dif-ference for the selected grayscale. In particu-lar, the intensity of the jetlike flow diminishes with decreasing Marangoni number. The figure also shows the temperature contours, which are characteristic of this phenomenon. In the ab-sence of the bubble, the contours would form parallel vertical lines. This scenario is charac-teristic of conduction only flows and would also be seen far from the bubble. In the vicinity of the bubble, the temperature contours bend to-ward the heated wall. This is caused by the flow of cooler liquid toward the hot wall. The liquid jet, in flowing outward from the apex of the bubble, causes the temperature contours to project outward. The proximity of the upper wall, which has a no-slip condition, limits the extent the jet can travel in this scenario. From these images, it is evident that the thermocap-illary flow field is increasing heat transfer by stripping it from the wall in the vicinity of the bubble and convecting it into the bulk region above the bubble.
Figure 12 shows the velocity profile around the bubble for different Marangoni numbers. Angles are computed from the heated wall
to the center point of the bubble. The angle corresponding to maximum velocity decreases slightly with increasing Marangoni number. A possible explanation for this may be that with greater Marangoni number the surface tension gradients along the surface of the bubble are steeper, which accelerates the fluid moving to-ward the triple interface. The cooler fluid then encounters a region of high vorticity at the triple interface, which could cause the local fluid ve-locity to increase.
Enhancement of Heat Transfer
2 3 4 5 6 7 8 9 10 11 12 13 14 15 16 17 18 19 20 21 22 23 24 25 26 27 28 29 30 31 32 33 34 35 36 37 38 39 40 41 42 43 44 45 46 47
Figure 13. Hot wall heat flux enhancement.
Figure 14. Enhancement radius vs. Marangoni number.
Ma=915 seem to converge to theirqcondvalue at almost the same radial location of approx-imately r = 7Rb. Consequently, an enhance-ment range may be roughly defined. The en-hancement region appears to be nearly con-stant for a particular range of Marangoni num-bers tested, but may depend on the definition of the Marangoni number itself, in particular in the choice of length scale. Furthermore, in this study, the Marangoni number was chosen to include the height of the domain,H, as has been used in experimental practices.5,8,19The
enhancement region may be defined in terms of a radius measured outward from the center point of the bubble. The enhancement criterion for this investigation is defined as the location at which the heat transfer due to Marangoni
convection falls to within 5% of the value due to pure conduction, or equivalently
Renhancement =
r Rb
1.05×qcond
(15)
2 3 4 5 6 7 8 9 10 11 12 13 14 15 16 17 18 19 20 21 22 23 24 25 26 27 28 29 30 31 32 33 34 35 36 37 38 39 40 41 42 43 44 45 46 47
Figure 15. Heat transfer enhancement vs. Marangoni number.
effective radius of enhancement approaches an asymptotic value of approximately r ∼ 7Rb. Furthermore, the enhancement radius also im-plies that with increasing Marangoni number, the size of the main vortex does not increase greatly, but perhaps its intensity does, thus in-creasing local heat transfer. By defining an ef-fective radius and corresponding area of heat transfer such that
Reff =7Rb, Aeff =π R2eff −R
2
b
,(16)
the increase in total heat transfer relative to conduction can be expressed in terms of this value.
Figure 15 charts this increase versus Marangoni number. Following experimental investigations by Arlabosseet al.5 and Petrovic et al.,10a similar heat exchange correlation was derived:
qMa
qcond =1+0.005M a
0.5 (17)
When Ma=0 (without any temperature gra-dient or without a bubble)qMa/qcond=1, which corresponds to conductive heat transfer. It must be noted that the authors referenced in Arla-bosseet al.5studied the effective heat transfer on
the cooler wall away from the bubble. The co-efficient also depends on the choice of affected area.
Conclusions and Outlook
The influence of the Marangoni number on the local heat transfer in the vicinity of an air bubble with radius of 1 mm was investi-gated numerically for a liquid silicone oil layer (Pr = 82.5) of a constant depth of 5 mm, for Marangoni numbers in the range 0≤Ma≤915 under microgravity conditions. The increase in the local and surface average heat flux on the wall to which the bubble is attached was com-puted and it was determined that, compared to pure conduction, thermocapillary convection enhanced the local heat flux more than 65%. Q4
Furthermore, the enhanced heat transfer pene-trated a distance of approximately seven bubble radii. The numerical results indicate that the ratio of Marangoni heat transfer to conduction over the area of enhancement changes approx-imately with the square root of the Marangoni number. For the range of Marangoni numbers tested, an 18% improvement in the average heat transfer in the vicinity of the bubble was calculated.
2 3 4 5 6 7 8 9 10 11 12 13 14 15 16 17 18 19 20 21 22 23 24 25 26 27 28 29 30 31 32 33 34 35 36 37 38 39 40 41 42 43 44 45 46 47
be lifted and replaced with appropriate evapo-ration and condensation boundary conditions, perhaps similar to those suggested by Raj and Kim.25In the longer term it is expected that the
contribution of Marangoni convection to heat transfer during rapid bubble growth in boiling will be quantified.
Acknowledgments
This work was supported in part by the Irish Research Council for Science, Engineering and Technology (IRCSET) Embark Initiative.
Conflicts of Interest
The authors declare no conflicts of interest.
References
1. Betz, J. & J. Straub. 2001. Numerical and experimen-tal study of the heat transfer and fluid flow by thermo-capillary convection around gas bubbles.Heat Mass Trans./Waerme- und Stoffuebertragung37:215–227. 2. Straub, J. 1994. Role of surface tension for two-phase
heat and mass transfer in the absence of gravity.Exp. Thermal Fluid Sci.9:253–273.
3. Larkin, B.K. 1970. Thermocapillary flow around hemispherical bubble.AIChE J.16:101–107. 4. Arlabosse, P., N. Lock, M. Medale & M. Jaeger.
1999. Numerical investigation of thermocapillary flow around a bubble.Phys. Fluids11:18–29. 5. Arlabosse, P., L. Tadrist, H. Tadrist & J. Pantaloni.
2000. Experimental analysis of the heat transfer in-duced by thermocapillary convection around a bub-ble.J. Heat Trans.122:66–73.
6. Reynard, C., R. Santini & L. Tadrist. 2001. Experi-mental study of the gravity influence on the periodic thermocapillary convection around a bubble. Exp. Fluids31:440–446.
7. Marek, R. & J. Straub. 2001. The origin of ther-mocapillary convection in subcooled nucleate pool boiling.Int. J. Heat Mass Trans.44:619–632. 8. Reynard, C., R. Santini & L. Tadrist. 2003.
Exper-imental study of fluid-wall heat transfer induced by thermocapillary convection: Influence of the Prandtl number.C. R. Acad. Sci., Ser. IIb: Mec.331:237–244. 9. Straub, J., M. Zell & B. Vogel. 1993. What we learn
from boiling under microgravity.Microgravity Sci. Tech.
6:239–247.
10. Petrovic, S., T. Robinson & R.L. Judd. 2004. Marangoni heat transfer in subcooled nucleate pool boiling.Int. J. Heat Mass Trans.47:5115–5128. 11. Wozniak, G. 1999. Optical whole-field methods
for thermo-convective flow analysis in microgravity.
Meas. Sci. Technol.10:878–885.
12. Wozniak, K., G. Wozniak & T. Roesgen. 1990. Particle-image-velocimetry applied to thermocapil-lary convection.Exp. Fluids10:12–16.
13. Wozniak, G. & K. Wozniak. 1994. Buoyancy and thermocapillary flow analysis by the combined use of liquid crystals and PIV.Exp. Fluids17:141–146. 14. Priede, J., A. Cramer, A. Bojarevics,et al. 1999.
Ex-perimental and numerical study of anomalous ther-mocapillary convection in liquid gallium.Phys. Fluids
11:3331–3339.
15. Balasubramaniam, R. & R.S. Subramanian. 2004. Thermocapillary convection due to a stationary bub-ble.Phys. Fluids16:3131–3137.
16. Balasubramaniam, R. & R.S. Subramanian. 2003. Thermocapillary convection in a spherical container due to a stationary bubble.Adv. Space Res.32:137– 142.
17. Young N.O., J.S. Goldstein & M.J. Block. 1959. The motion of bubbles in a vertical temperature gradient.
J. Fluid Mech.6:350–356.
18. McGrew J.L., F.L. Bamford & T.R. Rehm. 1966. Marangoni flow: An additional mechanism in boiling heat transfer.Science153:1106–1107.
19. Reynard, C., M. Barthes, R. Santini & L. Tadrist. 2005. Experimental study of the onset of the 3D os-cillatory thermocapillary convection around a single air or vapor bubble: Influence on heat transfer.Exp. Thermal Fluid Sci.29:783–793.
20. Bhunia, A. & Y. Kamotani. 2001. Flow around a bubble on a heated wall in a cross-flowing liquid under microgravity condition.Int. J. Heat Mass Trans.
44:3895–9905.
21. Morris, C.J. & B.A. Parviz. 2006. Self-assembly and characterization of Marangoni microfluidic actua-tors.J. Micromech. Microeng.16:972–980.
22. Thess, A., D. Spirn & B. Juettner. 1997. Two-dimensional model for slow convection at infinite Marangoni number.J. Fluid Mech.331:283–312. 23. Kassemi, M. & N. Rashidnia. 1996. Bubble dynamics
on a heated surface. Presented at theThird Microgravity Fluid Physics Conference, Cleveland, Ohio.
24. Vafaei, S. & M. Z. Podowski. 2005. Theoretical anal-ysis on the effect of liquid droplet geometry on contact angle.Nucl. Eng Des.235:1293–1301,
2 3 4 5 6 7 8 9 10 11 12 13 14 15 16 17 18 19 20 21 22 23 24 25 26 27 28 29 30 31 32 33 34 35 36 37 38 39 40 41 42 43 44 45 46 47
26. Lu, J.F. & X.F. Peng. 2007. Bubble jet flow formation during boiling of subcooled water on fine wires.Int. J. Heat Mass Trans.50:3966–3976.
27. Wang, H., X.F. Peng, D.M. Christopher,et al. 2005. Investigation of bubble-top jet flow during subcooled boiling on wires.Int. J. Heat Fluid Flow26:485–494. 28. Barthes, M., C. Reynard, R. Santini & L. Tadrist. 2007. Non-condensable gas influence on the Marangoni convection during a single vapour
bub-ble growth in a subcooled liquid.Europhys. Lett.77: 1–5.
29. Henry, C.D., J. Kim & J. McQuillen. 2006. Dis-solved gas effects on thermocapillary convection dur-ing boildur-ing in reduced gravity environments. Heat Mass Trans.42:919–923.
30. Zebib, A., G.M. Homsy & E. Meiburg. 1985. High Marangoni number convection in a square cavity.
Queries
Q1 Author: OK or ‘an air bubble’?
Q2 Author: OK this way?
Q3 Author: There are no letters on the figure to correspond to a-e. Please provide another figure with labels.