Original Article
Increased expression of TNFA gene in Mexican patients
with acute myocardial infarction and its relationship
with -857 C>T and -863 C>A polymorphisms
Saraí C Rodríguez-Reyes1,2, Edgar A Castañeda-Barragán3,4, Jorge R Padilla-Gutiérrez1, Jorge
Hernández-Bello1,5, Emmanuel Valdés-Alvarado1,2, Ilian J García-González1,5, José F Muñoz-Valle1,
César M Guzmán-Sánchez4, Yeminia Valle1
1Instituto de Investigación en Ciencias Biomédicas (IICB), Centro Universitario de Ciencias de la Salud (CUCS),
Universidad de Guadalajara (U de G), Guadalajara, Jalisco, Mexico; 2Doctorado en Ciencias Biomédicas, CUCS,
U de G, Guadalajara, Jalisco, Mexico; 3Especialidad en Cardiología, Instituto Mexicano del Seguro Social (IMSS),
CUCS, Guadalajara, Jalisco, Mexico; 4Unidad Médica de Alta Especialidad (IMAE), Centro Médico Nacional de
Occidente (CMNO), Departamento de Cardiología, IMSS, Guadalajara, Jalisco, Mexico; 5Doctorado en Genética
Humana, CUCS, U de G, Guadalajara, Jalisco, Mexico
Received February 12, 2016; Accepted August 4, 2016; Epub September 15, 2016; Published September 30, 2016
Abstract: Acute Myocardial Infarction (AMI) has the highest mortality rates in emergency services. In AMI
patho-physiology, oxidative, inflammatory, metabolic, and thrombotic factors are involved. TNFA is a candidate gene for the disease, due to its involvement in the early stage of atherosclerotic plaque destabilization. The objective of this investigation was to study the association of rs1799724 (-857 C>T) and rs1800630 (-863 C>A) TNFA polymor-phisms with AMI and the polymorpolymor-phisms’ effect on gene expression. The case-control study included 206 control
subjects and 285 patients diagnosed with AMI from Western Mexico. Genetic polymorphisms were identified by the
Polymerase Chain Reaction-Restriction Fragment Longitude Polymorphism (PCR-RFLP) method. TNFA gene expres-sion was measured by quantitative PCR (qPCR) using TaqMan® UPL probes. In terms of results, we observed the
TNFA gene overexpressed in patients with AMI (3.2 times more than in controls). The -857 C/C genotype carriers exhibited higher TNFA gene expression in the control group. The effect of -863 C>A polymorphism on TNFA gene ex-pression was in contrast between the control group and in patients with AMI. In conclusion, these polymorphisms do not contribute to the risk of AMI in Western Mexico population; however, the -863 C>A effect on the transcriptional activity of TNFA in patients with AMI merits further investigation.
Keywords: Acute myocardial infarction, TNFA genetic polymorphisms, gene expression
Introduction
Cardiovascular Disease (CVD) is the leading cause of death worldwide, involving serious ill-ness, disability, and huge economic invest-ments. Ten persons die every hour due to myo-cardial infarction in Mexico [1].
Acute Myocardial Infarction (AMI) is defined as necrosis of myocardial tissue caused by an acute and prolonged ischemia of a coronary artery, which is later related with the rupture or erosion of an atherosclerotic plaque. The clas-sic clinical syndrome of AMI involves the sud-den onset of typical symptoms and electrocar-diogram abnormalities, followed by transient increases in serum levels of enzymes and
structural proteins released by the myocardium [2].
could increase or diminish disease susceptibil-ity. Two functional genetic markers localized in the TNFA promoter region are of interest: -857 C>T (rs1799724), and -863 C>A (rs1800630).
In vitro studies have shown that the -857T or -863A allele is related with decreased tran-scriptional activity and lower protein production [6-9]. These two Single Nucleotide Polymor- phisms (SNP) have been associated with CVD in different ethnic groups [10].
In this study, we evaluated the gene expression of TNFA and its relationship with -857 C>T and 863 C>A polymorphisms in patients with AMI from Western Mexico.
Materials and methods
Study population
This case-control study included 206 Control Subjects ((CS): 108 males and 98 females), and 285 patients diagnosed with AMI (231 males and 54 females) recruited from the Hospital de Especialidades del Centro Médico Nacional de Occidente del Instituto Mexicano del Seguro Social (CMNO-IMSS).
With regard to CS, subjects were similar in age to cases, with the absence of any CVD, nega-tive AMI familial history, and normal biochemi-cal parameters was considered.
Patients with AMI were classified according to American College of Cardiology (ACC) criteria and were recruited between days 2 and 3 after the acute coronary event. Individuals with other diseases, such as infections, cancer, and auto-immune diseases, were not included.
Ethical considerations
The study was carried out in accordance with Helsinki Declaration 2013 statutes. All individ-uals accepted to participate in the study and signed informed written consent. Ethical app- roval was obtanied by the Centro Universitario de Ciencias de La Salud (CUCS) of the Univer- sidad de Guadalajara (U de G) (CI/065/2014).
DNA extraction
Extraction of genomic DNA (gDNA) was obtained from total peripheral blood leukocytes using the Miller technique [11]. gDNA concentration was determined spectrophotometrically at wavelengths of 260 nm (absorbance for nucleic acids) and 280 nm (absorbance of proteins). Once the gDNA concentration was known, sam-ples were stored at -20°C until use.
Genotyping
The polymorphism was amplified by Polymerase Chain Reaction-Restriction Fragment Longitude Polymorphism (PCR-RFLP) utilizing the follow-ing primers [12]: rs1799724 Forward: 5’-AA GTCGAGTATGGGGACCCCCCGTTAA-3’ Reverse: 5’-CCCCAGTGTGTGGCCATATCTTCT-3’ rs18006- 30 Forward: 5’-GGCTCTGAGGAATGGGTTAC-3’ Reverse: 5’-CTACATGGCCCTGTCTTCGTTACG-3’ PCR amplification was performed in a total vol -ume of 20 µL containing 10 ng/µL of gDNA, 0.08 IU/µL of Taq polymerase (Invitrogen™, Carlsbad, CA, USA), 1X buffer, 0.6 pM of each primer, 1.5 mM MgCl2, and 0.1 mM dNTP. Ther- mocycler conditions were initial denaturation step of 3 min at 94°C followed by 30 cycles of 45 sec each at 94°C, 62°C, and 72°C, and a final extension step of 1 min at 72°C.
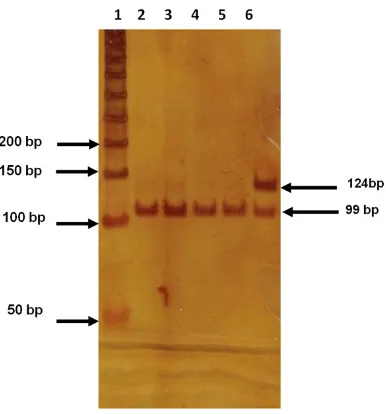
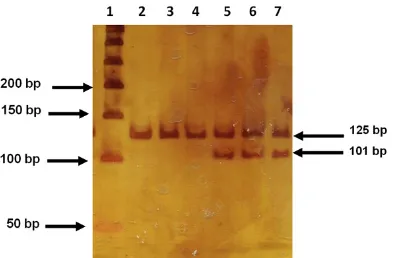
PCR fragments of 124 and 125 bp for rs1799724 and rs1800630 polymorphisms were digested with 5 U of HincII® (New England
BioLabs, Beverly, MA, USA) and HpyCH4IV (New England BioLabs®, Beverly, MA, USA) enzymes, respectively. The final volume of digestion reac -tion was 15 µl, and PCR fragments were digest-ed at 37°C/1 h. The digestion pattern for poly-morphism rs1799724 resulted in two frag-ments at the C allele (99 bp and 25 bp) and a fragment at the 124 T allele. Polymorphism rs2229569 digestion resulted in a fragment at the C allele (125 bp) and two fragments of 101 bp and of 24 bp for A allele. PCR products and digested products were analyzed by gel electro-phoresis by 6% polyacrylamide (29:1, acryl-amide: bis-acrylamide) stained with silver nitrate.
Analysis of messenger RNA (mRNA) expres-sion
RNA was extracted by phenol-chloroform (Trizol, Life Technologies) according to the Chomiczyki and Sacchi method [13]. Complementary DNA (cDNA) was synthesized employing total RNA by means of Ribonuclease H and oligo d (T)16 (Promega, Madison, WI, USA) and reverse tran-scriptase M-MLV. The concentrations of RNA and cDNA were quantified using NanoDrop 200 (ThermoScientific). Only those with the ratio of 1.8:2 (A260/280 nm) were considered and pro-cessed immediately. Levels of the relative expression of TNFA mRNA were measured with the quantitative Polymerase Chain Reaction (qPCR) technique with TaqMan® probes (Pro-
bes #57 Roche, ref: 0488546001) utilizing
Gene Assay, ref: 05190541001) as reference gene. The following primer sequences were
(<10%). In each reaction, no-template controls were included.
qPCR conditions resulted in expected amplicon size and a single band of amplification, and were further validated by melting curve an- alysis.
Amplification efficiency
Serial complementary DNA (cDNA) dilution curves were constructed to calculate amplifica -tion efficiency for both genes. A graph of quan -tification Cycle (Cq) graph vs. log10-relative copy
number of the sample from dilution series was produced. Efficiency values were very close to 2, indicating efficient amplification [14, 15]. Age, gender, and risk factors were considered among inclusion criteria for mRNA relative quantification. Mean age was 61 ± 5 years.
Statistical analysis
[image:3.612.90.382.97.360.2]The chi-square test or Fisher exact test was used to compare discrete variables for estima-tion of Hardy-Weinberg Equilibrium (HWE). Relative expression was determined by means Table 1. Demographic and clinical characteristics of the study
groups
Parameter AMI CS Reference value
Demographic
Age (years) 62 ± 11.03 57 ± 8.41
Male 231 (81.05%) 108 (52.42%) Female 54 (18.95%) 98 (47.58%) Sedentary lifestyle 149 (52%) 99 (48%)
BMI 27.61 ± 0.52 26.5 ± 0.62 18-25 normal 25-30 overweight
>30 obesity Risk factor
AHT 157 (55.08%) 61 (29.61%) DM2 118 (41.40%) 39 (18.93%) Obesity 107 (37.54%) 59 (28.64%) Dyslipidemia 100 (35.08%) 29 (14.07%) Biochemical
CHOL (mg/dL) 118.24 ± 40.00 167.73 ± 25.41 150-199 GLU (mg/dL) 137.58 ± 55.32 101.43 ± 10.38 75-105 TG (mg/dL) 94.26 ± 33.70 112.87 ± 57.45 <200 LDL-c (mg/dL) 45.16 ± 19.50 27.94 ± 68.76 <130 HDL-c (mg/dL) 20.44 ± 11.90 37.57 ± 18.21 >40
Abbreviations: AHT, Arterial Hypertension; AMI, Acute Myocardial Infarction; CS, Con-trol Subjects; CHOL: Cholesterol; DM2, Diabetes Mellitus type 2; GLU, Glucose; HDL-c, High-Density Lipoprotein cholesterol; LDL-c, Low-Density Lipoprotein cholesterol; n,
sample size; TG, Triglycerides. Mean ± Standard Deviation (SD).
Figure 1. Genotype identification of -857 C>T poly -morphism of the TNFA gene. The figure shows a 6%
polyacrylamide gel. Lane 1 molecular weight marker of 50 bp, lanes 2-5: CC genotype and lane 6 CT geno-type.
employed, amplifying a 60- nucleotide fragment and including exons 2 and 3 of the gene: Forward: 5’-CGC- TCCCCAAGAAGACAG-3’ Re- verse: 5’-AGAGGCTGAGGAA- CAAGCAC-3’.
[image:3.612.94.287.423.630.2]of the Livak method: 2-ΔΔCq and 2-Δcq [15]. Odds Ratio (OR) was the measurement of the asso-ciation. Analysis of the relationship among quantitative variables was performed by Spearman correlation (r). Medians were com-pared employing the Mann-Whitney U test. The significance level was set at P<0.05; when sig-nificant, this was corrected by linear regres -sion. The aforementioned statistical analysis was carried out by using of SPSS ver. 21.0 sta-tistical package, Excel 2010, and GraphPad Prism ver. 04 (GraphPad, CA, USA) statistical software.
Results
The study groups’ demographic and clinical characteristics are presented in Table 1. Average age patients with AMI was 62 years, and 57 years in the control group. The disease was overrepresented in males. In both study groups, Arterial Hypertension (AHT) was the most common risk factor, and dyslipidemia, the least. Except for glucose level, all biochemical parameters were among the reference values in both study groups.
Genetic contribution
The genotype frequencies of -857 C>T and -863 C>A polymorphisms were found within the HWE in CS (P>0.2) and in patients with AMI; only -857 C>T deviated in terms of HWE (P = 0.003); the latter was expected since this is a selected population. The electrophoretic pat-tern of both polymorphisms is depicted in Figures 1 and 2. The -857T allele was more
fre-quently observed in cases than in controls (17 vs. 12.93%), while the -863A allele was slightly less frequent in cases (11.75 vs. 12.37%). However, neither allele nor genotype frequen-cies for both polymorphisms were statistically different between patients and controls (Table 2). HaploView software revealed no significance linkage disequilibrium between both polymor-phisms in our population. Thus, they were con-sidered individually.
Gene expression
mRNA relative expression of the TNFA is pre-sented in Figure 3. Median gene expression of
TNFA was 59.76 vs. 32.06 (P = 0.04) and was 3.2 times higher in patients with AMI than in CS.
We analyze TNFA gene expression according to the genotypes in each studied group. We observed a reduced number of homozygous polymorphisms, and these were not included in the qPCR experiments.
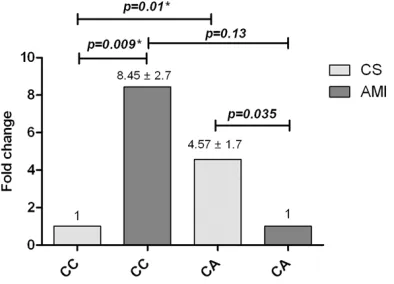
With regard to -857 C>T, TNFA gene expression was increased in CC compared with CT carriers (median: 46.71 vs. 7.76; P = 0.02) in CS. In AMI patients, differences were not statistically sig-nificant. When comparing these between grou-ps, the difference was not statistically signifi -cant (Figure 4). Regarding the -863 C>A poly-morphism in CS, the CA genotype demonstrat-ed 4.5 times more expression than in CC geno-type carriers (median: 59.95 vs. 16.40; P = 0.01). Otherwise, the opposite effect was observed in patients with AMI, where CC geno-type carriers exhibited 8.5 times more gene expression than heterozygous genotype carri-ers (median: 79.11 vs. 24.35; P = 0.01). Between groups, CC genotype carriers with AMI demonstrated higher TNFA gene expression than controls (median: 79.11 vs. 16.40; P = 0.009) (Figure 5).
We performed a multivariate regression to rule out bias due to risk factors. No evidence of potential confounders was observed (P>0.05). Discussion
[image:4.612.92.289.71.200.2]The total cost for AMI in public health institu-tions corresponds to $387,160/year in US Dollars (USD). Although patients are monitored,
Figure 2. Genotype identification of -863 C>A poly -morphism of TNFA gene. The figure shows a 6%
treated, and aimed toward modifying their life-style, CVD continues to increase [16]. Taken together, these support the study of other non-classical factors related with AMI.
Age comprised one of the most important in- clusion criteria of our study groups. In this respect, we were not able to include healthy older people in the control group. The main risk factor observed in both controls and patients with AMI was AHT. This is in line with a recent survey conducted in Mexico where AHT preva-lence in general population is 31.5% and is
As expected, TNFA gene expression was increased in patients with AMI. According to genotype, -857 CC carriers showed higher
TNFA gene expression than CT genotype in CS. This is in line with previous in vitro reports [9, 18].
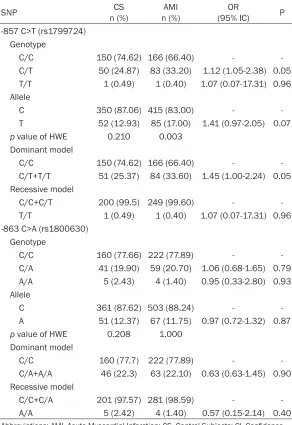
[image:5.612.92.384.97.522.2]With regard to the -863 C>A polymorphism, we found contrasting results according to group. In CS, CA genotype carriers showed higher rela-tive TNFA gene expression than CC homozy-gous and the opposite effect in patients with AMI. These contradictory findings could be Table 2. Allele and genotype distribution of -867 C>T and -863 C>A
polymorphisms in the TNFA gene
SNP n (%)CS n (%)AMI (95% IC)OR P
-857 C>T (rs1799724) Genotype
C/C 150 (74.62) 166 (66.40) -
C/T 50 (24.87) 83 (33.20) 1.12 (1.05-2.38) 0.05 T/T 1 (0.49) 1 (0.40) 1.07 (0.07-17.31) 0.96 Allele
C 350 (87.06) 415 (83.00) -
T 52 (12.93) 85 (17.00) 1.41 (0.97-2.05) 0.07
p value of HWE 0.210 0.003 Dominant model
C/C 150 (74.62) 166 (66.40) -
C/T+T/T 51 (25.37) 84 (33.60) 1.45 (1.00-2.24) 0.05 Recessive model
C/C+C/T 200 (99.5) 249 (99.60) - T/T 1 (0.49) 1 (0.40) 1.07 (0.07-17.31) 0.96 -863 C>A (rs1800630)
Genotype
C/C 160 (77.66) 222 (77.89) -
C/A 41 (19.90) 59 (20.70) 1.06 (0.68-1.65) 0.79 A/A 5 (2.43) 4 (1.40) 0.95 (0.33-2.80) 0.93 Allele
C 361 (87.62) 503 (88.24) -
A 51 (12.37) 67 (11.75) 0.97 (0.72-1.32) 0.87
p value of HWE 0.208 1.000 Dominant model
C/C 160 (77.7) 222 (77.89) -
C/A+A/A 46 (22.3) 63 (22.10) 0.63 (0.63-1.45) 0.90 Recessive model
C/C+C/A 201 (97.57) 281 (98.59) - A/A 5 (2.42) 4 (1.40) 0.57 (0.15-2.14) 0.40
Abbreviations: AMI, Acute Myocardial Infarction; CS, Control Subjects; CI, Confidence
Interval; HWE, Hardy-Weinberg Equilibrium; OR, odds ratio. ORs and p value were cor-rected with binary logistic regression.
explained by the complex transcriptional regu-lation of the gene, which involves transcription factors, cytokines, bacterial products, and dis-ease [8, 18-20]. Functional studies have dem-onstrated that both polymorphisms, -857 C>T and -863 C>A, are located in consensus regions important to gene regulation, such as OCT-1 and NF-kB binding sequences. The Nuclear Factor kappa Beta (NF-kB) family of transcrip-tion factors plays a pivotal role in the regulatranscrip-tion of cardiac myocyte survival through repression
[image:6.612.92.524.75.247.2]of apoptotic cell death triggered by hypoxia or ischemic myocardial dysfunction [21]. Funct- ional studies have determined that the pres-ence of the -863A allele is related with dimin-ished binding affinity to the p50-p50 dimer of NF-kB, suggesting that TNFA gene expression depends on the proportion of the NF-kB: the A variant increases gene expression when there is a sufficient amount of p50/p50 homodimer
Figure 3. Relative messenger RNA (mRNA) expression of TNFA in Control Subjects (CS) and Acute Myocardial Infarc-tion (AMI). A. Comparison of relative TNFA gene expression for each study group (Median CS = 32.06; AMI = 59.76).
Data shown as mean ± Standard Deviation (SD) (n = 20-26), 2-ΔCq method. B. Comparison of relative TNFA gene expression for each study group, 2-ΔΔCq method. mRNA expression was measured by quantitative Polymerase Chain Reaction (qPCR) and normalized to the mRNA expression of reference gene GAPDH.
Figure 4. messenger RNA (mRNA) TNFA relative ex-pression of the -857 C>T polymorphism. Comparison of relative TNFA gene expression in Control Subjects (CS) and Acute Myocardial Infarction (AMI). Data ob-tained by 2-ΔΔCq, Standard Deviation (SD) is above the bars obtained by the ΔCq method. mRNA expression
[image:6.612.92.290.329.456.2]was measured by quantitative Polymerase Chain Re-action (qPCR) and normalized to the mRNA expres-sion of reference gene GAPDH. CS was the calibrator group and assigned value 1.
[image:6.612.327.524.331.473.2][22]. Taken together, this information points to that the functional effect of -863A may be dependent on several factors, including cell type and on transcriptional, post-transcription-al, and epigenetic regulations, due to that these play a pivotal role in gene expression and in the regulation of protein production [23-26]. Conclusion
TNFA gene expression was increased in pati- ents with AMI; -857 C/C genotype carriers showed higher TNFA gene expression that in the control group. The effect of -863 C>A poly-morphism on TNFA gene expression was con-trasted in the control group and in patients with AMI. These polymorphisms do not contribute to the risk for AMI in Western Mexico population; however, the -863 C>A effect on TNFA tran-scriptional activity in patients with AMI merits further investigations.
Acknowledgements
This work was supported by Fondo Sectori- al Grant SSA/IMSS/ISSSTE-CONACYT-2014-c- 01-233713 to Y Valle.
Disclosure of conflict of interest
None.
Address correspondence to: Dr. Yeminia Valle, Instituto de Investigación en Ciencias Biomédicas (IICB), Centro Universitario de Ciencias de la Salud (CUCS), Universidad de Guadalajara, Guadalajara, Jalisco, México. E-mail: [email protected]
References
[1] Nstituto Nacional de Estadística y Geografía (México). Mujeres y hombres en México 2014 /Instituto Nacional de Estadística y Geografía.-- México: INEGI, c2015. vii, 99 p. ISBN 978-607-739-372-6. http://cedoc.inmujeres.gob.mx/d- entos_download/101239.pdf (accessed Aug, 2016).
[2] Hernández FA, Valladares FJ, Padrón NS, Manso FR, Rodríguez T. Infarto agudo del mio-cardio. Rev de las Ciencias de la Salud de Cienfuegos 2006; 11: 20-25.
[3] Hansson GK. Inflammation, atherosclerosis,
and coronary artery disease. N Engl J Med 2005; 352: 1685-1695.
[4] Barone FC, Arvin B, White RF, Miller A, Webb CL, Willette RN, Lysko PG and Feuerstein GZ. Tumor necrosis factor-alpha. A mediator of
fo-cal ischemic brain injury. Stroke J Cereb Circ 1997; 28: 1233-1244.
[5] Erdmann J, Linsel-Nitschke P and Schunkert H. Genetic causes of myocardial infarction: new insights from genome-wide association stud-ies. Dtsch Ärztebl Int 2010; 107: 694-699. [6] Higuchi T, Seki N, Kamizono S, Yamada A,
Kimura A, Kato H and Itoh K. Polymorphism of
the 5’-flanking region of the human Tumor
Necrosis Factor (TNF)-alpha gene in Japanese. Tissue Antigens 1998; 51: 605-612.
[7] Skoog T, Hamsten A and Eriksson P.
Allele-specific chromatin remodeling of the tumor
necrosis factor-alpha promoter. Biochem Bio- phys Res Commun 2006; 351: 777-783. [8] Hohjoh H and Tokunaga K. Allele-specific bind
-ing of the ubiquitous transcription factor OCT-1 to the functional Single Nucleotide Polymor- phism (SNP) sites in the Tumor Necrosis Factor-Alpha gene (TNFA) promoter. Genes Immun 2001; 2: 105-109.
[9] Sharma S, Sharma A, Kumar S, Sharma SK and Ghosh B. Association of TNF haplotypes with asthma, serum IgE levels, and correlation with serum TNF-alpha levels. Am J Respir Cell Mol Biol 2006; 35: 488-495.
[10] Hernández-Díaz Y, Tovilla-Zárate CA, Juárez-Rojop I, Baños-González MA, Torres-Hernández ME, López-Narváez ML, Yáñez-Rivera TG and González-Castro TB. The role of gene variants
of the inflammatory markers CRP and TNF-α in
cardiovascular heart disease: systematic re-view and meta-analysis. Int J Clin Exp Med 2015; 8: 11958-11984.
[11] Miller AB. Diet and cancer. A review. Acta Oncol Stockh Swed 1990; 29: 87-95.
[12] Park K, Kim N, Nam J, Bang D and Lee ES. Association of TNFA promoter region haplotype in Behçet’s disease. J Korean Med Sci 2006; 21: 596-601.
[13] Chomczynski P and Sacchi N. Single-step method of RNA isolation by acid guanidini-umthiocyanate-phenol-chloroform extraction. Anal Biochem 1987; 162: 156-159.
[14] Wilkening S and Bader A. Quantitative real-time polymerase chain reaction: methodical analysis and mathematical model. J Biomol Tech JBT 2004; 15: 107-111.
[15] Livak KJ and Schmittgen TD. Analysis of rela-tive gene expression data using real-time quantitative PCR and the 2(-Delta Delta C(T)) method. Methods (San Diego, Calif.) 2001; 25: 402-408.
[17] Michaud K, Berglind N, Franzén S, Frisell T, Garwood C, Greenberg JD, Ho M, Holmqvist M, Horne L, Inoue E, Nyberg F, Pappas DA, Reed G, Symmons D, Tanaka E, Tran TN, Verstappen, SMM, Wesby-van Swaay E, Yamanaka H and Askling J. Can Rheumatoid Arthritis (RA) regis-tries provide contextual safety data for modern RA clinical trials? The case for mortality and cardiovascular disease. Ann Rheum Dis 2016; [Epub ahead of print].
[18] Skoog T, van’t Hooft F, M, Kallin B, Jovinge S, Boquist S, Nilsson J, Eriksson P and Hamsten A. A common functional polymorphism (C-->A substitution at position -863) in the promoter region of the Tumour Necrosis Factor-alpha (TNF-alpha) gene associated with reduced cir-culating levels of TNF-alpha. Hum Mol Genet 1999; 8: 1443-1449.
[19] van Heel DA, Udalova IA, De Silva AP, McGovern DP, Kinouchi Y, Hull J, Lench NJ, Cardon LR, Carey AH, Jewell DP and Kwiatkowski D.
Inflammatory bowel disease is associated with
a TNF polymorphism that affects an interac-tion between the OCT1 and NF(-kappa)B tran-scription factors. Hum Mol Genet 2002; 11: 1281-1289.
[20] Hestdal K, Aukrust P, Müller F, Lien E, Bjerkeli V, Espevik T and Frøland SS. Dysregulation of membrane-bound tumor necrosis factor-alpha and tumor necrosis factor receptors on
mono-nuclear cells in human immunodeficiency vi -rus type 1 infection: low percentage of p75-tu-mor necrosis factor receptor positive cells in patients with advanced disease and high viral load. Blood 1997; 90: 2670-2679.
[21] Mustapha S, Kirshner A, De Moissac D and Kirshenbaum LA. A direct requirement of nu-clear factor-kappa B for suppression of apopto-sis in ventricular myocytes. Am J Physiol Heart Circ Physiol 2000; 279: H939-H945.
[22] Udalova IA, Richardson A, Denys A, Smith C, Ackerman H, Foxwell B and Kwiatkowski D. Functional consequences of a polymorphism affecting NF-kappaB p50-p50 binding to the TNF promoter region. Mol Cell Biol 2000; 20: 9113-9119.
[23] Krämer B, Wiegmann K and Krönke M. Regul- ation of the human TNF promoter by the tran-scription factor Ets. J Biol Chem 1995; 270: 6577-6583.
[24] Miao F, Gonzalo IG, Lanting L and Natarajan R.
In vivo chromatin remodeling events leading to
inflammatory gene transcription under diabet -ic conditions. J Biol Chem 2004; 279: 18091-18097.
[25] Sullivan KE, Reddy ABM, Dietzmann K, Suriano AR, Kocieda VP, Stewart M and Bhatia M. Epigenetic regulation of tumor necrosis factor alpha. Mol Cell Biol 2007; 2: 5147-5160. [26] Lee JY, Kim NA, Sanford A and Sullivan KE.