Voltron: A Hybrid System For Answer Validation Based On Lexical And
Distance Features
Ivan Zamanov1, Nelly Hateva1, Marina Kraeva1, Ivana Yovcheva1, Ivelina Nikolova2, Galia Angelova2
1 FMI, Sofia University, Sofia, Bulgaria
2 IICT, Bulgarian Academy of Sciences, Sofia, Bulgaria
[email protected], [email protected], [email protected], [email protected], [email protected], [email protected]
Abstract
The purpose of this paper is to describe our submission to the SemEval-2015 Task 3 on Answer Selection in Community Question Answering. We participated in subtask A, where the systems had to classify community answers for a given question as definitely rel-evant, potentially useful, or irrelevant. For ev-ery question-answer pair in the training data we extract a vector with a variety of features. These vectors are then fed to a MaxEnt classi-fier for training. Given a question and an an-swer the trained classifier outputs class proba-bilities for each of the three desired categories. The one with the highest probability is cho-sen. Our system scores better than the average score in subtask A of Task 3.
1 Introduction
Nowadays, text analysis and semantic similarity are subject to a lot of research and experiments due to the growth of social media influence, the increas-ing usage of forums for findincreas-ing a solution of com-mon known problems and the Web upgrowth. As beginners in the computational linguistics field, we were very interested in dealing with these topics and have found Answer Validation as a good start. Our team chose to focus on subtask A of Task 3 in the SemEval-2015 workshop, namelyAnswer selection in community question answering data. In order to achieve good results, we combined most of the techniques familiar to us. We process the data as question-answer pairs. The framework GATE (Cun-ningham et al., 2002) was used for the
preprocess-ing in the system because it offers convenient natu-ral language processing pipelines and has an API al-lowing for system integration. For classification we used the Maximum Entropy classifier provided by MALLET (McCallum and Kachites, 2002). We use a combination of surface, morphological, syntactic, and contextual features as well as distance metrics between the question and answer. Distance metrics are based on word2vec (Mikolov et al., 2013a) and DKPro Similarity (B¨ar, et al.), (de Castilho, 2014).
2 Related work
Several recent systems were created and used for similar analysis. Although their applications have some differences from the system described in this paper, we consider them relevant because they deal with semantic similarity.
(Bas¸kaya, 2014) uses Vector Space Models which have some similarity to our usage of word2vec cen-troid metrics with the difference that we do not orga-nize the whole text according to the structure of the result matrix, as the VSMs do. The cosine similarity is common for both systems. The big difference is that we use only the input words while in his system the words’ likely synonyms according to a language model are also used. We believe this contributes to the consistently higher scores of his system.
Another work of (Vilari˝no et al., 2014) also uses n-grams, cosine similarity and that is a common feature with our system. Some differing features are Jaccard coefficient, Latent Semantic Analysis, Pointwise Mutual Information. Their results are very close to ours.
Most of the works dealing with semantic
ity use n-grams, metadata features and stop words as we do. Our scores are not among the highest in subtask A of Task 3, but they come close to and sub-stantially differ from the average score in this field of works.
3 Resources
The datasets we use to train our system are provided from the SemEval-2015 organizers. The datasets consist of 2600 training and 300 development ques-tions including 16,541 training and 1,645 develop-ment comdevelop-ments.
Also for the extraction of some features we use pre-trained word and phrase vectors. They are pre-trained on part of Google News dataset (about 100 billion words). The model contains 300-dimensional vec-tors for 3 million words and phrases.
4 Method
The task at hand is to measure how appropriate and/or informative a comment is with respect to a question. Our approach is to measure the related-ness of a comment to the question or, in other words, to measure if a question-comment pair is consistent. Therefore we attempt to classify each pair as Good, Potential or Bad.
The main characteristic of a good comment is that it is related to the corresponding question. Also, we assume that when answering a question, people tend to use the same words with which the question was asked because that would make it easier for the ques-tion author to understand. Therefore, similar word-ing and especially similar phrases would be an indi-cation of a more informative comment.
4.1 Features
We will call tokens that are not punctuation or stop words meaningful, as they carry some information regardless of exactly how a sentence is formulated. 4.1.1 Lexical Features
For every meaningful token, we extract its stem, lemma and orthography.
4.1.2 N-gram Features
Bigrams and trigrams of tokens (even non-meaningful ones) are also extracted since this
should capture similar phrases used in the question-comment pair. We assume that n-grams of higher order could contribute as well, however we believe
n= 2andn= 3would carry the most information andn≥4would impact training time adversely. 4.1.3 Bad-answer-specific Features
Bad comments often include a lot of punctuation, more than one question in the answer, questions, fol-lowed by their obvious answer (when the expression or its synonyms could be directly found in the an-swer), more than two repeating letters next to each other (i.e. exclamations such as ”ahaa”), greetings, chat abbreviations, more than one uppercase word, a lot of emoticons, exclamations and other very mean-ingless words. Emphasizing such tokens helps to distinguish bad comments specifically.
4.1.4 Structural Features
We include the comment’s length in meaning-ful tokens, length in sentences and each sentence’s length as features, since longer comments should in-clude more information. Since named entities, such as locations and organizations etc. would be es-pecially indicative of the topic similarity between question and comment, we give them greater weight by again including named entities, recognized by GATE’s built-in NER tools.
4.1.5 TF Vector Space Features
Another attempt to capture similar terms in the question and comment is to convert each entry to a local term-frequency vector and compute the cosine similarity between the vectors for the question and comment rounded to 0.1 precision. Similar word-ing, regardless of term occurrence frequency, should lead to a higher cosine similarity. We use DKPro’s implementation of cosine similarity to achieve this (B¨ar, et al.). The term ”local” refers to the fact that TF vectors of distinct entries are not related, that is, the vector space is specific to a question-comment pair.
4.1.6 Word2vec Semantic Similarity
2013b), (Mikolov et al., 2013c). The general idea of word2vec is to represent each word as a real vec-tor that captures the contexts of word occurrences in a corpus. For a given question-comment pair, we extract word2vec vectors from a pre-trained set for all tokens for which one is available. We compute the centroids for the question and the comment, then use the cosine between the two as a feature. The in-tention is to capture the similarity between different terms in the pair. The same procedure is then applied once more for only NP-S, i.e. noun phrase, tokens because they carry more information about the topic than other parts of speech.
4.2 Classifier Model
After all described features are extracted, they form a list of string values associated with each question-answer pair. As explained above, some of them are characteristic for bad answers, while others are mainly found in good ones. Therefore, it makes sense to consider the feature list for a given question-answer pair as a document itself. Classifying these documents with any standard approach will then group pairs with similar features together and will differentiate good from bad answers.
In our system, we use MALLET (McCallum and Kachites, 2002) to perform classification on the ex-tracted feature documents. For classification we have chosen the default MALLET workflow that calculates term-frequency feature vectors from its input documents. These vectors are then fed to a MaxEnt classifier, trained and evaluated using ten-fold cross validation. For the final classification, the trained classifier outputs class probabilities for each of the three desired categories: Good, Potential or Bad (which also includes Not English/Dialogue), and the one with the highest score is chosen as the label for the question-answer pair.
5 Experiments and results
Various experiments were conducted to analyse the contribution of the chosen features. In each of them, training was performed on the combined data from the train and development datasets, provided by the organizers. Testing was done on the official test dataset used for evaluation of the task, after it was released by the organizers. The analysis will only
focus on the coarse-grained evaluation in the three main classes (Good, Potential, Bad) since our sys-tem does not try to target the finer-grained classifi-cation.
We defined our baseline system as the one that uses only the lexical and structural features de-scribed in the Method section, i.e. word tokens, sen-tence, question and answer length, as well as the bigrams and trigrams of the question-answer pair. With only these features, the system is very weak -the accuracy as reported by -the scorer script against the gold standard is 44.18% and the F1 score is 24.05%.
Next, we included the features that rely on GATE gazetteers, such as the named entities features. This improved the system’s performance by more than 1%, reaching accuracy of 45.14% and F1 score of 25.33%.
Another experiment we did was to add to the baseline system only the DKPro cosine similarity. This approach yielded a significant increase in the scores on the test set over the baseline system, around 4%.
Finally, we tested the baseline system with the word2vec cosine values. This experiment was not as successful as the others, offering no improvement. The result may be attributed to the fact that we use a set of vectors trained on generic Web data instead of vectors specifically trained for the SemEval task. However, the community generated datasets are not sufficiently large and cannot be used for adequate word2vec training.
When all features were combined, the scores were boosted to 50% accuracy and 32.02% F1. The im-provement from the baseline system is greater than the accumulated improvement from adding the sin-gle features because those features influence each other.
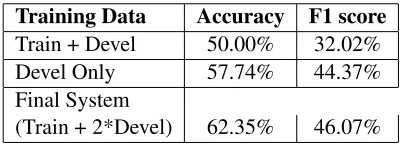
All of the described experiments were done on the data from the train and development sets. However, when preparing our final submission for the compe-tition, we trained our system on a training set that in-cluded the development data twice. This way more weight was given to those question-answer pairs. The result was an impressive 14% increase in our F1 score.
smaller development dataset. All described fea-tures were combined here as well. The experiment showed that indeed the larger train dataset provided for the competition has less effect on the perfor-mance of our system than the smaller development dataset. We suspect that the contents of the test dataset are closer to the development dataset because that would mean more common n-gram features are detected. This would explain the boost in the F1 score and the accuracy.
A summary of the results obtained in the experi-ments can be seen in Tables 1 and 2
Accuracy F1 score
baseline 44.18% 24.05%
+ gazetteers 45.14% 25.33%
+ cosine similarity 47.87% 28.98%
+ word2vec 44.13% 24.03%
all combined 50.00% 32.02%
[image:4.612.85.287.389.461.2]final system 62.35% 46.07%
Table 1: Accuracy and F1 score achieved using various combinations of features
Training Data Accuracy F1 score
Train + Devel 50.00% 32.02%
Devel Only 57.74% 44.37%
Final System
(Train + 2*Devel) 62.35% 46.07%
Table 2: Accuracy and F1 score achieved using all fea-tures, but extracted from different training datasets
It should be noted that the results are greatly im-pacted by the low score we get on the Potential an-swers class. The scores on this label are very close to 0 with all devised systems, which is to be expected since none of our features were specifically targeted at distinguishing Potential answers from Good and Bad ones.
In all experiments, the highest precision and recall were achieved on the Bad answers.
6 Conclusion
In this paper we introduced our system for answer classification of question answering data. We de-scribed the method of preprocessing and applying
features to the tokens and also mentioned the inter-grated systems used for its implementation. All the steps of the data preparation for analysis were ex-haustively described in the method description. Lex-ical and structural features proved to be insufficient for achieving high results. The gazetteers helped in-crease our scores but the most important part were the vector calculations made after the preparation process. The experiments showed that examining cosine distance between question and answer can lead to much greater performance. However, the most dramatic improvement was caused by increas-ing the size of the trainincreas-ing data set and givincreas-ing more weight to some question-answer pairs. For future work, we would try to add more syntactic features into the preprocessing and to integrate language models for the Good and Bad comments classifica-tion. With this system, we achieved satisfactory re-sults for the SemEval 2015 answer-validation task.
References
McCallum, Andrew Kachites. 2002. “MAL-LET: A Machine Learning for Language Toolkit.”
http://mallet.cs.umass.edu.
H. Cunningham, V. Tablan, A. Roberts, K. Bontcheva. 2013. Getting More Out of Biomedical Docu-ments with GATE’s Full Lifecycle Open Source
Text Analytics. PLoS Comput Biol 9(2):
e1002854. doi:10.1371/journal.pcbi.1002854 http://tinyurl.com/gate-life-sci/
H. Cunningham, et al. 2011.Text Processing with GATE (Version 6). University of Sheffield Department of Computer Science. 15 April 2011. ISBN 0956599311. Tomas Mikolov, Ilya Sutskever, Kai Chen, Greg Corrado, and Jeffrey Dean. 2013. Distributed Representations of Words and Phrases and their Compositionality. In Proceedings of NIPS, 2013.
Tomas Mikolov, Kai Chen, Greg Corrado, and Jeffrey Dean. 2013. Efficient Estimation of Word Represen-tations in Vector Space. In Proceedings of Workshop at ICLR, 2013.
Tomas , Wen-tau Yih, and Geoffrey Zweig. 2013. Lin-guistic Regularities in Continuous Space Word Repre-sentations. In Proceedings of NAACL HLT, 2013. Daniel B¨ar, Torsten Zesch, and Iryna Gurevych. 2013.
Eckart de Castilho, R. and Gurevych, I. 2014. A broad-coverage collection of portable NLP components for building shareable analysis pipelines. In Proceedings of the Workshop on Open Infrastructures and Analysis Frameworks for HLT (OIAF4HLT) at COLING 2014, Dublin, Ireland.
Osman Bas¸kaya. 2014. AI-KU: Using Co-Occurrence Modeling for Semantic Similarity. Artificial Intelli-gence Laboratory, Koc¸ University, Istanbul, Turkey. SemEval-2014.
Darnes Vilari˝no, David Pinto, Sa´ul Le´on, Mireya To-var, Beatriz Beltr´an. 2014. BUAP: Evaluating Fea-tures for Multilingual and Cross-Level Semantic Tex-tual Similarity. Benem´erita Universidad Aut´onoma de Puebla Faculty of Computer Science, Puebla, M´exico. SemEval-2014.