Combining Graph Degeneracy and Submodularity for Unsupervised
Extractive Summarization
Antoine J.-P. Tixier, Polykarpos Meladianos, Michalis Vazirgiannis
Data Science and Mining Team (DaSciM) ´Ecole Polytechnique
Palaiseau, France
Abstract
We present a fully unsupervised, extrac-tive text summarization system that lever-ages a submodularity framework intro-duced by past research. The framework allows summaries to be generated in a greedy way while preserving near-optimal performance guarantees. Our main contri-bution is the novel coverage reward term of the objective function optimized by the greedy algorithm. This component builds on the graph-of-words representa-tion of text and thek-core decomposition algorithm to assign meaningful scores to words. We evaluate our approach on the AMI and ICSI meeting speech corpora, and on the DUC2001 news corpus. We reach state-of-the-art performance on all datasets. Results indicate that our method is particularly well-suited to the meeting domain.
1 Introduction
We present an extractive text summarization sys-tem and test it on automatic meeting speech tran-scriptions and news articles. Summarizing spon-taneous multiparty meeting speech text is a dif-ficult task fraught with many unique challenges (McKeown et al., 2005). Rather than the well-formed grammatical sentences found in traditional documents, the input data consist ofutterances, or fragments of speech transcripts. Information is di-luted across utterances due to speakers frequently hesitating and interrupting each other, and noise abounds in the form of disfluencies (often ex-pressed with filler words such as “um”, “uh-huh”, etc.) and unrelated chit-chat. Since human tran-scriptions are very costly, the only trantran-scriptions available in practice are often Automatic Speech
Recognition (ASR) output. Recognition errors in-troduce much additional noise, making the task of summarization even more difficult. In this paper, we use ASR output as our sole input, and do not make use of additional data such as prosodic fea-tures (Murray et al.,2005).
2 Background
2.1 Graph-of-words representation
A graph-of-words represents a piece of text as a network whose nodes are unique terms in the document, and whose edges encode some kind of term-term relationship information. Un-like the traditional vector space model that as-sumes term independence, a graph-of-words is an information-rich structure, and enables many pow-erful tools from graph theory to be applied to NLP tasks. The most famous example is probably the use of PageRank for unsupervised keyword ex-traction and document summarization (Mihalcea and Tarau,2004).
More recent unsupervised NLP studies based on graphs reached state-of-the-art performance on a variety of tasks such as multi-sentence compression, information retrieval, real-time sub-event detection from text streams, keyword ex-traction, and real-time topic detection (Filippova,
2010;Rousseau and Vazirgiannis,2013; Meladi-anos et al.,2015;Tixier et al.,2016a;Meladianos et al.,2017).
While several variants of the graph-of-words representation exist, with different levels of so-phistication and many graph building and graph mining parameters (Tixier et al.,2016b), we stick here to the traditional configuration of ( Mihal-cea and Tarau, 2004), which simply records co-occurrence statistics. In this setting, as illustrated in Figure1, an undirected edge is drawn between two nodes if the unigrams they represent co-occur
within a window of fixed size W that is slided over the full text from start to finish, overspan-ning sentences. In addition, edges are assigned integer weights matching co-occurrence counts. This approach follows theDistributional Hypoth-esis (Harris, 1954), in that it assumes the exis-tence and strength of the dependence between tex-tual units to be solely determined by the frequency with which they share local contexts of occur-rence.
●
●
●
●
●
● ●
● ●
●
●
●
●
analysi (14)
mathemat (24)
method (18) characterist (15)
aspect (10) price (33)
●
probabilist (18)
statist (12)
share (28)
model (18) seri (27)
trade (12)
Edge weights 1 2 3 Core numbers
3 4 5
Mathematical aspects of
computer-aided share trading. We consider problems of statistical analysis of share prices and propose
probabilistic characteristics to describe the price series. We discuss three methods of
mathematical modelling of price series with given probabilistic characteristics.
problem (12)
[image:2.595.79.283.209.387.2]computer−aid (13)
Figure 1: Undirected, weighted graph-of-words example.
W = 8and overspans sentences. Stemmed words, weighted
k-core decomposition. Numbers inside parentheses are CoreRank scores. For clarity, non-(nouns and adjectives) in
italichave been removed.
2.2 Graph degeneracy
Within the rest of this subsection, we will consider
G(V, E)to be an undirected, weighted graph with
n =|V|nodes andm =|E|edges. The concept of graph degeneracy was introduced by (Seidman,
1983) and first applied to the study of cohesion in social networks. It is inherently related to thek -core decomposition technique.
k-core. A core of orderk (or k-core) of Gis
a maximal connected subgraph ofGin which ev-ery vertex vhas at least degreek. The degree of
v is the sum of the weights of its incident edges. Note that here, since edge weights are integers (co-occurrence counts), node degrees, and thus, the
k’s, are also integers.
The k-core decomposition of G is the set of
all its cores from 0 or 1 (G itself, respectively in the disconnected/connected case) to kmax (its
main core). As shown in Figure2, it forms a hi-erarchy of nested subgraphs whose cohesiveness and size respectively increase and decrease withk.
The higher-level cores can be viewed as afiltered versionof the graph that excludes noise (actually, the main core of a graph is a coarse approxima-tion of its densest subgraph). This property of the core decomposition is highly valuable when deal-ing with graphs constructed from noisy text. The
core numberof a node is the highest order of a
core that contains this node. As detailed in Algo-rithm 1, thek-core decomposition is obtained by implementing a pruning process that iteratively re-moves the lowest degree nodes from the graph.
Algorithm 1k-core decomposition
Input: Undirected graphG= (V, E)
Output: Core numbersc(v),∀v∈V
1: i←0
2: while|V|>0do
3: while∃v:degree(v)≤ido 4: c(v)←i
5: V ←V \ {v}
6: E←E\ {(u, v)|u∈V} 7: end while
8: i←i+ 1
9: end while
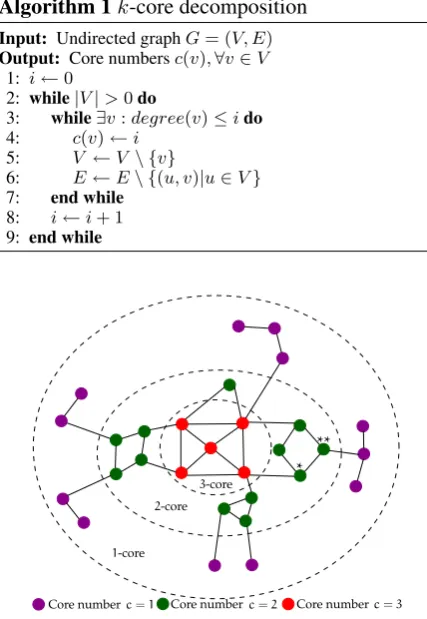
3-core
2-core
1-core
Core numberc=1 Core numberc=2 Core numberc=3
[image:2.595.308.522.226.536.2]* **
Figure 2:k-core decomposition of a graph and illustration of the value added by CoreRank. While nodes?and??have the same core number (=2), node?has a greater CoreRank score (3+2+2=7 vs 2+2+1=5), which better reflects its more
central position in the graph.
Time complexity. While linear algorithms
are available to compute the core decomposi-tion of unweighted graphs (Batagelj and Zaver-snik, 2003), it is slightly more expensive to ob-tain in the weighted case (our setting here), and requires O(mlog(n)) (Batagelj and Zaverˇsnik,
pieces of text, the k-core decomposition is fast enough to be used in real-time settings ( Meladi-anos et al.,2017).
2.3 Submodularity and extractive summarization
Just like their convex counterparts in the continu-ous case, submodular functions share unique prop-erties that make them conveniently optimizable. For this reason, they are are popular and have been applied to a variety of real-world problems, such as viral marketing (Kempe et al.,2003), sen-sor placement (Krause et al., 2008), and docu-ment summarization (Lin and Bilmes, 2011). In what follows, we briefly introduce the concept of submodularity and outline how it spontaneously comes into play when dealing with extractive sum-marization. For clarity and consistency, we pro-vide explanations within the context of document summarization (without loss of generality).
Submodularity. A set functionF : 2V → R
whereV = v1, ..., vn is said to besubmodular
if it satisfies the property of diminishing returns (Krause and Golovin,2012):
∀A⊆B⊆V \v, F(A∪v)−F(A)≥F(B∪v)−F(B)
(1) IfFmeasures summary quality,diminishing re-turnsmeans that the gain of adding a new sentence to a given summary should be greater than the gain of adding the same sentence to a larger summary containing the smaller one.
Monotonocity. Trivially, a set function is
monotone non-decreasingif:
∀A⊆B, F(A)≤F(B) (2) Which means that the quality of a summary can only increase or stay the same as it grows in size, i.e., as we add sentences to it.
Budgeted maximization. The task of
extrac-tive summarization can be viewed as the selection, under a budget constraint, of the subset of sen-tences that best represents the entire set (i.e., the document). This problem translates to a combina-torial optimization task:
arg max
S⊆V F(S)|
X
v∈S
cv ≤B (3)
WhereSis a subset of the full set of sentences
V (i.e., a summary),cv ≥0is the cost of sentence
v, andB is the budget. Finally, F is a summary
quality scoring set function, mapping 2V (the
fi-nite ensemble of all subsets ofV, i.e., of all possi-ble summaries), toR. In other words,F assigns a single numeric score to a given summary.
While finding an exact solution for Equation3
is NP-hard, it was proven that under a cardinal-ity constraint (unit costs), a greedy algorithm can approach it with factor (e−1)/e ≈ 0.63 in the worst case (Nemhauser et al.,1978). However, for this guarantee to hold,Fhas to be submodular and monotone non-decreasing.
More recently, (Lin and Bilmes,2010) proposed a modified greedy algorithm whose solution is guaranteed to be at least1−1/√e≈0.39as good as the best one, under a general budget constraint (not necessarily unit costs). Empirically, the ap-proximation factor was shown to be close to90%. The constraints on F remain unchanged. More precisely, the algorithm of (Lin and Bilmes,2010) iteratively selects the sentence that maximizes the ratio of objective function gain to scaled cost:
F(G∪v)−F(G)
cr
v (4)
WhereGis the current summary,cv is the cost
of sentencev(e.g., number of words, bytes...), and
r > 0, the scaling factor, adjusts for the fact that the objective functionFand the cost of a sentence might be expressed in different units and thus not be directly comparable.
Objective function. The choice of F is what
matters here. Naturally,F should capture the de-sirable properties in a summary, which have tradi-tionally been formalized in the literature as rele-vanceandnon-redundancy.
A well-known function capturing both aspects is Maximum Marginal Relevance (MMR) ( Car-bonell and Goldstein,1998). Unfortunately, MMR penalizes for redundancy, which makes it non-monotone. Therefore, it cannot benefit from the near-optimality guarantees. To address this issue, (Lin and Bilmes,2011) proposed topositively re-warddiversity, with objective function:
F(S) =C(S) +λD(S) (5) Where C and D respectively reward coverage and diversity, andλ≥ 0is a trade-off parameter.
andD.
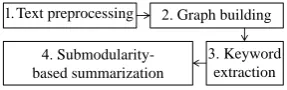
3 Proposed system
Our system can be broken down into the four mod-ules shown in Figure 3, which we detail in what follows.
1. Text preprocessing 2.Graph building
3.Keyword extraction 4.
[image:4.595.109.253.157.202.2]Submodularity-based summarization
Figure 3: Overarching system process flow
3.1 Text preprocessing
The fully unsupervised nature of our system gives it the advantage of being applicable to different languages (and different types of textual input) with only minimal changes in the preprocessing steps. A necessary first step is thus to detect the language of the input text. So far, our model sup-ports English and French, although our experi-ments were ran for the English language only.
•Meeting speech: utterances shorter than 0.85
second are then pruned out, words are lowercased and stemmed, and specific flags introduced by the ASR system (e.g., indicating inaudible sounds, such as “{vocalsound}” in English) are removed. Punctuation is also discarded. Custom stopwords and fillerwords for meeting speech, learned from the development sets of the AMI and ICSI cor-pora1, are also discarded. French stopwords and
fillerwords were learned from a database of French speech curated from various sources2. The
surviv-ing words are considered as node candidates for the next phase, without any part-of-speech-based filtering. Note that the absence of requirement for a POS tagger makes our system even more flexi-ble.
•Traditional documents: standard stopwords
are removed (e.g., SMART stopwords3 for the
English language), punctuation is removed, and words are lowercased and stemmed.
In parallel, a copy of the original untouched ut-terances/sentences is created. It is from this set that the algorithm will select from to generate the summary at step 4. In the meeting domain only, in order to improve readability, the last 3 words
1most frequent words followed by manual inspection
2available at https://github.com/Tixierae/EMNLP2017_
NewSum
3http://jmlr.org/papers/volume5/lewis04a/ a11-smart-stop-list/english.stop
of each utterance are eliminated if they are filler words, and repeated consecutive unigrams (e.g. “remote remote”), and bigrams (e.g. “remote con-trol remote concon-trol”) are collapsed to single terms (“remote”, “remote control”). Note that these ex-tra cleaning steps were performed for our system as well as all the baselines.
3.2 Graph-building
A word co-occurrence network, as defined in Sub-section2.1, is built. The size of the sliding window was tuned on the development sets of each dataset, as will be explained in Subsection4.4.
3.3 Keyword extraction and scoring
We used theDensityandCoreRankheuristics in-troduced by (Tixier et al.,2016a). In brief, these techniques are based on the assumption, verified empirically, that spreading influence is a better “keywordedness” metric than random walk-based ones, such as PageRank. Influential spreaders are those nodes in the graph that can reach a large portion of the other nodes in the network at min-imum time and cost. Research has shown ( Kit-sak et al., 2010) that the spreading influence of a node is better captured by its core number, be-cause unlike the eigenvector centrality or PageR-ank measures, which only capture individual pres-tige, graph degeneracy also takes into account the extent to which a node is part of a dense, cohesive part of the graph. Such positional information is highly valuable in determining the ability of the node to propagate information throughout the net-work.
More precisely, the “Density” and “CoreRank” techniques were shown by (Tixier et al., 2016a) to reach state-of-the-art unsupervised keyword ex-traction performance on medium and large docu-ments, respectively. Both methods decompose the word co-occurrence network of a given piece of text with the weightedk-core algorithm.
• “Density” then computes the density of each
k-core subgraph and selects the optimal cut-off
kbest in the hierarchy as the elbow in the density
vs. kcurve. It finally returns the members of the
kbest-core of the graph as keywords. The
assump-tion is that it is valuable to descend the hierarchy of cores as long as the desirable density properties are maintained, but once they are lost (as identified by the elbow), it is time to stop.
core numbers of its neighbors (see Figure 1), and retains the top p% nodes as keywords (we used p = 0.15). As illustrated in Figure 2, by decreasing granularity from the subgraph to the node level, CoreRank generates a ranking of nodes that better captures their structural position in the graph. Also, stabilizing scores across node neigh-borhoods increases even more the inherent noise robustness property of graph degeneracy, which is particularly desirable when dealing with noisy text such as automatic speech transcriptions.
We encourage the reader to refer to the original paper for more information about the Density and CoreRank heuristics.
3.4 Extractive summarization
An objective function of the form presented in Equation5 and the modified greedy algorithm of (Lin and Bilmes, 2010) are finally used to com-pose summaries by selecting from the original ut-terances with coverage and diversity functions as detailed next.
• Coverage function. We chose a concept-based coverage function. Such functions fulfill the monotonicity and submodularity requirements (Lin and Bilmes,2011). More precisely, we com-pute the coverage of a candidate summary S as the weighted sum of the scores of the keywords it contains:
C(S) =X
i∈S
niwi (6)
Where ni is the number of times keyword i
ap-pears in S, and wi is the score of keyword i.
Non-keywords are not taken into account. There-fore, a summary not containing any keyword gets a null score. Remember that the keywords and their scores are given by the “Density” and “CoreRank” techniques, respectively for the AMI and ICSI cor-pora.
Note that (Riedhammer et al.,2008a) also used a concept-based relevance measure. However, the way we define, and the mechanism by which we extract and assign scores to concepts radically dif-fer. Our degeneracy-based methods natively as-sign weights to all the words in the graph, and then extract keywords based on those weights, while (Riedhammer et al., 2008a) consider all n-grams and then use a basic frequency-based weighting scheme. Our work is also related to (Lin et al.,
2009), but unlike us, the authors use a sentence semantic graph and a different objective function.
•Diversity reward function. We encourage di-versity by taking into account the proportion of keywords covered by a candidate summary, irre-spective of the scores of the keywords:
D(S) =Nkeywords∈S/Nkeywords (7)
Where Nkeywords∈S is the number of (unique)
keywords contained in the summary, and
Nkeywords is the total number of keywords
extracted for the meeting. Promoting non-redundancy is important as our coverage term does not inherently penalizes for redundancy, unlike for instance (Gillick et al.,2009).
4 Experimental setup 4.1 Datasets
We tested our approach on ASR output and regular text. The lists of meetings/documents IDs we used for development and testing are available on the project online repository4.
4.1.1 Meeting speech transcriptions
We used two standard datasets very popular in the field of meeting speech summarization, the AMI and ICSI corpora.
• The AMI corpus (McCowan et al., 2005)
comprises ASR transcripts for 137 meetings where 4 participants play a role within a fictive company. Average duration is 30 minutes (843 ut-terances, 6758 words, unprocessed). Each meet-ing is associated with a human-written abstractive summary of 300 words on average, and with a human-composed extractive summary (140 utter-ances on average). We used the same test set as in (Riedhammer et al.,2008b), featuring 20 meet-ings.
•TheICSI corpus(Janin et al.,2003) is a
col-lection of 57 real life meetings involving between 2 and 6 participants. The average duration, 56 minutes, is much longer than for the AMI meet-ings, which reflects in the average size of the ASR transcriptions (1454 utterances, 15211 words, un-processed). For consistency with previous work, we selected the standard test set of 6 meetings. For each meeting of this test set, 3 human abstractive and 3 human extractive summaries are available, of respective average sizes 390 words and 133 ut-terances.
Note that for both the AMI and ICSI corpora, the ASR word error rate is quite high: it ap-proaches 37%. For each corpus, we constructed a development set of 15 meetings randomly selected from the training set in order to perform parameter tuning.
4.1.2 Traditional documents
We also tested our approach on the DUC2001
corpus5. This collection comprises 304
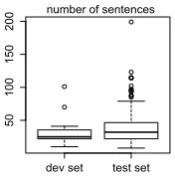
newswire/newspaper articles of average size 800 words. Each document is associated with a human-written abstractive summary of about 100 words. After removing the 13 articles that did not have an abstract and/or a body, whose bodies were shorter than 200 words, and whose abstracts contained less than 10 words, we generated a small development set of 15 randomly selected articles for parameter tuning. We then used the remaining documents as the test set, removing the ones whose size differed too much from the size of the articles in the development set (by at least 2 standard deviations, i.e. exceeded 46 sentences in size, see Fig4). This left us with a test set of 207 documents.
50
100
150
200
number of sentences
[image:6.595.137.225.405.495.2]dev set test set
Figure 4: Size of the DUC2001 documents in development and test sets.
4.2 Evaluation
To align with previous efforts, the extractive sum-maries generated by our system and the baselines (that will be presented subsequently) were com-pared against the human abstractive summaries. We used the ROUGE-1 evaluation metric (Lin,
2004). ROUGE, based on n-gram overlap, is the standard way of evaluating performance in the field of textual summarization. In particular, ROUGE-1, which works at the unigram level, was shown to significantly correlate with human eval-uations. While it has been suggested than cor-relation may be weaker in the meeting domain (Liu and Liu,2008), we stuck to ROUGE because
5http://www-nlpir.nist.gov/projects/duc/ guidelines/2001.html
of the lack of a clear substitute, and for consis-tency with the literature, as a very large majority of studies previously published in the domain use ROUGE.
For each dataset, and for a given summarization method, ROUGE scores were computed for each meeting in the test set and then averaged to obtain an overall score for the method (macro-averaging). For the ICSI corpus, 3 human abstractive sum-maries are available for each meeting in the test set, so an average score was first computed.
4.3 Baseline systems
We benchmarked the performance of our system against six different baselines, presented below. The first two baselines were included based on the best practice recommendation of (Riedhammer et al.,2008b), in order to ease cross-comparison with other studies.
Random. This system randomly selects elements
from the full list of utterances/sentences until the budget is violated. Since this approach is stochas-tic, ROUGE scores were averaged across 30 runs.
Longest greedy. Here, the longest
utter-ance/sentence is selected at each step until the size constraint is satisfied.
TextRank(Mihalcea and Tarau,2004). An
undi-rected complete graph is built where nodes are ut-terances/sentences and edges are weighted accord-ing to the normalized content overlap of their end-points. Finally, weighted PageRank is applied and the highest ranked nodes are selected for inclu-sion in the summary. We used a publicly available Python implementation6.
ClusterRank (Garg et al., 2009). AMI & ICSI
only. ClusterRank is an extension of TextRank tai-lored to meeting summarization. Utterances are first clustered based on their position in the tran-script and their TF-IDF cosine similarity. Then, a complete graph is built from the clusters, with normalized cosine similarity edge weights. Fi-nally, each utterance is assigned a score based on the weighted PageRank score of the node it be-longs to and its cosine similarity with the node centroid. The utterances associated with the high-est scores are then added to the summary, if they differ enough from it. Since the authors did not make their code publicly available, we wrote our own implementation in Python7. We set the
win-6https://github.com/summanlp/textrank
0.10 0.15 0.20 0.25 0.30 0.35 ● ● our model longest greedy random oracle textRank clusterRank PageRank submodular
100 150 200 400 450 500 ● ● ● ● ● ● ● ● ● ● ● ● ● ● ● ● ● ● 0.20 0.25 0.30 0.35
250 300 350
● ● our model longest greedy random oracle textRank clusterRank PageRank submodular
100 150 200 400 450 500 ● ● ● ● ● ● ● ● ● ● ● ●● ● ● ● ● ● 0.15 0.20 0.25 0.30
250 300 350 summary size (words)
250 300 350
● ● our model longest greedy random oracle textRank clusterRank PageRank submodular
100 150 200 400 450 500 ● ● ● ● ● ● ● ● ● ● ● ● ● ● ● ● ● ● 0.15 0.20 0.25 0.30 0.35 0.40 0.45
ROUGE−1 Recall ●
● our model longest greedy random oracle textRank clusterRank PageRank submodular
100 150 200 400 450 500 ● ● ● ● ● ● ● ● ● ● ● ● ● ● ● ● ● ● 0.25 ROUGE−1 Precision 0.30 0.35 0.40
250 300 350
● ● our model longest greedy random oracle textRank clusterRank PageRank submodular
100 150 200 400 450 500 ● ● ● ● ● ● ● ● ● ● ● ● ● ● ● ● ● ● 0.20 0.25 0.30 0.35
250 300 350 summary size (words)
ROUGE−1 F1−score
250 300 350
● ● our model longest greedy random oracle textRank clusterRank PageRank submodular
100 150 200 400 450 500 ● ● ● ● ● ● ● ● ● ● ● ● ● ● ● ● ● ● AMI ICSI 0. 30 0. 40 0. 50 0. 60 0. 70 ● ● ● ● ● ● ● ● ● ● ● ● ● ● ● ● ● ● ● ● ● ● ● ● our model longest greedy random textRank PageRank submodular
50 75 100 125 150 175 200 225 250 275 300
0. 25 0. 30 0. 35 0. 40 0. 45 0. 50 ● ● ● ● ● ● ● ● ● ● ● ● ● ● ● ● ● ● ● ● ● ● ● ● our model longest greedy random textRank PageRank submodular
50 75 100 125 150 175 200 225 250 275 300
0. 36 0. 38 0. 40 0. 42 0. 44 ● ● ● ● ● ● ● ● ● ● ● ● ● ● ● ● ● ● ● ● ● ● ● our model longest greedy random textRank PageRank submodular
50 75 100 125 150 175 200 225 250 275 300 DUC2001
[image:7.595.87.513.62.439.2]summary size (words)
Figure 5: ROUGE-1 score comparisons for various budgets, on the 3 datasets used in this study.
dow threshold parameter to 3 like in the original paper, but increased the similarity threshold from 0.4 to 0.6 because 0.4 returned too many clusters.
PageRank submodular(PRsub). This baseline is
exactly the same as our system, the only difference being that keyword scores are obtained through weighted PageRank rather than via a degeneracy-based technique (Density or CoreRank).
Oracle. AMI & ICSI only. This last baseline
ran-domly selects utterances from the human extrac-tive summaries until the budget has been reached. Again, we average ROUGE scores over 30 runs to account for the randomness of the procedure. Note that this approach assumes the human extractive summaries to be the best possible ones, which is arguable.
4.4 Parameter tuning
• λ and r. Recall that the main tuning parame-ters of our method and the PageRank submodular baseline (PRsub) areλ, which controls the
trade-off between the coverage and the diversity termsC
andDof our objective function, andr, the scaling factor, which makes the gain in objective function value and utterance cost comparable (see Equa-tion4). To tune these parameters, we conducted a grid search on the development set of each corpus, retaining the parameter combination maximizing the average ROUGE-1 F1-score, for summaries of fixed size equal to 300 and 100 words, respectively for the AMI & ICSI and the DUC2001 corpora. More precisely, our grid had axes[0,7]and[0,2]
forλandr respectively, with steps of0.1in each case. The bestλandr for each dataset are sum-marized in Table1.
turned out to be best on the AMI corpus, while CoreRank yielded better results on the ICSI and DUC2001 corpora.
The reason why is not entirely clear. ( Tix-ier et al., 2016a) initially found that with respect to keyword extraction, Density was better suited to medium-size documents (∼ 400 words) while CoreRank was superior on longer documents (∼
1,300 words), because the latter is working at a finer granularity level (node level instead of subgraph level), and thus enjoys more flexibility. However, the AMI corpus comprises much bigger pieces of text (2,200 words on average, after pre-processing). Therefore, we could have expected the CoreRank heuristic to give better results on this dataset also. We hypothesize that the differ-ence in task might explain why this is not the case. Indeed, in keyword extraction, we are interested inselectingkeywords for direct comparison with the gold standard, whereas in summarization, we are only interested inscoringkeywords, as an in-termediary step towards sentence scoring and se-lection. Therefore, in summarization, working at the subgraph level and extracting larger numbers of keywords is not directly equivalent to sacri-ficing precision, since the less relevant keywords will have minimal impact on the sentence selec-tion process due to their low scores.
System AMI ICSI DUC2001 Our model (2,0.9) (5,0.3) (0.6,0.1)
[image:8.595.328.507.288.363.2]PRsub (4.7,0.5) (4,0.6) (1.6,0.2)
Table 1: Optimal parameter values (λ,r) for our system and the submodular baseline.
As shown in Table1, theλvalues are all non-zero (and quite high), indicating that including a regularization term favoring diversity in our ob-jective function is necessary. Moreover, the signif-icantly greater values reached byλon the AMI & ICSI datasets show that ensuring diversity is even more important when dealing with meeting tran-scripts, most probably because there is much more redundancy in spontaneous, noisy utterances than in sentences belonging to properly written news article, and also because more (sub)topics are dis-cussed during meetings.
5 Results
5.1 Quantitative results
We consider the cost of an utterance/a sentence to be the number of words it contains, and the budget
to be the maximum size allowed for a summary, measured in number of words. For each meet-ing/document in the test sets, we generated extrac-tive summaries with budgets ranging from 100 to 500 words (AMI & ICSI corpora) and from 50 to 300 words (DUC2001 collection), with steps of 50 in each case.
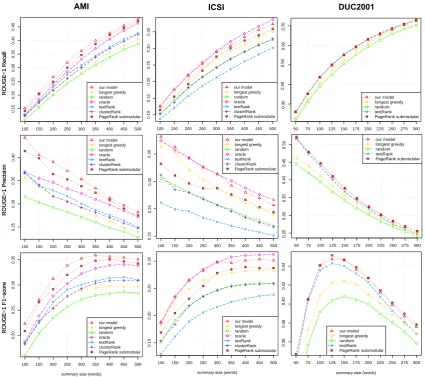
Results for all datasets and all budgets are shown in Figure5, while Tables2,3, and4provide detailed comparisons for the budget correspond-ing to the best performance achieved by a non-oracle system, respectively on the AMI, ICSI, and DUC2001 datasets. We tested for statistical signif-icance in macro-averaged F1 scores using the non-parametric version of the t-test, the Mann-Whitney U test8.
System Recall Precision F-1 score Our model 39.98 33.40 35.88?
PRsub 38.73 32.41 34.80 Oracle 37.02 30.99 33.27 TextRank 34.33 28.66 30.82 ClusterRank 33.87 28.18 30.35 Longest greedy 32.61 27.47 29.41 Random 31.06 26.05 27.95
Table 2: Macro-averaged ROUGE-1 scores on the AMI test set (20 meetings) for summaries of 350 words.?Statistically
significant difference (p <0.03) w.r.t. all baselines except PRsub.
System Recall Precision F-1 score Oracle 36.64 27.59 31.16 Our model 35.60 26.94 30.34?
[image:8.595.329.506.418.494.2]PRsub 33.97 25.28 28.70 Longest greedy 33.37 25.06 28.33 Random 31.06 22.83 26.02 ClusterRank 31.00 22.48 25.78 TextRank 28.19 20.71 23.57
Table 3: Macro-averaged ROUGE scores on the ICSI test set (6 meetings) for summaries of 450 words.?Statistically significant difference (p <0.05) w.r.t. all baselines except
the oracle and PRsub.
System Recall Precision F-1 score PRsub 50.17 41.08 45.13 Our model 49.69 40.71 44.71?
TextRank 50.00 39.92 44.29 Longest greedy 47.22 38.29 42.25 Random 45.13 36.61 40.39
Table 4: Macro-averaged ROUGE scores on the DUC2001 test set (207 documents) for summaries of 125 words. ?Statistically significant difference (p <0.03) w.r.t. the
Longest greedy and Random baselines.
•Meeting domain. Our approach significantly
outperforms all baselines on the AMI corpus (in-cluding the oracle) and all systems on the ICSI corpus (except the oracle), both in terms of pre-cision and recall. Also, our system proves
[image:8.595.328.507.551.607.2]sistently better throughout the different summary sizes. Until the peak is reached, the margin in F1 score between our model and the competitors even tend to widen as the budget increases.
Performance is weaker for all models on the ICSI corpus because in that case the system sum-maries have to jointly match 3 human sumsum-maries of different sizes (instead of a single summary), which is a much more difficult task.
Best performance is attained for a larger budget on the ICSI corpus (450 vs. 350 words), which can be explained by the fact that the ICSI human sum-maries tend to be larger than the AMI ones (390 vs 300 words, on average). Finally, remember that the extractive summaries generated by the systems were compared against theabstractivesummaries freely written by human annotators, using their own words. This makes it impossible for extrac-tive systems to reach perfect scores, because the gold standard contains words that were never used during the meeting, and thus that do not appear in the ASR transcriptions. Overall, our model is very competitive to the oracle, which is notable since the oracle has direct access to the human extrac-tive summaries.
• Regular documents. The absolute ROUGE
scores and the margins between systems are much greater (resp. smaller) than on the AMI and ICSI corpora, confirming without surprise that summarization is a much easier task when per-formed on well-written documents than on spon-taneous meeting speech transcriptions. Although very close (0.42 difference in F1-score), our method does not reach absolute best performance, which is attained by the submodular baseline with PageRank-based coverage function, for sum-maries of 125 words (average size of the gold stan-dard summaries is about 100 words). The ab-sence of superiority on this dataset might be ex-plained by the fact that graph degeneracy really adds value when dealing with noisy input, such as automatic speech transcriptions. However, on regular documents, the recognized superiority of degeneracy-based techniques over PageRank ( Tix-ier et al.,2016a;Rousseau and Vazirgiannis,2015) for keyword extraction does not seem to translate into a significantly better measure of coverage for sentence scoring.
5.2 Qualitative results
Instead of providing a single sample summary at the end of this paper, we deployed our system as an interactive web application9. With the
inter-face, the user can generate summaries with our system for all the meetings/documents in the AMI, ICSI, and DUC2001 test sets. Custom files are ac-cepted as well, and links to examples of such files in French and English are provided.
What can be observed in the meeting domain is that while the keywords extracted tend to be very relevant and their scores meaningful, and while the utterances selected by our system tend to have good coverage and relatively low redundancy, the summaries suffer in readability, which can be ex-plained by the fully extractive nature of our ap-proach, and the low quality of the input (37% word error rate). This qualitative aspect of performance is not captured by ROUGE-1 which simply com-putes unigram overlap statistics.
6 Conclusion
We presented a fully unsupervised system that uses a powerful submodularity framework intro-duced by past research to generate extractive sum-maries of textual documents in a greedy way with near-optimal performance guarantees. Our prin-cipal contribution is in the coverage term of the objective function that is optimized by the greedy algorithm. This term leverages graph degeneracy applied on word co-occurrence networks to rank words according to their structural position in the graph. Evaluation shows that our system reaches state-of-the-art extractive performance, and is es-pecially well-suited to be used on noisy text, such as ASR output from meetings. Future work should focus on improving the readability of the final summaries. To this purpose, unsupervised graph-based sentence compression and/or natural lan-guage generation techniques, like in (Filippova,
2010;Mehdad et al.,2013) seem very promising.
7 Acknowledgments
We are thankful to the three anonymous reviewers for their helpful comments and suggestions, and to Prof. Benoˆıt Favre for his kind help in getting access to the meeting datasets. This research was supported by the OpenPaaS::NG project.
References
Vladimir Batagelj and Matjaˇz Zaverˇsnik. 2002.
Gener-alized cores.arXiv preprint cs/0202039.
Vladimir Batagelj and Matjaz Zaversnik. 2003. An o (m) algorithm for cores decomposition of networks. arXiv preprint cs/0310049.
Jaime Carbonell and Jade Goldstein. 1998. The use of mmr, diversity-based reranking for reordering
doc-uments and producing summaries. InProceedings
of the 21st annual international ACM SIGIR confer-ence on Research and development in information retrieval. ACM, pages 335–336.
Katja Filippova. 2010. Multi-sentence compression:
Finding shortest paths in word graphs. In
Pro-ceedings of the 23rd International Conference on Computational Linguistics. Association for Compu-tational Linguistics, pages 322–330.
Nikhil Garg, Benoit Favre, Korbinian Reidhammer, and Dilek Hakkani T¨ur. 2009. Clusterrank: a graph based method for meeting summarization. Techni-cal report, Idiap.
Daniel Gillick, Benoit Favre, Dilek Hakkani-T¨ur, Bernd Bohnet, Yang Liu, and Shasha Xie. 2009. The
icsi/utd summarization system at tac 2009. InTAC.
Zellig S Harris. 1954. Distributional structure. Word
10(2-3):146–162.
Adam Janin, Don Baron, Jane Edwards, Dan Ellis, David Gelbart, Nelson Morgan, Barbara Peskin, Thilo Pfau, Elizabeth Shriberg, Andreas Stolcke,
et al. 2003. The icsi meeting corpus. In
Acous-tics, Speech, and Signal Processing, 2003. Proceed-ings.(ICASSP’03). 2003 IEEE International Confer-ence on. IEEE, volume 1, pages I–364.
David Kempe, Jon Kleinberg, and ´Eva Tardos. 2003. Maximizing the Spread of Influence through a
So-cial Network. In Proceedings of the 9th
Inter-national Conference on Knowledge Discovery and Data Mining. pages 137–146.
Maksim Kitsak, Lazaros K Gallos, Shlomo Havlin, Fredrik Liljeros, Lev Muchnik, H Eugene Stanley, and Hern´an A Makse. 2010. Identification of
in-fluential spreaders in complex networks. Nature
Physics6(11):888–893.
Andreas Krause and Daniel Golovin. 2012.
Submod-ular function maximization. Tractability: Practical
Approaches to Hard Problems3(19):8.
Andreas Krause, Jure Leskovec, Carlos Guestrin, Jeanne VanBriesen, and Christos Faloutsos. 2008. Efficient sensor placement optimization for securing
large water distribution networks. Journal of Water
Resources Planning and Management 134(6):516– 526.
Chin-Yew Lin. 2004. Rouge: A package for
auto-matic evaluation of summaries. InText
summariza-tion branches out: Proceedings of the ACL-04 work-shop. volume 8.
Hui Lin and Jeff Bilmes. 2010. Multi-document sum-marization via budgeted maximization of
submod-ular functions. InHuman Language Technologies:
The 2010 Annual Conference of the North American Chapter of the Association for Computational Lin-guistics. Association for Computational Linguistics, pages 912–920.
Hui Lin and Jeff Bilmes. 2011. A Class of
Submodu-lar Functions for Document Summarization. In
Pro-ceedings of the 49th Annual Meeting of the Associ-ation for ComputAssoci-ational Linguistics: Human Lan-guage Technologies. pages 510–520.
Hui Lin, Jeff Bilmes, and Shasha Xie. 2009. Graph-based submodular selection for extractive
summa-rization. In Automatic Speech Recognition &
Un-derstanding, 2009. ASRU 2009. IEEE Workshop on. IEEE, pages 381–386.
Feifan Liu and Yang Liu. 2008. Correlation between rouge and human evaluation of extractive meeting
summaries. InProceedings of the 46th annual
meet-ing of the association for computational lmeet-inguistics on human language technologies: Short papers. As-sociation for Computational Linguistics, pages 201– 204.
Iain McCowan, Jean Carletta, W Kraaij, S Ashby, S Bourban, M Flynn, M Guillemot, T Hain, J Kadlec, V Karaiskos, et al. 2005. The ami
meet-ing corpus. InProceedings of the 5th International
Conference on Methods and Techniques in Behav-ioral Research. volume 88.
Kathleen McKeown, Julia Hirschberg, Michel Galley, and Sameer Maskey. 2005. From text to speech
summarization. In Acoustics, Speech, and Signal
Processing, 2005. Proceedings.(ICASSP’05). IEEE International Conference on. IEEE, volume 5, pages v–997.
Yashar Mehdad, Giuseppe Carenini, Frank W Tompa, and Raymond T Ng. 2013. Abstractive meeting
summarization with entailment and fusion. InProc.
of the 14th European Workshop on Natural Lan-guage Generation. pages 136–146.
Polykarpos Meladianos, Giannis Nikolentzos, Franc¸ois Rousseau, Yannis Stavrakas, and Michalis Vazir-giannis. 2015. Degeneracy-based real-time
sub-event detection in twitter stream. InNinth
Interna-tional AAAI Conference on Web and Social Media (ICWSM).
Polykarpos Meladianos, Antoine J-P Tixier, Giannis Nikolentzos, and Michalis Vazirgiannis. 2017.
Real-time keyword extraction from conversations. EACL
Rada Mihalcea and Paul Tarau. 2004. TextRank:
bringing order into texts. InProceedings of the 2004
Conference on Empirical Methods in Natural Lan-guage Processing (EMNLP). Association for Com-putational Linguistics.
Gabriel Murray, Steve Renals, and Jean Carletta. 2005. Extractive summarization of meeting recordings. . George L Nemhauser, Laurence A Wolsey, and
Mar-shall L Fisher. 1978. An analysis of approximations
for maximizing submodular set functionsi.
Mathe-matical Programming14(1):265–294.
Korbinian Riedhammer, Benoit Favre, and Dilek Hakkani-Tur. 2008a. A keyphrase based approach
to interactive meeting summarization. In Spoken
Language Technology Workshop, 2008. SLT 2008. IEEE. IEEE, pages 153–156.
Korbinian Riedhammer, Dan Gillick, Benoit Favre, and Dilek Hakkani-T¨ur. 2008b. Packing the meeting
summarization knapsack. InNinth Annual
Confer-ence of the International Speech Communication As-sociation.
Franc¸ois Rousseau and Michalis Vazirgiannis. 2013. Graph-of-word and tw-idf: new approach to ad hoc
ir. In Proceedings of the 22nd ACM international
conference on Conference on Information & Knowl-edge Management (CIKM). ACM, pages 59–68. Franc¸ois Rousseau and Michalis Vazirgiannis. 2015.
Main core retention on graph-of-words for
single-document keyword extraction. InEuropean
Confer-ence on Information Retrieval. Springer, pages 382– 393.
Stephen B Seidman. 1983. Network structure and
min-imum degree. Social networks5(3):269–287.
Antoine J-P Tixier, Fragkiskos D Malliaros, and Michalis Vazirgiannis. 2016a. A graph
degeneracy-based approach to keyword extraction. In
Proceed-ings of the Conference on Empirical Methods in Nat-ural Language Processing.
Antoine J-P Tixier, Konstantinos Skianis, and Michalis Vazirgiannis. 2016b. Gowvis: a web application for graph-of-words-based text visualization and