to the minimum area to the minimum area required for vapour}liquid disengagement. The DCBUSF de-termines the approach of the downcomer froth height to the downcomer depth ("tray spacing#outlet weir height). Safety factors in the range of 1.5}2.0 are recommended.
Pressure Drop
The pressure drop across an operating tray should be speciRed if it affects the number of equilibrium stage requirements for the separation. This is often the case for vacuum applications. Stable operation can be obtained at a pressure drop of 1}3 in (2.5}7.6 cm) of liquid per tray for vacuum and 2}5 in (5.1}12.7 cm) for pressure operations.
Design Calculations
Tray Hydraulics
The hydraulic performance of a sieve tray for a given layout may be calculated using the methods presented in ‘Distillation/Tray Columns: Performance’. Tray Ef\ciency
Tray efRciency is a strong function of the physical properties of the vapour and liquid streams. It is also affected, to a lesser extent, by theSow rates and tray layout. In the latter case, only hole diameter, hole area and weir height have a small inSuence on the tray efRciency. The optimum design, which gives the maximum number of equilibrium stages in a column, is often obtained at minimum tray spacing and min-imum number ofSow paths that satisfy the hydraulic design criteria.
Conclusions
A well-designed tray should be economical while meeting all process design requirements. Economic
considerations suggest that it is best to use the smallest column diameter and height that satisfy the process requirements within reasonable safety allow-ances. Process requirements include accommodation of the expected liquid and vapourSow ranges and the optimization of tray efRciency.
See also: II/Distillation: Packed Columns: Design and Performance; Theory of Distillation; Tray Columns: Perfor-mance.
Further Reading
Billet R (1979)Distillation Engineering. New York: Chem-ical Publishing Co.
Fair JR (1963) In: Smith BD (ed.)Design of Equilibrium Stage Processes. New York: McGraw-Hill.
Fair JR (1987) In: Rousseau RW (ed.) Handbook of Separation Process Technology, ch. 5. New York: John Wiley.
Fair JR, Steinmeyer DE, Peuney WR and Crocker BB (1997). In: Perry RH and Green D (eds)Perry’s Chem-ical Engineers’ Handbook, 7th edn, sect. 14. New York: McGraw-Hill.
Humphrey JL and Keller GE II (1997)Separation Process Technology. New York: McGraw-Hill.
Kister HZ, (1992) Distillation Design. New York McGraw-Hill.
Lockett MJ (1986)Distillation Tray Fundamentals. Cam-bridge: Cambridge University Press.
Lygeros AI and Magoulas KG (1986) Column Sooding and entrainment. Hydrocarbon Processing 65: 43}44.
McCabe WL, Smith JC and Harriott P (1993)Unit Opera-tions of Chemical Engineering, 5th edn. New York: McGraw-Hill.
Ogboja O and Kuye A (1991) A procedure for the design and optimization of sieve trays. Transactions of the Institution of Chemical Engineers445.
Rose LM (1985)Distillation Design in Practice. Amster-dam: Elsevier.
Tray Columns: Performance
K. Nandakumar and K. T. Chuang, University of Alberta,
Edmonton, Alberta, Canada
Copyright^ 2000 Academic Press
Introduction
As pointed out in the article entitled distillation tray columns: design, a sieve tray is designed with a
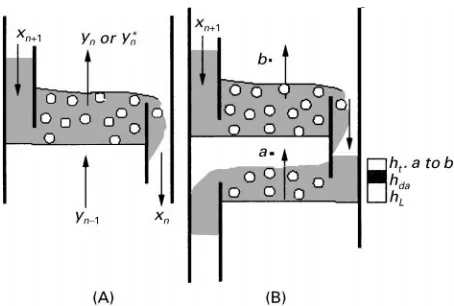
Figure 1 (A) Murphree tray efficiency. (B) Head in the down-comer.
Figure 2 Steps in performance evaluation. conditions in the column such asweeping,Uoodingor
high vapourentrainment.
Numerous geometrical factors have to be selected by the designer such as: (i) column diameter; (ii) tray spacing; (iii) top and bottom downcomer area; (iv) number ofSow passes; (v) hole diameter and density; (vi) tray thickness; and (vii) weir design. This is a highly empirical process which depends on empiri-cal design equations that describe the tray hydraulics and rule-of-thumb guidelines that have evolved over several decades of operating experience. Thus, the design of sieve tray columns has remained an art, although commercial process simulation software packages such as ASPEN, PRO II, HYSIM, etc., are trying to codify these procedures into their design packages. The conceptual steps in the design proced-ure together with the rule-of-thumb guidelines have been presented in the Tray Columns: Design article. Since frequent reference will be made to that article, we will henceforth refer to it simply as Part I.
In contrast, the performance analysis problem is relatively more scientiRc, in the sense that a series of well-deRned steps leads to the estimation of the Murphree tray efRciency, thecolumn efTciency and theactual number of trays. The overall column efR -ciency,Eo, is deRned as:
Eo"
Nequilibrium
Nactual
[1]
where Nequilibrium is obtained from stagewise equilib-rium design calculations. Performance evaluation boils down to estimatingEoso that the actual number of trays,Nactual, can be determined. The overall col-umn efRciency, Eo, is related to the Murphree tray efRciency, EMV, through the Lewis relationship (as-suming constant slopes of equilibrium and operating lines), given by:
Eo"
ln [1#EMV(!1)] ln
where "mG/L is the separation factor, m is the slope of the equilibrium line, and (G,L) are the vapour and liquid Sow rates in kmol s\1. Thus the Murphree tray efRciency,EMV, must be estimated in order to determine the column efRciency. The urphree tray efRciency is deRned to provide a measure of departure from the assumption ofideal equilibrium tray that is used to determine the number of ideal stages required to achieve a given separation. It is deRned as:
EMV"
yn!yn\1
yHn!yn\1
[2]
Figure 1A illustrates various compositions.yn is the actual composition of the vapour stream leaving tray
n, whileyHn is the composition that is in equilibrium with the exit liquid stream.
These two compositions would be the same, if and only if the condition ofideal equilibrium trayis satis-Red. Since it is never satisRed in practice, it is impor-tant to be able to predict the tray efRciency. In fact, the compositions are not even uniform across the tray deck. Hence the above deRnition is applied at a local point on the tray and the point efRciency is integrated with thevariations inUow conditionsto predict a tray efRciency. The relationship between the inputs and the sequence of calculations is shown inFigure 2.
The tray efRciency,EMV, clearly depends on: (i) the geometrical design parameters chosen as outlined in Part I; (ii) the physical properties of the system such as density, viscosity, surface tension, etc.; and (iii) the operating conditions like the vapour/liquid Sow rates.
Having selected the design parameters identiRed in Part I, the objective of the performance analysis step is to predict: (i) the tray hydraulics (including the pressure drop, theSow regime, the froth density, the entrainment and weeping factors); (ii) the point efR -ciency; (iii) the Murphree tray efRciency; and (iv) the column efRciency. In the initial stages of designing a new tray column, there is feedback between the design and performance analysis steps to arrive at a set of optimal design parameters, as outlined in the Sow chart (Figure 5 of part I). But the performance analysis steps to be outlined in this part, are also useful in analysing the performance of an existing tray column, although the opportunity to pick opti-mal design conditions is not present as one is forced to deal with an existing tray.
An excellent summary of the equations used to study the performance of a sieve tray column can be found in Zuiderweg (1982), Lockett (1986) and Kis-ter (1992) (see Further Reading). The detailed steps involved in the performance analysis include: (i) the pressure drop prediction; (ii) froth height and density calculations; (iii) point efRciency prediction; and (iv) tray efRciency prediction. The inputs required are: (i) tray geometry; (ii) physical properties; and (iii)Sow conditions.
Steps in Performance Analysis
Pressure Drop Calculation in Vapour Phase
The pressure drop in the vapour phase across a sieve tray is modelled as (Zuiderweg, 1982):
P"Pdry#lghl [3] where the dry pressure drop is given by:
Pdry" 1 2G
ug,h
CD
2[4]
Here, g is the acceleration due to gravity, hl is the liquid height or hold-up in metres,ug,his the vapour velocity in the hole in metres per second, CD is the drag coefRcient, and (G,l) are the densities of the vapour and liquid, respectively. The second term in eqn [3] represents the static head due to the liquid hold-up on the tray. Hence the liquid height,hlmust be predicted from correlations that depend on the
weir geometry. One such equation that predicts the liquid height is given by:
hl"0.6H0.5w p0.25(FP/b)0.25 25 mm(Hw(100 mm [5] Here,Hw is the weir height in metres,p is the pitch of the holes in the sieve plate in metres,
FP"(ul/ug)((l/g) is the Sow parameter, b is the weir length per unit bubbling area in metres\1.
The discharge coefRcient, CD in eqn [4] is a function of theSow conditions near a hole. It is in fact dependent on the liquid present on the tray. It is correlated by:
CD"0.7
1!0.14ghll
u2
g,hg
2/3
[6]All of the quantities appearing on the right-hand side have been deRned previously.
Pressure Drop Calculation in the Liquid Phase
The liquid is transported down through the down-comer. The capacity of the downcomer should be sufRcient to handle the liquid load without becoming the rate limiting factor, i.e. without the liquid backing up the downcomer to a signiRcant extent. Figure 1B shows the pressure differential components making up the total head differential on the liquid side as the liquid backs up the downcomer to a height ofhdc. The extent of liquid back-up can be estimated from:
hdc"ht#hda#hL [7] where ht is the pressure difference between points
aandbin the vapour phase that is necessary to keep the vapourSowing upwards,hLrefers to the effective clear liquid height on the tray deck that must be overcome by the liquid in the downcomer, and
hdarefers to the pressure loss due to the liquid Sow under the downcomer apron. Note thathtis necessary to keep the upwardSow of vapour, but acts as a pres-sure differential that works against the natural liquid Sow in the downcomer. If this pressure differential is large, the liquid will back up more in the downcomer. This points out the coupling between the pressure loss in the vapour phase through the tray deck area and the liquidSow in the downcomer. An optimal design must balance these two factors carefully.
hL and ht can be estimated from the correlations provided in the previous section.hdacan be estimated from:
where hda is in millimetres of liquid and Uda is the velocity under the downcomer apron in metres per second.
Froth Height and Density Calculation
The froth density (or the two-phase density) has been measured using gamma ray techniques. The average liquid volume fraction on a sieve tray, deRned as Nl"hl/hb, is correlated by:
1 Nl!
1"c1
ug (ghl)0.5
G L
0.5
n[8] Here,hbis the froth or bed height in metres andugis the vapour velocity on bubbling area in metres per second. The constantsc1andndepend on the type of Sow regimes. In the spray regime, they take on the values of c1"265 and n"1.7, while in the
[image:4.568.324.517.146.201.2]mixed/emulsion regime, they are 40 and 0.8. This requires one to estimate the Sow regime to be ex-pected under a given set of operating conditions. In Figure 3 of Part I, we identiRed the limits of operation to lie between the weeping and Sooding conditions as the vapour rate is increased. Even within this permissible range of operation, theSow condition has been observed to change fromspraytofrothto emul-sion to bubble Uow regimes. The transition into the spray regime is given by the capacity factor de-Rned as:
CF"ug
g l0.5
"0.85g
0.5h1.5
l )F
dh
Here,CFis the capacity factor deRned asug((G/L) in metres per second,ugis the vapour velocity in the bubbling area in metres per second,Fis the fractional hole area per unit bubbling area and dh is the hole diameter in metres. The transition from the spray/froth to emulsion/bubbleSow regime is con-trolled by the ratio of horizontal liquid momentum to vertical vapour momentum and is given by:
ul
ug
l G0.5 "bFP)h
l'
3.0
where ul is the horizontal liquid velocity, ug is the vapour velocity on bubbling area in metres per second, andFPis theSow parameter deRned in eqn [5],bis the weir length per unit bubbling area in metres\1,h
lis the liquid height or hold-up in metres.
Point Ef\ciency Calculation
There are many empirical correlations for predicting the mass transfer efRciencies on sieve trays. The most recent one is that proposed by Chen and Chuang (1993). It is based on data from industrial sized col-umns of Fractionation Research Inc. The point efR
-ciency is related to the overall number of transfer units by:
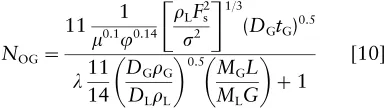
EOG"1!e\NOG [9] Chen and Chuang present the following correlation for
NOGusing data free of weeping and entrainment. But the data set spans both the froth and spray regimes:
NOG"
11 1
0.10.14
LF2s2
1/3(DGtG)0.5
1114
DGGDLL
0.5 MGLMLG
# 1[10]
Here"mG/Lis the separation factor,Fs"us(G is the superRcial F-factor in kg0.5/m0.5s, t
G"hf/usis the vapour-phase contact time in seconds, andhf is the froth height in metres. Note that this correlation combines thegeometrical parameterssuch as, the fractional perforated area,Ab the bubbling area, the
system propertiessuch as densities (L,G), diffusivi-ties (DL,DG) viscosity (), the interfacial tension () in newtons per metre, the molecular weights (ML,MG), and operating conditions such as (L,G), Sow rates. This correlation appears to predict the point efRciencies to within 5% of experimental data over a wide range of pressures.
Murphree Tray Ef\ciency Calculation
The point efRciency model presented above is based on a detailed examination of mass transfer at the vapour/liquid interface. The ideal equilibrium tray assumptionused in the McCabe}Thiele method as-serts that theSow condition on a tray is homogeneous everywhere. If that were true, the point efRciency would be the same everywhere on the tray. But there is strong evidence that theSow is not homogeneous, the degree of inhomogeneity being larger in large diameter columns. Several researchers have tried to measure the velocity proRles across a sieve tray and increasingly computational Suid dynamics is being used as a tool to predict such Sow Relds. (See for example Solari and Bell (1986) and Mehta et al. (1998)). This information on Sow proRle must be integrated with the point efRciency calculations in order to predict a Murphree tray efRciency. One such method is given below as an illustration. This model considers only the effect of longitudinal mixing. A measure of the effective diffusivity,DEis needed in this model. Models of other Sow conRguration are discussed in Lockett (1986):
EMV
EOG"
1!e\(E#Pe) (#Pe)1#[(#Pe)/]
where:
"Pe2
1#4EOGPe
1/2 !1
andPeis the Peclet number, deRned asPe"Z2 l/DEtl. HereZlis the length of liquid travel, or the distance between the two weirs andtl is the liquid residence time. The effective diffusivity is given by:
(DE"0.0124#0.017uG#0.0025L#0.0150W [12] whereDEis in square feet per second,uGis superRcial gas velocity, expressed as cubic feet per second divided by the active bubbling area in square feet. As the Peclet number becomes large, this model predicts efRciency enhancement much large than unity. In large diameter columns (largeZl) the Pecletnumber can tend to take a large value which would suggest signiRcant efRciency enhancements. But it should be remembered that the above model considers only the
longitudinal mixing process. In large diameter col-umns, the liquid Sow structure can be much more complicated as documented by Solari and Bell (1986). Hence, predicted values ofEMV/EOGgreater than 1.2 by the longitudinal mixingmodel should be viewed with caution, as they may not be realized in theReld. Effect of Entrainment on Murphree
Tray Ef\ciency
The effect of entrainment on the Murphree tray efR -ciency is estimated from:
EMV,entrain"EMV
1
1#EMV/(1!)
[13] where:
"Le #e"
absolute entrainment total liquid flow rate
where e is the entrained liquid in moles per hour. Zuiderweg presents the following empirical equation to predict the liquid entrainment in the spray regime:
"1.0;10\8
hbHs
3 ug,hul
for0.3(hb
Hs (0.9
Here Hsis the tray spacing in metres, hb is the bed height as deRned in eqn [8],ug,his the vapour velocity in the hole in metres per second andulis the horizon-tal liquid velocity.
Weeping Point Determination
When the vapour velocity is too small, the liquid on a tray deck canSow down through the holes on the
sieve plate, instead of the downcomer, which is the preferred path for the liquid. If weeping is signiRcant, then it results in mixing of liquid streams between two neighbouring trays, thus degrading the perfor-mance of the column. The need to avoid weeping places a limit on the minimum vapour velocity. Zuiderweg presents the following correlations to pre-dict the minimum operating limit.
Mixed/free bubbling regime
CFw"F(ghl
1!0.15FP bhl
EmulsionUow regime
CFw"0.45F(ghl
whereCFw"ug(G/(L!G) is the capacity factor at the weep point in metres per second, andFis the fractional hole area per unit bubbling area. Correla-tions to estimate the type ofSow regime are given by Zuiderweg. Note that weeping will seldom occur in the spray regime as vapour velocities are sufRciently large under design conditions. The effect of weeping on the tray efRciency calculation has been studied by Kageyama (1969).
Extensions to Multicomponent
Systems
The methods outlined above have been developed largely using experimental data for binary, two-phase systems. The question of whether they can be applied to multicomponent systems can be examined as fol-lows. Tray hydraulics factors such as pressure drops, Sow regimes, froth densities, etc., depend only on the Suid mechanics of the two-phase mixture on sieve trays; hence one can expect the correlations to be useful for multicomponent mixtures as long as mix-ture properties for densities, viscosities, interfacial tensions, etc., are used. On the other hand, the point efRciency (and hence the Murphree tray efRciency) depends on the mass transfer resistance of each component species in each phase. Since the diffusivi-ties and the equilibrium ratios (or the slope of the equilibrium curve,m) could vary for each species, the point efRciency will be different for each species. The correlation given in eqn [10] is based on binary mass transfer data.
Murphree tray efRciency is determined for such a bi-nary pair. One then has the option of either using the efRciency so calculated for all of the remaining com-ponents or repeating the procedure for all possible binary pairs. Such detailed estimates of com-ponent efRciencies are then used as inputs to ad-vanced process simulators such as ASPEN.
Issues Relating to Scale-up
of Ef
\
ciency Data
Since the point efRciency data and correlations (like eqn [10] are (or should be) based on local conditions, they should, in principle, remain valid on all scales. They are then integrated with Sow conditions to predict the overall tray efRciency. Correlations such as eqn [11], which provide this function of integrat-ing the point efRciency to provide tray efRciency, do not remain valid at all scales. It has been well documented that the liquid Sow patterns change quite dramatically depending on the diameter of the column and the location of the weirs near the down-comer. In future one can expectcomputationalUuid dynamicsto provide detailedSow information using models that remain scale invariant over a wide range of diameters.
Concluding Remarks
A series of correlations taken from the literature are presented. They permit the evaluation of the perfor-mance of a sieve tray, once a set of design parameters has been chosen as outlined in Part I. At the design stage of a new sieve tray column, one can embed this design and performance analysis steps into an optim-ization procedure, in such a way that the design parameters may be altered until a speciRed objective function is satisRed. The objective function could be
a cost function that includes the capital cost of the equipment (which determines the column diameter, tray spacing, etc.) and operating costs (which deter-mine the reSux and reboil rates and the number of ideal stages).
See also: II/Distillation: Historical Development; Instru-mentation and Control Systems; Theory of Distillation; Tray Columns: Design; Packed Columns: Design and Per-formance; Vapour-Liquid Equilibrium: Correlation and Pre-diction; Vapour-Liquid Equilibrium: Theory.
Further Reading
Chen GX and Chuang KT (1993)Prediction of Point EfT -ciency for Sieve Trays in Distillation. I&EC Research, vol. 32, p. 701.
Fair JR et al. (1997) In: Perry RH and Green D (eds.), Perry’s Chemical Engineers’ Handbook }Section 14, 7th edn. New York: McGraw-Hill.
Kageyama, O. Plate efRciency in distillation towers with weeping and entrainment, I. Chem. E. Symposium Series No. 32.
Kister HZ (1992) Distillation Design. New York: McGraw-Hill.
Lockett MJ (1986)Distillation Tray Fundamentals. Cam-bridge University Press.
Mehta B, Chuang KT and Nandakumar K (1998) Model for liquid phaseSow on sieve trays.Transactions of the Institute of Chemical Engineers, part A (in press). Rose LM (1985)Distillation Design in Practice.
Amster-dam: Elsevier.
Rousseau RW (1987) Handbook of Separation Process Technology, New York: John Wiley&Sons.
Solari RB and Bell RL (1986) Fluid Sow patterns and velocity distributions on commercial scale sieve trays. American Institute of Chemical Engineers Journal32: 640.
Zuiderweg FJ (1982) Sieve trays: A view of the state of the art.Chemical Engineering Science37: 1441.
Vapour
+
Liquid Equilibrium: Correlation and Prediction
B. C.-Y. Lu, University of Ottawa, Ottawa,
Ontario, Canada,
D.-Y. Peng, University of Saskatchewan,
Saskatoon, Saskatchewan, Canada
Copyright^ 2000 Academic Press
Introduction
Distillation is a process used to separate liquid mix-tures into two or more streams, each of which has a composition that is different from that of the