The Mechanism of Oxygen Reactions at Porous Oxide Electrodes
III. Water Oxidation Catalysis at RuO
2/NiO Mixed Oxide Electrodes
Ian J. Godwin,∗,zRichard L. Doyle, and Michael E. G. Lyons
School of Chemistry and AMBER, CRANN Research Institute, Trinity College Dublin, College Green, Dublin 2, Ireland
RuO2/NiO mixed oxide electrodes prepared by thermal decomposition were examined as potential water oxidation catalysts. Addition
of just 10 mol% RuO2to a NiO electrode was found to decrease the oxygen evolution reaction (OER) onset potential by 20% with
increasing additions having significantly diminishing returns. The OER current densities for the RuO2/NiO electrode were found to
increase when preconditioned by application of prolonged polarization regimes with the Tafel slope also decreasing when conditioned. NiO prepared by thermal decomposition was found to behave in a similar manner to other nickel oxides prepared using different methodologies and we propose a similar OER mechanism based on the kinetic data obtained using the surfaquo group concept. A dual barrier model was used to rationalize the fractional reaction order of ca. 0.5 observed for RuO2.
© 2014 The Electrochemical Society. [DOI:10.1149/2.0761409jes] All rights reserved.
Manuscript submitted March 3, 2014; revised manuscript received June 5, 2014. Published June 12, 2014.
Alkaline water electrolysis has become an area of intense inter-national research due to the need for a method to efficiently produce large amounts of molecular hydrogen which would be required for a potential hydrogen economy. Currently one of the main drawbacks limiting the widespread use of this technology is in the large anodic overpotential associated with the oxygen evolution reaction (OER). Dimensionally Stable Anodes (DSA) are one such technology which can effectively catalyze the OER thus increasing the overall efficiency of the water electrolysis reaction. DSA electrodes consist of an under-lying electrochemically inert valve metal substrate such as titanium or tantalum, coated usually with an oxide or mixed oxides of plat-inum group metals (PGM). To date, they have been employed in many industrial processes such as the chlorine evolution reaction,1
electrowinning of metal ores2and as an anode for use in industrial
water electrolyzers.3Herein, we focus attention on the latter use in an
alkaline environment. DSA electrodes based on IrO2/RuO2currently
exhibit one of the lowest overpotential for the oxygen evolution reac-tion (OER), which is said to be the ‘bottleneck’ or rate determining step in a water electrolyzer cell at standard operating currents. PGM oxide mixtures such as IrO2/RuO2as studied by Lyons,3,4Trasatti4–6
and others on Ti exhibit extremely low OER overpotentials (ca. 0.20– 0.25 V) and display long term stability in strong alkaline conditions required for an alkaline water electrolyzer setup. However, the main drawback in fully utilizing PGM oxide based DSA electrodes is in the high cost associated with these metals, and thus, significant in-ternational research is being currently focused on finding cheaper alternatives which still display relatively low overpotentials. This pa-per focuses on minimizing the amount of expensive PGM oxides, RuO2in this case which currently costs $2.1 million/ton, required by
combining them with low cost NiO, currently $14 000/ton, which dis-plays relatively low overpotentials for the OER7–9but at a significantly
lower cost. A range of RuO2/NiO compositions was studied herein
and the effect of varying the relative mole percent of each oxide on the redox properties, reaction order and OER kinetics and mechanism will be studied using the traditional electrochemical tools of cyclic voltammetry and steady state Tafel plots.
Experimental
All experiments were conducted in a conventional three electrode cell kept at 25◦C connected to a Gamry 600 model potentiostat. All metals and metal salts used were supplied by Alfa Aesar and are> 99.99% metals basis. A graphite rod was used as the counter electrode and Hg/HgO (CH instruments) was employed as the reference elec-trode. The iR drop was calculated using high frequency potentiostatic impedance spectroscopy and all electrochemical data reported has been corrected accordingly. All electrochemical measurements were
∗Electrochemical Society Student Member.
zE-mail:godwini@tcd.ie
carried out in 1 M NaOH unless otherwise indicated. The RuO2/NiO
mixed oxide films were made up by making separate 0.2 M solutions of RuCl3.xH2O and Ni(NO3).6H2O in butanol. These solutions were
then mixed in the desired ratios and the resulting solution was painted onto the exposed Ti wire electrode with a typical geometric area of 1 cm2. The electrodes were dried at 80◦C for 5 min to evaporate off
excess solvent and further annealed at 425◦C for 10 minutes to convert the metal salt to the metal oxide. This process was repeated several times until a sufficiently thick loading was obtained. The electrode was finally annealed at 425◦C for 3 hours to ensure complete con-version to the oxide. Scanning electron microscopy was carried out using a Carl Zeiss Ultra SEM with an accelerating electron voltage of 5 kV. Energy dispersive X-ray analysis was obtained using Oxford Instruments X-Max EDX detector. EDX confirmed the composition of the mixed oxide films and was carried out at 15 kV unless oth-erwise indicated. The mixing preparation method was found to be accurate to within 2 mol% of the predicted composition. Although the three hour annealing time chosen was sufficient to decompose the pre-cursor chloride salt some small residual chloride (ca. 1%) remained combined with negligible nitrate present. All references to the relative mole fractions will be described as additions of RuO2to a NiO
elec-trode i.e. a 25 mol% RuO2electrode describes a 75% NiO electrode
and so on. All mixed oxide compositions stated refer to the metal mole percentage. Powder X-ray diffraction (PXRD) was carried out using a Bruker Duo with a Cu kαsource (λ=1.54 Å) on all mole fractions to determine the oxide phase composition. In all cases the Tafel slope was calculated in the linear potential region immediately after OER onset. The voltammetric charge q or q* for use in the normalization of the Tafel plots and for calculation of the turnover frequency10was
calculated by integrating the area under the oxidation sweep of the relevant voltammogram at 40 mV/s in 1 M NaOH between hydrogen evolution and oxygen evolution.
Results and Discussion
Physical characterization.—PXRD confirmed that we have ruthe-nium oxide and nickel oxide in the form of RuO2and NiO respectively
which is in good agreement with others given the experimental condi-tions chosen.11,12As shown in Fig.1a-1dRuO
2and indeed all oxide
films containing RuO2prepared by thermal decomposition display the
characteristic mud-cracked appearance associated with RuO2 films
prepared previously by others.4The film interspacings and thickness
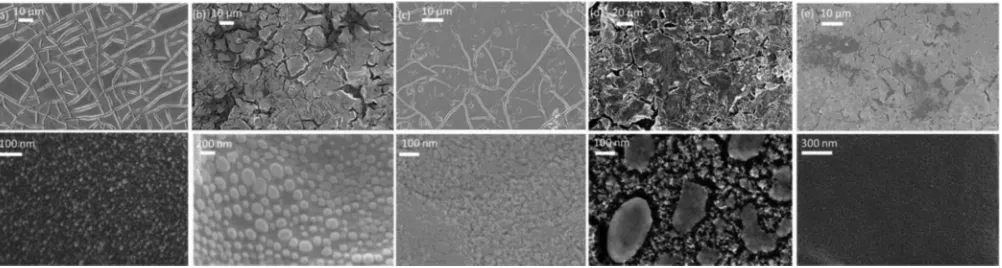
Figure 1. SEM image of the as prepared (a) RuO2film prepared by thermal decomposition (b) 10% Ni 90% Ru (c) 50% Ni 50% Ru (d) 90% Ni 10% Ru (e) NiO.
The corresponding images underneath are simply higher resolution images of the above.
knowledge this is the first time such nanoparticles have been observed on RuO2and NiO films synthesized in this fashion. We do not believe
however that our discrete oxide films are in fact any different to those reported earlier by people such as Trasatti5and Srinivasan.13It is most
probable that this observation is just due to higher resolution imag-ing beimag-ing performed in the present work. The size of these surface nanoparticles for the discrete oxides were found to be on the order of 10 nm in diameter and are uniformly coated on the oxide surface. Assuming a cubic shape, this would give a surface area of 500 nm2for
the individual nanoparticles which compares to an area of 0.34 nm3
calculated for a surface active (surfaquo) group by Lyons and Burke in part I of this series.3 Therefore one would expect that there are
>1000 of these surfaquo groups on each nanoparticle site. We hence propose that these catalytically active surface nanoparticles, in part at least, account for the excellent OER activity displayed by both oxides owing to their large available surface area.
Indeed as stated previously, all mixed oxides as shown in Fig.1
were shown to display varying morphology on the nanoscale indi-cating a strong dependence on the relative mole% of each oxide in the mixture. However, we could see no trend in size/shape of these nanoparticles with varying the relative mole fraction but it does in-dicate the strong dependence on the oxide mixture on the nanoscale morphology of each oxide. Oxide mixtures containing≤50% Ru were found to have multifaceted microparticles, typically with a diameter of several microns, evenly dispersed across the surface. EDX analy-sis confirms that these particles are solely composed of RuO2. This
observation leads us to believe that the mixed oxide electrodes in this composition range undergo surface enrichment by RuO2 and hence
surface properties are, to a large extent, dominated by RuO2and not
NiO. This assumption will be further supported later in the next section using electrochemical techniques. EDX analysis indicates that Ni:Ru is approximately present in the bulk in a ratio of 3:1 This surface enrichment by RuO2has been suggested for Co-Ru mixed oxide
elec-trodes made by Da Silva and co-workers14and Trasatti and Krstajic,15
based only on electrochemical data. This experimental observation of surface enrichment is also in accordance with DFT studies carried out by Novell-Leruth and co-workers16who suggest that due to the low
surface energy associated with RuO2, it would preferentially be found
on the surface in many mixed oxide systems.
Electrochemical characterization.—The effect of varying the rel-ative mole fraction of RuO2in the mixed oxide system on the
voltam-metric response can be seen in Fig. 2. The two prominent redox couples that are observed in the oxides studied are Ni(II/III), Fig.2a, and Ru(VI/VII), Fig.2f, redox couples which occur at 0.51 V and 0.45 V for the oxidation peaks and 0.40 V and 0.44 V for the reduc-tion peaks respectively. The redox behavior of surface immobilized oxyruthenium groups is assumed to involve the simultaneous loss or gain of protons and electrons and be represented by the following
equations:4
Ru(III/IV) (−O−)2RuOH(OH2)3+OH−
→(−O−)2Ru(OH)2(OH2)2+H2O+e− [1]
Ru(IV/VI) : (−O−)2Ru(OH)2(OH2)2+2OH−
→(−O−)2Ru(OH)4+2H2O+2e− [2]
Ru(VI/VII) : (−O−)2Ru(OH)4+OH−
→(−O−)2RuO(OH)3+H2O+e− [3]
In aqueous alkaline environment NiO will undergo the following reaction:
NiO+H2O→Ni(OH)2 [4]
For the NiO (and analogously for RuO2) film prepared by thermal
decomposition, we assume that it consists of a thick compact oxide layer with a thinner hydrated outer layer which is formed when sub-jected to potential multicycling in basic media. This hydrated form of nickel oxide is envisaged as an amorphous microdispersed layer where nickel atoms are joined by bridging oxygens. This ‘duplex layer’ model was first proposed by Burke and O’Sullivan17 for
hy-drous rhodium oxide electrodes prepared from potential multicycling a polycrystalline rhodium electrode in aqueous media. We attempt to liken our thermal nickel oxide electrodes to the hydrous nickel oxide electrodes we have prepared previously.9One can justify this
assump-tion from the observed hydraassump-tion effect, discussed in the next secassump-tion, observed for the thermal NiO electrode upon potential multicycling which is akin to the observed effect seen for a hydrous nickel elec-trode when subjected to the same cycling. Another common factor between the two types of nickel electrodes, is that the Ni(II/III) tran-sition for both, is suggested to be the same, and can be described by the simplified equation:9
Ni(OH)2+OH−→NiOOH+H2O+e− [5]
If we assume that both types of nickel oxide have a similar hydrated outer layer, both electrodes are proposed to consist of the same cat-alytic NiOOH before oxygen evolution though further spectroscopic studies are required to validate this. NiOOH is said to be ‘the right type of oxide’18for the OER and its catalytic properties partly come
from its excellent electrical conductivity as compared with Ni(OH)2.19
Figure 2. Typical voltammetric response of (a)100 mol% NiO (b) 10 (c) 25 (d) 50 (e) 90 (f) 100 mol% RuO2on a Ti substrate. Electrolyte is 1 M NaOH. Scan
rate: 40 mV s−1. Potentials quoted against Hg/HgO.
potentials can be attributed to the underlying bulk conductivity being lower for the thermal NiO compared with that of the polycrystalline nickel oxide electrode, the latter film would be expected to be thin. This lower conductivity would account for the observed increase in redox potentials and oxygen evolution onset potential for the thermal NiO electrode. We can support this statement by looking at Fig.3
which shows the high frequency impedance response for a hydrous nickel oxide electrode and the NiO electrode prepared herein. At high frequencies we can expect to only see impedance contributions from the solution resistance and the intrinsic oxide film resistance. Since we are using a fixed cell geometry and electrolyte for each oxide film we can assume the solution resistance is constant and therefore the apparent film resistance (using this this preparation procedure) for both oxides is approximately the same. Even at very high frequencies >100 000 Hz the resistance is ca. 25% lower for the hydrous nickel oxide film. Thus we propose this increase in film resistance to account for the broader and more positive peak potentials observed for NiO over the hydrous nickel oxide films we have prepared previously.
Figure 3. Comparison of the high frequency potentiostatic electrochemical impedance response of oxide films.
Now, utilizing the previous assumption of the similarities be-tween the two nickel oxides, the main charge storage peak for NiO i.e. the Ni (II/III) redox couple, can be more accurately described by the following equation which has been rationalized previously for the hydrous nickel oxide electrode:20
[Ni2(OH)6(OH2)3]n2−+3nOH−→[Ni2O3(OH)3(OH2)3]n3−
+3nH2O+2ne− [6]
Relatively small additions of RuO2 to NiO film changed the
ob-served voltammetric response significantly. With addition of just 10 mol% RuO2, as given in Fig.2b, the oxidation peak at ca. 0.5
V is noticeably sharper than that of the pure NiO film with the peak potential remaining relatively invariant. The same can be seen for the corresponding reduction peak at 0.4 V but in this case, it experiences a negative peak potential shift of ca. 0.035 V indicating that the oxi-dized Ni(III) state becomes more stable with increasing additions of RuO2. The electrochemical reversibility of the system was also found
to significantly increase with increasing additions of RuO2. Delta Ep
for the main redox peaks was found to vary from ca. 100 mV for NiO to ca. 20 mV for an RuO2electrode.
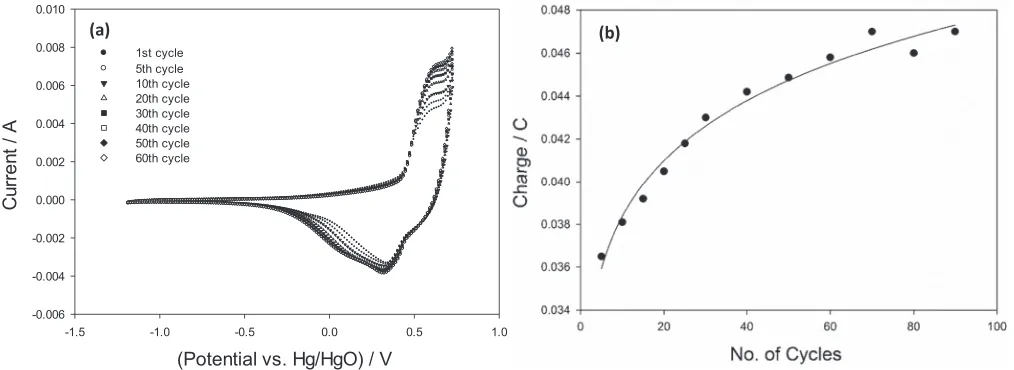
Potential Multicycling and Activation of Mixed Oxide films for the OER.—As discussed previously, the charge capacity associated with the Ni(II/III) surface redox transition increases significantly upon suc-cessive potential multicycling (Fig.4a). Similar effects have been re-ported by this group and others when oxidized Ni,21Fe,22Co,23Rh24
and Ir25are subjected to repetitive potential multicycling regimes in
basic aqueous media. This effect has been shown to be due to the disruption of the bulk parent metal atoms upon oxidation with coor-dination of aqueous species upon subsequent reduction thus forming an amorphous hydrated layer on top of the more compact surface oxide with the film getting thicker with each subsequent cycle at the expense of the parent bulk material. A significantly more compre-hensive description of this growth mechanism is given in a review by Lyons and Burke.26We propose a similar growth mechanism to
[image:3.585.37.279.552.725.2]Figure 4. Cyclic voltammogram of a potential multicycled NiO electrode between−1.2 V and 0.75 V for 60 cycles. (b) Voltammetric charge a NiO electrode vs. number of potential multicycles. Potentials quoted against Hg/HgO.
most significantly upon cycling. The reduction peak at ca. 0.33 V therefore can be attributed to the reduction of the inner compact bulk oxide. The hydrous layer is therefore more stable than the inner com-pact layer due to the need of a greater reduction potential to reduce it back to the Ni(II) form. Outer hydrous oxides have been suggested to be more stable than the inner compact oxide by Lyons and Burke.26
One oxidation peak with two corresponding reduction peaks is also observed for the hydrous nickel oxide electrode which draws more similarities between both oxide electrodes. As shown in Fig.4b, the charge of the oxidation peak increases and levels off after ca. 60 cycles indicating little or no further hydration of the NiO film occur-ring on subsequent cycling. Indeed, all oxide compositions studied containing nickel were found to experience some degree of hydration. Fig.5ashows the voltammetric response of a 50 mol% RuO2electrode
subjected to 120 potential cycles. We again see a similar increase with charge, however, the charge was found to equilibrate after ca. 30 cy-cles despite the peak current increasing and the narrowing of the main oxidation charge storage peak at ca. 0.5 V upon successive cycling. This could indicate that though there is no increase in the amount of reaction sites, indicated by no further increase in charge, the reaction sites however are becoming more uniform in nature which is suggested by the sharpening and narrowing of the oxidation peak. This increase in charge upon potential multicycling was not seen for a pure RuO2
electrode possibly due to the Ru-O bond strength being too great to break, which is necessary for such hydration to occur in the potential region examined. The Ru-O bond has strength of 528 kJ mol−1while
the Ni-O bond strength was shown to be 384 kJ mol−1.27
Another observed feature for NiO and RuO2 and all oxide
com-positions in-between was the activation of the film when subjected to polarization regimes in the OER potential region. The activation of the electrodes was experienced in two ways. First, the main redox couple
be it Ru(VI/VII) or Ni(II/III) was found to increase in charge upon vigorous polarization. Secondly the measured Tafel slope, which indi-cates the relative increase in OER current density per increase in unit potential, was found to decrease until a minimum was reached which indicates an increase in catalytic activity after the electrode had been preconditioned by applying a large prolonged (300 mA cm−2) current
density. For an RuO2electrode, running three successive Tafel scans
followed by application of a current density of 300 mA cm−2 for
30 minutes, as shown in Fig. 5b, the current density was found to increase by a factor of four at a fixed overpotential of 0.4 V with the Tafel slope in this case remaining relatively invariant with a value of 47–50 mV dec−1. This increase in current density with
an invariant Tafel slope upon polarization indicates a reduction in overpotential for the OER at a fixed current density suggesting the ‘activated’ mixed oxide is more effectively lowering the barrier for the OER. This could possibly be due to a surface roughening ef-fect which would increase the accessible active surface area. NiO in comparison, experiences markedly less of an increase in current density upon polarization but however, unlike RuO2, it does show
a decrease in Tafel slope which has a value of ca. 78 mV dec−1
for a freshly prepared electrode and decreases to ca. 63 mV dec−1
when subjected to several Tafel scans indicating an increase in cat-alytic activity of the material due to conditioning and most likely arises from the formation of the catalytic, more conductive, NiOOH upon polarization as suggested previously. The Tafel slope value of 60 mV dec−1for thermally prepared NiO is in good agreement with
values obtained by Juodkazis and co-workers for nickel oxide prepared using a similar methodology.28Indeed a Tafel slope of 60 mV dec−1
has been obtained for hydrous nickel oxides which further supports the linkage between our thermal NiO and such oxides.21Trotochaud
[image:4.585.38.361.632.751.2]and co-workers29have shown when nanometre thick NiO films are
Figure 5. (a) Voltammetric response of a 50 mol% Ru electrode cycled between−1.2 V and 0.7 V for 120 cycles. Scan rate: 40 mV s−1. Potentials quoted against Hg/HgO. (b) Steady state polarization curves for RuO2. Electrolyte
Figure 6. Tafel plot comparison for a 25 mol% Ni 75 mol% Ru electrode before and after polarizing at 300 mA cm−2for 10 hours. Electrolyte is 1 M
NaOH. Scan rate: 1 mV s−1.
polarized in basic media, the formation of Ni(OH)2/NiOOH occurs
from the as deposited crystalline NiO. This gives further support to our earlier assumption which likens our thermal NiO to the multicy-cled hydrous nickel oxide discussed previously, as this also involves the same Ni(OH)2/NiOOH redox couple. The mixed oxide electrodes
display a different behavior upon multicycling/polarization in con-trast to either RuO2 or NiO. Taking a 25 mol% RuO2 electrode for
example, outlined in Fig.6, the measured Tafel slope and OER current densities were found to be invariant upon successive steady state po-larization measurements, in contrast to the response observed for the two individual oxides. Both discrete oxides were found to vary either in Tafel slope or current density when subjected to these successive potential sweeps. This would lead one to believe that any simple linear superposition response of the two oxides is not occurring here. More interestingly, upon subjecting this film to a fixed current density of 300 mA cm−2for 10 hours, the Tafel slope was found to decrease from
ca. 75 mV dec−1to ca. 50 mV dec−1, and the OER current density was
found to increase by a factor of three over that of the ‘fresh’ electrode at a fixed overpotential of 0.4 V as shown in Fig.6. It is clear therefore that we are seeing ‘the best of both worlds’ type behavior when using this oxide mixture. We observe the lowering of the Tafel slope upon polarization, indicative of NiO, and concurrently note an increase in the OER current density which indicative of RuO2, when subjected to
a prolonged large current density. This enhancement in performance is in direct contrast to what is observed for a 75 mol% RuO2electrode
where negligible change in Tafel slope or current density was observed when the same polarization regime was applied. From examining the SEM images in Fig.7we can see the effect of such polarization has on the 25 mol% RuO2 electrode. It is clear that upon polarization
the presence of an increased amount of RuO2surface microparticles
occurs which would account for the increase in catalytic activity for
the OER. This could be due to preferential dissolution of NiO over RuO2but our lifetime study tests shown later does not support this
proposal as NiO is found to be extremely stable under such intensive polarization regimes. There is clearly another process occurring here, possibly a migration of RuO2to the surface. This is currently under
investigation and will be reported in a future publication.
To truly measure how active a catalyst is for the OER many pa-pers often quote key performance indicators (KPI’s), such as the OER onset potential, overpotential at a fixed current density, turnover fre-quency (TOF), and, often omitted; the stability of the catalyst. The OER onset potential is an indicator of how effective the catalyst is at lowering the activation barrier for oxygen evolution. As seen in Fig.8a, NiO begins to evolve oxygen at overpotential of ca. 0.38 V, in good agreement28with values of nickel oxides prepared in the
lit-erature using this thermal decomposition method. Significantly, the addition of just 10 mol% RuO2to a NiO electrode causes a reduction
in OER onset potential of 20%, while the addition of 25 mol% RuO2
led to a 33% drop in the OER onset potential. We suggest that this significant observed drop in OER onset overpotential is due to surface enrichment by RuO2upon oxide mixing, and is excellent agreement
with the observed SEM data shown in Fig.1. With increasing additions however there were diminishing returns in the reduction of the OER onset potential with additions over 25 mol% of RuO2having relatively
little effect. Juodkazis and co-workers28have shown previously for an
equimolar mixture of RuO2and NiO there was some observed
syn-ergistic effects for the OER in alkaline conditions, however only one mole fraction was studied. In addition the authors used a nickel rather than a titanium substrate, which could affect the measured catalytic behavior due to underlying nickel substrate being an effective OER catalyst itself.
A similar trend is also observed when one examines the overpoten-tial at a fixed current density. To obtain a current density one obviously must know the real surface area of the film in question rather than just the geometrical area. Historically there has been controversy in de-termining the real or electrochemically active surface area of porous oxide electrodes. While there has been theoretical work done on cal-culating the surface area of compact flat oxides by deriving a surface area conversion factor using the capacitance, there is still debate over calculating the real surface area of porous electrodes such as the ones examined here. Due to this, we have opted to normalize our current us-ing the voltammetric charge which has been suggested by Trasatti30,31
[image:5.585.36.372.639.753.2]to accurately represent the amount of electrochemically active surface available for the OER. One obtains the voltammetric charge, often denoted by q*, by integrating the area under the oxidation or reduc-tion sweep of the voltammogram, here we used the oxidareduc-tion sweep of the cyclic voltammograms shown in Fig.2, and normalizing for the scan rate. Here, one must assume that all of the electrode surface available for oxidation or reduction is also available for the OER and it has been shown for relative thin films such as the ones used here, that q* is indeed proportional to the measured BET surface area. We do however recognize that the BET surface area will not be exactly the same as the electrochemically active surface area in solution since BET measurements usually utilize an inert gas while in solution we are concerned with hydroxide ion interaction with the surface. Shown in Fig.8b, there is a marked drop in overpotential for both the high
Figure 8. Oxygen evolution reaction onset overpotential as a function of oxide composition. (b) Observed overpotential for oxygen evolution at two fixed currents normalized by voltammetric charge. Electrolyte: 1 M NaOH.
and low current densities chosen, with reductions of 29% and 17% re-spectively with the addition of 10 mol% RuO2. The same diminishing
returns effect can also be seen here with increasing the relative mol% of RuO2.
Another useful measure of how catalytic material is in quantifying the TOF. The TOF is often used in heterogeneous catalysis to measure how catalytic a given material is for the reaction in question. The electrochemical TOF can be calculated using a method used by Bell and Yeo10and is given by the following expression
T O F= J
4Q [7]
where J is the current density and Q is the charge density. Q is cal-culated as per q* mentioned previously. One can easily rationalize this expression by considering the current density as a rate and, as explained previously, relating the charge density to the amount of electrochemically active material in the oxide film so ones ends up with a rate per unit material which is the classical definition of TOF. The factor of four arises from the OER being a four electron transfer process. Fig.9ashows the increasing exponential like behavior of the OER TOF at a fixed overpotential of 0.2 V with successive increases of RuO2. This potential was chosen so that all TOFs for all the mixed
oxides lie in the same Tafel region which gives one a like for like com-parison. With additions up to 75 mol% RuO2, there is little increase in
TOF, suggesting that there is no favorable interaction between the two oxides in contrast to what was observed for the OER onset potential as shown earlier with Fig. 9asuggesting that NiO is hindering the intrinsic activity of RuO2, which explains the large increase in TOF
observed for the pure RuO2electrode over that of a 75 mol% RuO2
film.
Fig.9bshows accelerated corrosion tests carried out on a sample of mixed oxide compositions. These corrosion tests consisted of po-larizing the electrode at 300 mA cm−2for 10 hours in 1 M NaOH. We
note that for both RuO2and NiO there is very little increase in
poten-tial under prolonged polarization. RuO2experiences a slight increase
initially in potential, most likely due to the spalling of oxide material which is loosely bound to bulk oxide film. NiO on the other hand experiences a drop in potential over the first 5000 s of polarisarion indicating an increase in catalytic activity. This is possibly due to the creation of anodically formed catalytic NiOOH from the as deposited NiO. Trotochaud and co-workers have shown such growth when thin NiO films were subjected to current densities as low as 10 mA cm−2
for six hours.29We see that for both oxide mixtures shown here that
there is a slight increase in the cell potential when subjected to the
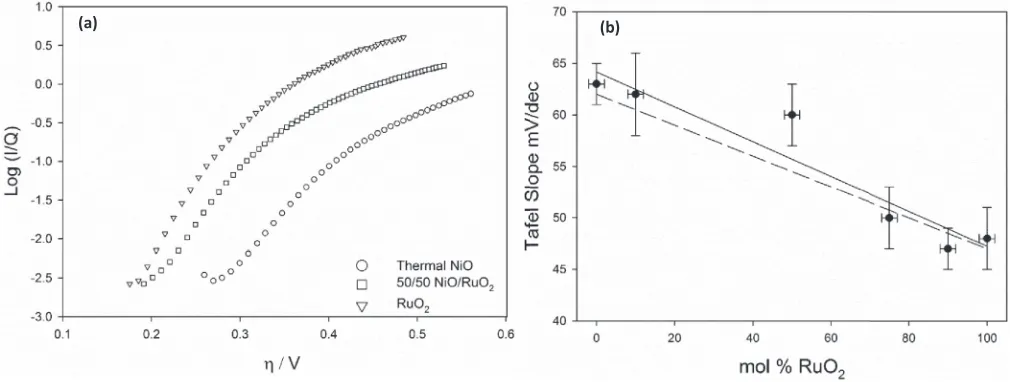
[image:6.585.41.549.540.726.2]Figure 10. (a) Tafel slope as a function of mol% RuO2for a mixed NiO/RuO2system. Predicted line (dashed) if the Tafel slope was a simple linear superposition
of the two discrete oxides (b) Sample Tafel plots of mixed oxide compositions studied.
corrosion regime. The electrode containing a majority of NiO, al-though displaying a larger overpotential, is markedly more stable under prolonged polarization with little or no increase in potential observed>20 000 s while the predominantly RuO2electrode
experi-ences, albeit a slower increase after>10 000 s, increase in overpoten-tial for the duration of the lifetime test.
Kinetic analysis of the OER.—To elucidate a possible reaction mechanism for the OER it is pertinent to examine the relevant kinet-ics involved. Two experimental kinetic parameters often examined in analysis of the OER are the Tafel slope,b, and reaction ordermO H−,
with respect to hydroxide ion which is given by the following expres-sion:
mO H−=
∂logI ∂logaO H−
[8] where I is the current and aOH−is the activity of the hydroxide ion.
Experimentally we calculate mOH−by plotting several Tafel scans in
differing base concentrations, typically in the range of 0.5–5 M and measuring the current at a fixed overpotential in each concentration. We equate the current with the rate of reaction and thus the classical rate equation holds. Herein a Hg/HgO reference electrode is used. If the composition of the reference electrode is kept constant (say 1.0 M
NaOH) and the base concentration of the working electrode compart-ment varied during reaction order measurecompart-ments, then the reaction order measured ismO H−,E where E is the potential. In contrast, if the
solution in the reference electrode compartment is the same as that under investigation, the pertinent reaction order ismO H−,η. Therefore
we measured the reaction order at constant potential which gives the kinetically and chemically significant reaction order. The relationship between the two can be given bymO H−,η = mO H−,E - βwhereβ
is the symmetry factor. The Tafel slope can give mechanistic insight into the relevant rate determining step (RDS) in a multistep electron transfer process and is intrinsically also a measure of catalytic activity. Fig.10ashows Tafel plots in 1 M NaOH for a sample of the oxide compositions studied. The Tafel slope was found to vary in a near lin-ear fashion from ca. 63 mV/dec for a NiO electrode to ca. 48 mV/dec for a RuO2electrode as can be depicted in Fig.10b. Our experimental
value of 62±2 mV for the Tafel slope and reaction order of 0.86± 0.06 (Fig.11a) obtained for NiO agrees excellently with the kinetic parameters obtained for hydrous nickel oxides/hydroxides prepared by potential multicycling and electroprecipitation.21,33Interestingly,
we observe a fractional reaction order (Fig.11b) of approx. 0.5 for RuO2and all other mixed oxide materials studied. The observed value
[image:7.585.40.545.550.735.2]of a fractional reaction order differs from that previously reported by Lyons and Floquet4and others32observed a reaction order of unity
containing RuO2. The proposed catalytic cycle for the OER is shown
below. Step A.I is considered a pre-equilibrium step. The complete reaction can therefore be written schematically as follows:
S O H2+O H−S O H−+H2O (A.I)
S O H−→S O H+e− (A.II)
S O H+O H−→S O−+H2O (A.III)
S O−→S O+e− (A.IV)
S O+O H−→S O O H+e− (A.V)
S O O H+O H−→S O2+H2O+e− (A.VI)
S O2+O H−→S O H−+O2 (A.VII)
where S represents a surfaquo group attached to the bulk oxide. The surfaquo group concept proposed envisages hydrated interlinked oxy-metal surface active groups, hence the term surfaquo group, which facilitate the OER at the surface. Again, we are likening the OER behavior of NiO prepared by this thermal decomposition method to other nickel oxides/hydroxides formed by potential multicycling in base, electroprecipitation.33The nickel cations at the surface tend to
undergo some degree of hydration i.e. become coordinated to sur-rounding water molecules, in the basic environment. The coordinated water molecules are therefore the source of the discharged hydroxide ion in step I. This hydration of thermally prepared NiO is therefore not unreasonable to expect in the strongly alkaline environment used. It is likely that a significant proportion of these coordinated water molecules will be deprotonated due to the pKa value for a water molecule coordinated to a highly charged metal atom being generally in the range between 5–9. On this basis we make the assumption in our reaction scheme that step (I) is facile. The surfaquo group concept attempts to bridge the link between these heterogeneous electrocata-lysts and homogeneous molecular cataelectrocata-lysts for water oxidation which is an area of current intense study by groups such as Llobet and co-workers.34,35The OER catalytic cycle can be seen pictorially in
Fig.12awhich shows the octahedrally coordinated surfaquo group attached to the bulk NiO.
We can now conduct a kinetic analysis of the mechanism shown in the scheme above. We envisage the rate determining step for NiO being the formation of the metal oxide SO−(step II) and the metal-oxo SO (step IV) species due to the high energy associated with the formation of these species. Our rationale is supported by DFT studies carried out by Muckerman and co-workers36who showed, that for
a GaN/ZnO surface with high coverage of adsorbed OH− ions the intermediate associated with the highest energy was an oxide radi-cal. Therein, Muckerman and co-workers consider the influence of the solution hydrogen bonding network on the energy of the inter-mediates and suggest that a metal oxide in contact with solution is energetically more favorable to be ionized rather than be neutral and hence the acid/base behavior of the surfaquo group will be integral to any consideration of the OER. Similarly, Rossmeisl and co-workers37
performed a DFT study of the OER at RuO2surfaces. They too found,
for a surface saturated with adsorbed OH, that the highest energy in-termediate was a surface oxygen species, in this case an oxo species.
S O H∼=
k1S O H−
k−1+k2aO H−
[10] Hence, the net reaction flux is given by:
f= k2k
1S O H−aO H−
k−1+k2aO H−
[11] However sincek1andk−1are electrochemical rate constants they
are therefore potential dependent in contrast to chemical rate con-stants. We can take this potential dependence into account by utilizing the Butler-Volmer rate equation given by:
kn =k0
nexp[βFη/RT] and k−n=k 0
−nexp[−(1−β)Fη/RT] [12]
whereηdenotes the overpotential,βis the symmetry factor andk0 n
is the standard chemical rate constant. Hence the net flux, taking into account the potential dependence ofk1 andk2, can be written as:
f= k
0
2aO H−S O H−k01exp[βFη/RT]
k0
−1exp[−(1−β)Fη/RT]+k2aO H−
[13] Now, if step (II) is rate determining then we can say with assurance thatk0
2 k
0
−1and therefore eqn13simplifies to give:
f=k0
2S O H−aO H−
k0 1
k0 −1
exp[βFη/RT] [14] This expression therefore predicts a reaction order of 1 with re-spect to OH− activity and a Tafel slope of ca. 60 mV dec−1 at
298 K assuming β = 1
2 which is reasonable since this value
as-sumes that any intermediate species generated have an energy profile halfway between the starting species and the product. The theory thus agrees well with our experimental results for NiO. The kinetic data ob-tained for an RuO2electrode can also be incorporated into a proposed
mechanism for the OER. The following mechanism was previously proposed by Lyons and Floquet11and has been adapted for use here
and, similarly to scheme A, starts with the initial discharge of a hy-droxide ion. A more in depth analysis of the mechanism can be found in an extensive review of the OER at metal oxides published recently by our group.17 This hydroxide discharge is then thought to be
fol-lowed by a structural rearrangement to a more energetically favorable arrangement to accommodate the extra hydroxide ion. Subsequent to this rearrangement, a second electron discharge occurs forming an un-stable Ru (VIII) species which acts as a precursor to the generation of oxygen. The relevant OER mechanistic steps, which incorporate the surfaquo group concept for RuO2are given by the following scheme:
(−O−)2Ru O−(O H)3+O H−↔(−O−)2Ru.O−(O H)2+H2O+e−
(B.I) (−O−)2Ru O.O−(O H)2→(−O−)2Ru O2(O H)2+e− (B.II)
(−O−)2Ru O2(O H)2+2O H−→(−O−)2Ru O2+2H2O+O2+2e−
(B.III)
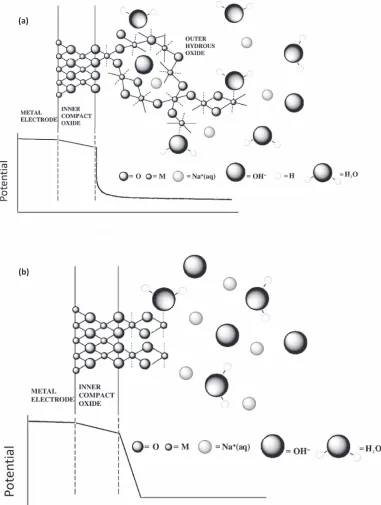
Figure 12. Pictorial representation of the oxygen evolution reaction for (a) NiO (b) RuO2in base involving catalytically active surfaquo groups bound to the outer
hydrous layer by bridging oxygens. This model assumes complete surface coverage. RDS: Rate determining step, b: Tafel slope, mOH−: Reaction order.
Scheme B is represented pictorially in Fig.12b, and Lyons and Floquet arrive at a theoretical expression for the total flux given by:
f= k
0
1k20SaO H−exp[βη]
k0
−1aH2Oexp[−η]+k20
[15]
and at low overpotentials assuming k0
2k
0
−1eqn15reduces to:
f=K0a−1
H2OsaO H−exp [(1+β)η] [16]
which predicts a reaction order of unity and a Tafel slope of 40 mV dec−1. Interestingly, and in contrast to Lyons and Floquet, we have
face like the one proposed by Burke and O’Sullivan which is discussed more detail in a previous review of such oxides.17They suggest the
significant potential drop in such oxides is across this interface with
potential drop across the latter may be proposed. If the hydrated layer is thick, then the potential drop extends further into the hydrous layer as illustrated in Fig.13.17While RuO
[image:10.585.102.483.225.730.2]2and NiO may have different
bulk conductivities, what we are concerned with here is the potential drop at the bulk compact oxide/thin outer hydrated oxide interface rather than the potential drop through the bulk oxide. We propose that both oxides contain such a thin hydrated outer oxide layer which is catalytically active. We can justify the use of the DBM here for both oxides by looking at their high frequency impedance response. At high frequencies one expects only to see combined solution and film resis-tance. As shown in Fig.3earlier, we can see that the high frequency impedance response is very similar for RuO2and NiO. Since we are
using a fixed cell geometry and electrolyte for each oxide film we can assume the solution resistance is constant and therefore the apparent film resistance (using this this preparation procedure) for both oxides is approximately the same. Thus we propose the applicability of the DBM is equally valid for both RuO2and NiO. The similarity in high
frequency impedance response gives further creed to our assumption that the biggest barrier to electron transfer is at the compact/hydrous oxide interface since RuO2has a larger bulk conductivity over NiO
but yet give a similar response due to similar hydrous/compact oxide interfaces being present in both. However as we have obtained a reac-tion order value of close to unity for NiO this barrier is evidently less marked for NiO than RuO2and we are currently unaware why this is
the case.
Under a normal kinetic analysis of step B.II, the overall rate equa-tion takes the general form:8
i=ioexp
(1+βs) Fη
RT
[17] whereiois the exchange current density for the OER andβsdenotes
the symmetry factor for the interfacial electron transfer process. If the OER is proceeding in the steady state under dual barrier conditions, the RDS must be in equilibrium with the barrier film charge migration process. Therefore it is possible to obtain an expression for the overall current density across the two barriers by equating eqn.17with the rate equation for the oxide charge migration. It can be shown that the resulting expression has the form:38,39
i=AaO H−me f fexp
(1+β)Fη RT
[18] wheremeff is the effective reaction order andβ is the composite
symmetry factor given by:
β= ββFβS
F+βS
[19] whereβF is the symmetry factor for field assisted charge transport
through the oxide andβSrepresents the symmetry factor for the rate
determining interfacial electron transfer reaction, and A denotes the pre-factor. Note that the effective reaction order with respect to hy-droxide ion activity is:
me f f =
∂logi ∂logaO H−
= mO H−βF
βF +βS
[20] wheremO H− is the expected value of the reaction order, a value of
unity for RuO2, under more usual single interfacial electron transfer
barrier conditions. Thus, if both potential barriers are assumed to be symmetricalβF=βS=12, and thus∂loga∂logi
O H− will give a reaction order
value of 0.5 which agrees excellently with the value 0.48±3 obtained. As stated before, all oxide compositions containing RuO2studied
gave a reaction order of ca. 0.5 indicating that RuO2dominates the
behavior in this regard. One suggestion to account for this observation could be due to the surface enrichment by RuO2on the mixed oxide
system. Thus if RuO2experiences this large potential drop across the
compact oxide/thin hydrous oxide interface as described by the DBM then it is possible that due to surface enrichment in the mixed oxide system that this potential drop is also present for all oxide mixtures containing RuO2. However further work is needed to verify this. As
the PXRD data suggests that the mixed oxide system contains two discrete phases rather than forming a new phase, we envisage that the OER mechanism of the mixed oxides will simply be a combination
of the two discrete mechanisms rather than a new mechanism being involved. Indeed the linear superposition type behavior of the Tafel slopes supports this theory.
Conclusions
In conclusion, we have developed a simple preparation method for RuO2/NiO mixed oxide catalysts prepared by thermal decomposition.
RuO2and NiO were both shown to activate when subjected to repeated
polarization regimes with a decrease in Tafel slope and increase in OER current density respectively. Addition of just 10 mol% RuO2
to a NiO electrode was found to decrease the OER onset potential by 20% with increasing additions having significantly diminishing returns. The OER current densities for the 25/75 mol% RuO2/NiO
electrode was found to significantly increase when preconditioned to prolonged polarization regimes with the Tafel slope also decreasing from ca. 75 mV dec−1 to ca. 50 mV dec−1. NiO prepared in this
manner was found to be electrochemically similar to other nickel oxides prepared using different methodologies and we have proposed a similar OER mechanism based on the kinetic data obtained using the surfaquo group concept. A near unity value for the reaction order was seen for NiO which is in accordance with values obtained for nickel oxides/hydroxides prepared using different methodologies. A dual barrier model was used to rationalize the fractional reaction order of ca. 0.5 obtained for RuO2. Due to the surface enrichment of RuO2
exhibited by the RuO2/NiO mixed oxide films over a large range of
compositions, it is therefore not unexpected that a fractional reaction order was observed.
Acknowledgments
This publication has emanated from research conducted with the financial support of Science Foundation Ireland under grant number SFI/10/IN.1/I2969 and SFI/12/RC/2278.
References
1. S. Trasatti,Electrochimica Acta,45, 2377 (2000).
2. Z. S. Msindo, V. Sibanda, and J. H. Potgieter,J. Appl. Electrochem.,40, 691 (2010). 3. M. E. G. Lyons and L. D. Burke,J. Chem. Soc., Farad. Trans. 1: Physical Chemistry
in Condensed Phases,83, 299 (1987).
4. S. Floquet and M. E. G Lyons,Phys. Chem. Chem. Phys.,13, 5314 (2011). 5. F. Tantardini, S. Trasatti, and D. Galizzioli,J. App. Electrochem.,4, 47 (1974). 6. F. Tantardini, D. Gallizioli, and S. Trasatti,J. App. Electrochem.,5, 203 (1975). 7. E. Sivieri, G. Lodi, A. De Battisti, and S. Trasatti,J. App. Electrochem.,8, 135 (1978). 8. M. E. G. Lyons and M. P. Brandon,J. Electroanal. Chem.,641, 119 (2010). 9. L. Russell, M. E. G. Lyons, M. O’Brien, R. L. Doyle, I. Godwin, and M. P Brandon,
Int. J. Electrochem. Sci.,7, 2710 (2012).
10. B. S. Yeo and A. T. Bell,J. Phys. Chem. C,116, 8394 (2012). 11. W. M. Keely and H. W. Maynor,J. Chem. Eng. Data,8, 297 (1963).
12. M. A. A. Elmasry, A. Gaber, and E. M. H. Khater,J. Therm. Anal. Calorim.,52, 489 (1998).
13. G. Singh, M. H Miles, and S. Srinivasan, Electrocatalysis on Non-Metallic Surfaces, Proceedings of Workshop held at NBS, Gaithersburg, Dec 9-12, 1975.
14. L. M. Da Silva, J. F. C. Boodts, and L. A. DeFaria,Electrochim. Acta,45, 2719 (2000).
15. N. Krstajic and S. Trasatti,J. Appl. Electrochem.,28, 1291 (1998).
16. G. Novell-Leruth, G. Carchini, and N. Lopez,J. Chem. Phys.,138, 194706 (2013). 17. L. D. Burke and E. J. M. O’Sullivan,l. Electroanal. Chem.,117, 155 (1981). 18. J. McBreen, inHandbook of Battery Materials, . J. O. Besenhard, Wiley-VCH,
Weinheim, 2007.
19. P. W. T. Lu and S. Srinivasan,J. Electrochem. Soc.,125, 1416 (1978).
20. R. L. Doyle, I. J. Godwin, M. P. Brandon, and M. E. G. Lyons,Phys. Chem. Chem. Phys.,15, 13737 (2013).
21. I. J. Godwin and M. E. G. Lyons,Electrochem. Comm.,32, 39 (2013).
22. M. E. G. Lyons, R. L. Doyle, and M. P. Brandon,Phys. Chem. Chem. Phys.,13, 21530 (2011).
23. L. D. Burke, M. E. Lyons, and O. J. Murphy,J. Electroanal. Chem.,132, 247 (1982). 24. E. J. M. O’Sullivan and L. D. Burke,J. Electrochem. Soc.,137, 466 (1990). 25. L. D. Burke and R. A Scannell,Platinum Met. Rev.28, 56 (1984).
26. M. E. G. Lyons and L. D. Burke,Modern Aspect of Electrochemistry,18, 169 (1986). 27. J. A. M Sim˜oes and J. L Beauchamp,Chem. Rev.,90, 629 (1990).
28. K. Juodkazis, J. Juodkazyt˙e, R. Vilkauskaite, B. Sebeka, and V. Jasulaitiene,Chemija,
19, 1 (2008).