Text Readability Assessment for Second Language Learners
Menglin Xia and Ekaterina Kochmar and Ted Briscoe University of Cambridge
William Gates Building Cambridge, CB3 0FD, UK
{mx223,ek358,ejb1}@cl.cam.ac.uk
Abstract
This paper addresses the task of readability as-sessment for the texts aimed at second lan-guage (L2) learners. One of the major chal-lenges in this task is the lack of significantly sized level-annotated data. For the present work, we collected a dataset of CEFR-graded texts tailored for learners of English as an L2 and investigated text readability assess-ment for both native and L2 learners. We ap-plied a generalization method to adapt mod-els trained on larger native corpora to estimate text readability for learners, and explored do-main adaptation and self-learning techniques to make use of the native data to improve sys-tem performance on the limited L2 data. In our experiments, the best performing model for readability on learner texts achieves an ac-curacy of0.797andP CCof0.938.
1 Introduction
Developing reading ability is an essential part of lan-guage acquisition. However, finding proper read-ing materials for trainread-ing language learners at a spe-cific level of proficiency is a demanding and time-consuming task for English instructors as well as the readers themselves. To automate the process of reading material selection and the assessment of reading ability for non-native learners, a system that focuses on text readability analysis for L2 learners can be developed. Such a system enhances many pedagogical applications by supporting readers in their second language education.
Text readability, which has been formally defined as the sum of all elements in textual material that
affect a reader’s understanding, reading speed, and level of interest in the material (Dale and Chall, 1949), is influenced by multiple variables. These may include the style of writing, its format and orga-nization, reader’s background and interest as well as various contextual dimensions of the text, such as its lexical and syntactic complexity, level of conceptual familiarity, logical sophistication and so on.
The choice of the criteria to measure readability often depends upon the need and characteristics of the target readers. Most of the studies so far have evaluated text difficulty as judged by native speak-ers, despite the fact that text comprehensibility can be perceived very differently by L2 learners. In the case of L2 learners, due to the difference in the pace of language acquisition, the focus in readability measures often differs from that for native readers. For example, the grammatical aspects of readability usually contribute more to text comprehensibility for L2 learners than the conceptual cognition difficulty of the reading material (Heilman et al., 2007). A system that is tailored towards learner’s perception of reading difficulty can produce more accurate esti-mation of text reading difficulty for non-native read-ers and thus better facilitate language learning.
One of the major challenges for a data-driven ap-proach to text readability assessment for L2 learners is that there is not enough significantly sized, prop-erly annotated data for this task. At the same time, text readability assessment in general has been pre-viously studied by many researchers and there are a number of existing corpora aimed at native speak-ers that can be used. To address the problem, we compiled a collection of texts that are tailored for
L2 learners’ readability and looked at several ap-proaches to make use of existing native data to es-timate readability for L2 learners.
In sum, the contribution of our work is threefold. First, we develop a system that produces state-of-the-art estimation of text readability, exploit a range of readability measures and investigate their predic-tive power. Second, we focus on readability for L2 learners of English and present a level-graded dataset for non-native readability analysis. Third, we explore methods that help to make use of the ex-isting native corpora to produce better estimation of readability when there is not enough data aimed at L2 learners. Specifically, we apply a generalization method to adapt models trained on native data to es-timate text readability for learners, and explore do-main adaptation and self-training techniques to im-prove system performance on the data aimed at L2 learners. To the best of our knowledge, these ap-proaches have not been applied in readability exper-iments before. The best performing model in our experiments achieves an accuracy (ACC) of 0.797
and Pearson correlation coefficient (P CC) of0.938.
2 Related Work
2.1 Automated Readability Assessment
Many previous studies on text readability assess-ment have used machine learning based approaches, which enable investigation of a broader set of lin-guistic features. Si and Callan (2001) and Collins-Thompson and Callan (2004) were among the early works on statistical readability assessment. They applied unigram language models and na¨ıve Bayes classification to estimate the grade level of a given text. Experiments showed that the language mod-elling approach yields better results in terms of accuracy than the traditional readability formulae, such as the the Flesch-Kincaid score (Kincaid et al., 1975). Schwarm and Ostendorf (2005) extended this method to multiple language models. They com-bined traditional reading metrics with statistical lan-guage models as well as some basic parse tree fea-tures and then applied an SVM classifier. Heilman et al. (2007; 2008) expanded the feature set to in-clude certain lexical and grammatical features ex-tracted from parse trees while using a linear regres-sion model to predict the grade level.
Pitler and Nenkova (2008) and Feng et al. (2010) were the first to introduce discourse-based features into the framework. The experiments with discourse features demonstrated promising results in predict-ing the readability level of text for both classification and regression approaches.
Kate et al. (2010) looked at both the effect of the feature choice and the machine learning frame-work choice on performance, and found that the im-provement resulting from changing the framework is smaller than that from changing the features.
2.2 Readability Assessment for L2 Learners
Most previous work on readability assessment is directed at predicting reading difficulty for native readers. Several efforts in developing automated readability assessment that take L2 learners into consideration have emerged since 2007. Heilman et al. (2007) tested the effect of grammatical fea-tures for both L1 (first language) and L2 readers and found that grammatical features play a more im-portant role in L2 readability prediction than in L1 readability prediction. Vajjala and Meurers (2012) combined measures from Second Language Acqui-sition research with traditional readability features and showed that the use of lexical and syntactic features for measuring language development of L2 learners has a substantial positive impact on read-ability classification. They observed that lexical fea-tures perform better than syntactic feafea-tures, and that the traditional features have a good predictive power when used with other features. Shen et al. (2013) developed a language-independent approach to au-tomatic text difficulty assessment for L2 learners. They treated the task of reading level assessment as a discriminative problem and applied a regression ap-proach using a set of features that they claim to be language-independent. However, most of these stud-ies have used textual data annotated with the read-ability levels for native speakers of English rather than L2 learners specifically.
Level1 Level2 Level3 Level4 Level5 age group 7-8 8-9 9-10 10-14 14-16 original corpus 629 801 814 1969 3500 modified corpus 529 767 801 1288 845 Table 1: Number of documents in the original and modified WeeBit corpus
or language instructors.
Overall, study of automatic readability analysis for L2 learners is still in its early stages, mainly due to the lack of available well-labelled data annotated with the readability levels for L2 learners.
3 Data
3.1 Native Data: the WeeBit Corpus
Among the existing publicly available corpora, the WeeBit corpus created by Vajjala and Meurers (2012) is one of the largest datasets for readabil-ity analysis. The WeeBit corpus is composed of articles targeted at readers of different age groups from two sources, the Weekly Reader magazine and the BBC-Bitesize website. Within the dataset, the Weekly Reader data consists of texts covering age-appropriate non-fictional content for four grade lev-els, corresponding to children of ages between 7-8, 8-9, 9-10 and 10-12 years old. The BBC-Bitesize website data is targeted at two grade levels, for ages between 11-14 and 14-16. The two datasets are merged to form the WeeBit corpus, with the targeted ages used to assign readability levels.
A copy of the original WeeBit corpus was ob-tained from the authors (Vajjala and Meurers, 2012). The texts are webpage documents stored in raw HTML format. We have identified that some texts contain broken sentences or extraneous content from the webpages, such as copyright declaration and links, that correlate with the target labels in a way which is likely to artificially boost performance on the task and would not generalize well to other datasets. To avoid that, we re-extracted texts from the raw HTML and discarded text documents that do not contain proper reading passages. Table 1 shows the distribution of texts in the modified dataset.
3.2 L2 Data: the Cambridge Exams dataset
Most work on readability assessment has been done on native corpora with age-specific reading levels (Schwarm and Ostendorf, 2005; Feng et al., 2010).
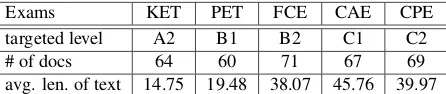
Exams KET PET FCE CAE CPE
targeted level A2 B1 B2 C1 C2
# of docs 64 60 71 67 69
avg. len. of text 14.75 19.48 38.07 45.76 39.97 Table 2:Statistics for the Cambridge English Exams data
Such texts are aimed not at L2 learners but rather at native-speaking children of different ages. There-fore, the level annotation in such texts is arrived at using criteria different from those that are relevant for L2 readers. The lack of significantly sized L2 level-annotated data raises a problem for readabil-ity analysis aimed at L2 readers. To tackle this, we created a dataset with texts tailored for L2 learners’ readability specifically.
We have collected a dataset composed of reading passages from the five main suite Cambridge En-glish Exams (KET, PET, FCE, CAE, CPE).1 These five exams are targeted at learners at A2–C2 levels of the Common European Framework of Reference (CEFR) (Council of Europe, 2001).2The documents are harvested from all the tasks in the past reading papers for each of the exams. The Cambridge En-glish Exams are designed for L2 learners specifically and the A2–C2 levels assigned to each reading paper can be treated as the level of reading difficulty of the documents for the L2 learners.3 Table 2 shows the number of documents at each CEFR level across the dataset. The data is available athttp://www. cl.cam.ac.uk/˜mx223/cedata.html.
Experimenting on the language testing data anno-tated with the L2 learner readability levels is one of the contributions of this research. Most previ-ous work on readability assessment for English have relied on the data annotated with readability levels aimed at native speakers. In this work, we use lan-guage testing data with the levels assigned based on L2 learner levels, and we believe that this level an-notation is more appropriate for text readability as-sessment for L2 learners than using texts with the level annotation aimed at native speakers.
1http://www.cambridgeenglish.org
2The CEFR determines foreign language proficiency at six levels in increasing order: A1 and A2, B1 and B2, C1 and C2.
[image:3.612.73.299.54.98.2]4 Readability Measures
This section describes the range of linguistic fea-tures explored and the machine learning framework applied to the WeeBit data that constitute a general readability assessment system. The set of features used in our experiments is an extension to those used in previous work (Feng et al., 2010; Pitler and Nenkova, 2008; Vajjala and Meurers, 2012; Vaj-jala and Meurers, 2014), and their predictive power for reading difficulty assessment is investigated in our experiments. We have extended the feature set with the EVP-based features, GR-based complexity measures and the combination of language model-ing features that have not been applied to readability assessment before.
4.1 Features
Traditional Features The traditional features are easy-to-compute representations of superficial as-pects of text. The metrics that are considered in-clude: the number of sentences per text, average and maximum number of words per sentence, average number of characters per word, and average number of syllables per word. Two popular readability for-mulas are also included: the Flesch-Kincaid score (Kincaid et al., 1975) and the Coleman-Liau read-ability formula (Coleman and Liau, 1975).
Lexico-semantic Features Vocabulary knowl-edge is one of the most important aspects of reading comprehension (Collins-Thompson, 2014). Lexico-semantic features provide information about the dif-ficulty or familiarity of vocabulary in the text.
A widely used lexical measure is the type-token ratio (TTR), which is the ratio of the number of unique word tokens (referred to as types) to the total number of word tokens in a text. However, the con-ventional TTR is influenced by the length of the text.
Root TTRandCorrected TTR, which take the loga-rithm and square root of the text length instead of the direct word count as denominator, can produce a more unbiased representation and are included in the experiment.
Part of speech (POS) based lexical variation and lexical density measures (Lu, 2011) are also ex-amined. Lexical variation is defined as the type-token ratio of lexical items such as nouns, adjec-tives, verbs, adverbs and prepositions. Lexical
den-sityis defined as the proportion of the five classes of lexical items in all word tokens. The percentage of content words (nouns, verbs, adjectives and ad-verbs) and function words (all the remaining POS types) are two other indicators of lexical density.
Vajjala and Meurers (2012; 2014) reported in their readability classification experiment that the propor-tion of words in the text that are found in the Aca-demic Word List is one of the most predictive mea-sures among all the lexical features they considered. The Academic Word List (Coxhead, 2000) is com-prised of words that frequently occur across all topic ranges in an academic text corpus. Theproportion of academic vocabulary words in the text can be viewed as another measure of lexical complexity.
A similar but more refined approach to estimate lexical complexity is based on the use of theEnglish Vocabulary Profile (EVP).4 The EVP is an online vocabulary resource that contains information about which words and phrases are acquired by learners at each CEFR level. It is collected from the Cam-bridge Learner Corpus (CLC), a collection of exam-ination scripts written by learners from all over the world (Capel, 2012). It provides a more fine-grained lexical complexity measure that captures the relative difficulty of each word by assigning the word diffi-culty to one of the six CEFR levels. Additionally, the EVP indicates the word difficulty for L2 learners rather than native speakers, which makes it more in-formative in non-native readability analysis. In our experiments, the proportion of words at each CEFR level is calculated and added to the feature set.
Parse Tree Syntactic FeaturesA number of syn-tactic measures based on the RASP parser output (Briscoe et al., 2006) are used to describe the gram-matical complexity of text, including average parse tree depth, and average number of noun, verb, adjec-tive, adverb, prepositional phrases and clauses per sentence.
Grammatical relations(GR) between constituents in a sentence may also affect the judgement of syntactic difficulty. Yannakoudakis (2013) applied 24 GR-based complexity measures in essay scoring and showed good results. These complexity mea-sures capture the grammatical sophistication of the text through the representation of the distance
tween the sentence constituents. For instance, these measures calculate the longest/average distance in the GR sets generated by the parser and the aver-age/maximum number of GRs per sentence. A set of 24 GR-based measures used by Yannakoudakis (2013) are generated by RASP for each sentence. We take the average of these measures across the text to incorporate the GR-related aspect of its syntactic difficulty.
Other types of complexity measures that are de-rived from the parser output include: cost metric, which is the total number of parsing actions per-formed for generating the parse tree; ambiguity of the parse, and so on. A total number of 114 non-GR based complexity measures are extracted. These complexity measures are averaged across the text and used to model finer details of the syntactic diffi-culty of the text.
Language Modeling Features Statistical lan-guage modeling (LM) provides information about distribution of word usage in the text and is in fact another way to describe the lexical dimension of readability. To avoid over-fitting to the WeeBit data, two types of language modeling based features are extracted using the SRILM toolkit (Stolcke, 2002): (1)word token n-gram models, withnranging from
1to5, trained on the British National Corpus (BNC), and (2) POS n-grams, with nranging from 1 to5, trained on the five levels in the WeeBit corpus it-self. The LMs are used to score the text with log-likelihood and perplexity.
Discourse-based Features Discourse features measure the cohesion and coherence of the text. Three types of discourse-based features are used.
(1) Entity density features
Previous work by Feng et al. (2009; 2010) has shown that entity density is strongly associated with text comprehension. An entity set is a union of named entities and general nouns (including nouns and proper nouns) contained in a text, with overlap-ping general nouns removed. Based on this, 9 en-tity density features, including the total number of all/unique entities per document, the average num-ber of all/unique entities per sentence, percentage of named entities per sentence/document, percentage of named entities in all entities, percentage of over-lapping nouns removed, and percentage of unique named entities in all unique entities, are calculated.
(2) Lexical chain features
Lexical chains model the semantic relations among entities throughout the text. The lexical chaining algorithm developed by Galley and McK-eown (2003) is implemented. The semantically re-lated words for the nouns in the text, including syn-onyms, hypernyms, and hypsyn-onyms, are extracted from the WordNet (Miller, 1995). Then for each pair of the nouns in the text, we check whether they are semantically related. Finally, lexical chains are built by linking semantically related nouns in text. A set of7 lexical chain-basedfeatures are computed, in-cluding total number of lexical chains per document, total number of lexical chains normalized with text length, average/maximum lexical chain length, aver-age/maximum lexical chain span, and the number of lexical chains that span more than half of the docu-ment.5
(3) Entity grid features
Another entity-based approach to measure text coherence is the entity grid model introduced by Barzilay and Lapata (2008). They represented each text by an entity grid, which is a two-dimensional array that captures the distribution of discourse enti-ties across text sentences. Each grid cell contains the grammatical role of a particular entity in the speci-fied sentence: whether it is a subject (S), object (O), neither a subject nor an object (X), or absent from the sentence (-). A local entity transition is defined as the transition of the grammatical role of an en-tity from one sentence to the following sentence. In our experiments, we used the Brown Coreference Toolkit v1.0 (Eisner and Charniak, 2011) to generate the entity grid for the documents. Theprobabilities of the 16 typesof local entity transition patterns are calculated to represent the coherence of the text.
4.2 Implementation and Evaluation
In our experiments, we cast readability assessment as a supervised machine learning problem. In par-ticular, a pairwise ranking approach is adopted and compared with a classification method. We believe that the reading difficulty of text is a continuous rather than discrete variable. Text difficulty within a level can also vary. Instead of assigning an
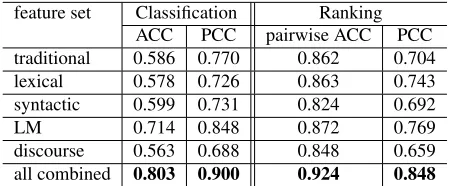
feature set Classification Ranking ACC PCC pairwise ACC PCC traditional 0.586 0.770 0.862 0.704 lexical 0.578 0.726 0.863 0.743 syntactic 0.599 0.731 0.824 0.692 LM 0.714 0.848 0.872 0.769 discourse 0.563 0.688 0.848 0.659 all combined 0.803 0.900 0.924 0.848
Table 3:Classification and ranking results on the WeeBit cor-pus with feature sets grouped by their type
lute level to the text, treating readability assessment as a ranking problem allows prediction of the rela-tive difficulty of pairs of documents, which captures the gradual nature of readability better. Because of this, we hypothesize that the ranking model can gen-eralize better to unseen texts and texts with different level annotation.
Support vector machines (SVM) have been used in the past for readability assessment by many re-searchers and have consistently yielded better results when compared to other statistical models for the task (Kate et al., 2010). We use the LIBSVM toolkit (Chang and Lin, 2011) to implement both multi-class multi-classification and pairwise ranking. Five-fold cross validation is used for evaluation. We report two popular performance metrics, accuracy (ACC) and Pearson correlation coefficient (P CC), and use pairwise accuracy to evaluate ranking models. Pair-wise accuracy is defined as the percentage of in-stance pairs that the model ranked correctly. It should be noted that accuracy and pairwise accuracy are not directly comparable. Thus, P CC is intro-duced to compare the results of the classification and the ranking models.
4.3 Results
In predicting the text reading difficulty on the WeeBit data, the best result is achieved with a com-bination of all features and a classification model, withACC=0.803andP CC=0.900. We performed ablation tests and found that all feature sets have contributed to the overall model performance. Al-though there have been readability assessment stud-ies on similar datasets, the results obtained in our experiments are not directly comparable to those. One of the major reasons is the modifications that we have made to the corpus (as discussed in
Sec-tion 3.1). Vajjala and Meurers (2012) reported that a multilayer perceptron classifier using three tradi-tional metrics alone yielded an accuracy of70.3%on their version of the WeeBit corpus. Their final sys-tem achieved a classification accuracy of93.3%on the five-class corpus. Nonetheless, the best system in our experiments yields results competitive to most existing studies. For reference, Feng et al. (2010) re-ported an accuracy of74.01%using a combination of discourse, lexical and syntactic features for read-ability classification on their Weekly Reader Corpus and an accuracy of63.18% when using all feature sets described in Schwarm et al. (2005).
Comparing the classification and the ranking models, we note that the results of the two models vary across feature sets and none of the two mod-els is consistently better than the other. When all features are combined, the classification model out-performs the ranking one. It suggests that a ranking model is not necessarily the best model in predict-ing readability overall when trained and tested on the same dataset.
5 Readability Assessment on L2 Data
So far we have studied the effect of various readabil-ity measures on the task of readabilreadabil-ity assessment and built two different types of models to predict text difficulty. However, the WeeBit corpus consists of texts aimed at native speakers of different ages rather than at L2 readers. Although there are cer-tain similarities concerning reading comprehension between these two groups, the perceived difficulty of texts can be very different due to the difference in the pace and stages of language acquisition. Since the goal of our research is to automatically detect readability levels for language learners, it would be more helpful to work with data that are directly an-notated with reading difficulty for L2 learners.
classification ranking ACC PCC pairwiseACC PCC native data 0.803 0.900 0.924 0.848 L2 data 0.233 0.730 0.913 0.880 Table 4:Generalization results of the classification and ranking models trained on native data applied to language testing data
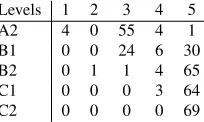
Levels 1 2 3 4 5 A2 4 0 55 4 1 B1 0 0 24 6 30 B2 0 1 1 4 65 C1 0 0 0 3 64 C2 0 0 0 0 69
Table 5: Confusion matrix of the classification model on the language testing data
5.1 Generalization Experiment
First, we tested the generalization ability of the clas-sification and ranking models trained on the WeeBit corpus on the Cambridge Exams data to see if it is possible to directly apply the models trained on na-tive data to L2 data. Table 4 reports the results.
In the case of the multi-class classification model, the accuracy dropped greatly when the model is ap-plied to the L2 dataset, while the correlation re-mained relatively high. Looking at the confusion matrix of the classifier’s predictions on the L2 data (see Table 5), we notice that most of the documents in the L2 data are classified into the higher levels of WeeBit by the model. This is because, on av-erage, the Cambridge Exams texts are more difficult than the WeeBit corpus ones which are generally tar-geted at children of young ages. Thus, the mismatch between the targeted levels has led to poor general-ization of the classification model.
In contrast, for the ranking model, both evaluation measures are relatively unharmed when the model is applied to the L2 data. It shows that, when general-izing to an unseen dataset, the estimation produced by the ranking model is able to maintain a high pair-wise accuracy and correlation with the ground truth. We believe that this is because the ranking model does not try to band the documents into one of the levels on a different basis of difficulty annotation. Instead, pairwise ranking captures the relative read-ing difficulty of the documents, and therefore the re-sulting ranked positions of the documents are closer to the ground truth compared to the classification model.
5.2 Mapping Ranking Scores to CEFR Levels
From the generalization experiment we can con-clude that ranking is more accurate in predicting the CEFR levels of unseen learner texts than classifica-tion. Therefore, it is more appropriate to make use of the more informative ranking scores produced by the ranking model to learn a function that bands the scores into CEFR levels.
In learning the mapping function, we adopted a five-fold cross-validation approach. We split the Cambridge Exams dataset into five cross validation folds, with approximately equal number of docu-ments at each level in each fold. A mapping func-tion that converts ranking scores into CEFR levels is learnt from training folds and then tested on the validation fold in each run. The final results are av-eraged across the runs.
We compared three groups of methods to learn the mapping function.
(1) Regression and rounding: A regression func-tion is learnt from the ranking scores and the ground truth labels on the training part of the dataset and then applied to the validation part. The mapped CEFR prediction is then rounded to its closest inte-ger and clamped to range[1,5]. Both linear regres-sion and polynomial regresregres-sion models are consid-ered. The intuition behind using polynomial func-tions instead of a simple linear function for mapping is that the correlation of ranking scores and CEFR levels is not necessarily linear so a non-linear func-tion might be more suitable for this task.
(2) Learning the cut-off boundary: We learn a separation boundary that bands the ranking scores to levels by maximizing the accuracy of such sep-aration. For instance, we consider the ranked doc-uments as a list with descending readability, with their ranking scores following the same order. If we could find a suitable cut-off boundary between each two adjacent levels in the list, then every docu-ment above the boundary would fall into the higher level, and all documents below the boundary into the lower level. In this way, the ranked documents are banded into five levels with four separation bound-aries learnt.
[image:7.612.137.239.147.208.2]sin-Mapping functions ACC PCC linear regression 0.541 0.587 polynomial regression 0.586 0.873
[image:8.612.334.520.52.106.2]cut-off boundary 0.562 0.872 logistic regression 0.610 0.862 linear SVM 0.622 0.864 Table 6:Results of mapping ranking scores to CEFR levels
gle dimensional feature and CEFR levels as the tar-get value. Here, two approaches are adopted and compared, logistic regression and a linear SVM. As a matter of fact, the SVM approach can be consid-ered as a variation of learning a separation bound-ary, as it tries to find an optimal decision boundary between the classes.
Table 6 shows the results of the three map-ping methods. Among the three approaches for mapping ranking scores to CEFR levels (regression-based, separation boundary-based, and classification-based), the classification ones showed better results than the others in terms of accuracy. Though not as high in accuracy as the SVM, a polynomial mapping function6 also yielded very good results in terms of P CC. Compared to the other two methods, the separation boundary-based approach performs better than a linear regression function but fails to match the polynomial regres-sion and classification-based methods. Nonetheless, all three approaches considerably outperformed the naive generalization of the classification model from the WeeBit corpus to the Cambridge Exams data. These improvements are statistically significant at
p<0.05level.7
5.3 Domain Adaptation from Native to L2 Data
Another way to make use of the native data is to treat the task as a domain adaptation problem, where the WeeBit corpus is taken as the source domain, and the L2 data as the target domain. The idea behind this is to use out-of-domain training data to boost the performance on limited in-domain data.
EasyAdapt (Daum´e III, 2007) is one of the best performing domain adaptation algorithms. It has previously been applied to essay scoring and showed
6A 4th order polynomial function is adopted because it yields better results compared to other orders.
7Throughout this paper, we test significance usingt-test for ACCand Williams’ test (Williams, 1959) forP CC.
pairwise ACC PCC EasyAdapt 0.933 0.905 native data only 0.913 0.880 L2 data only 0.943 0.913 Table 7:Results of domain adaptation from native to language testing data
good results (Phandi et al., 2015). In a two domain case, EasyAdapt expands the input feature space from RF to R3F, and then applies two mapping functionsΦS(x) = hx,x,0i andΦT(x) = hx,0,xi on source domain data and target domain data input vectors respectively. Here,0=h0, ...0i ∈RF is the zero vector. In this manner, the instance feature vec-tors from the WeeBit corpus and Cambridge Exams datases are augmented to three times their original dimensionality. The augmented feature space cap-tures both general and domain specific information and is thus capable of generalizing source domain knowledge to facilitate estimation on the target do-main. As there is a mismatch between the levels on native and L2 data, the pairwise ranking algo-rithm needs to be adapted to ensure that the prefer-ence pairs are only created from the same domain. A five-fold cross-validation is used as in previous ex-periments.
Table 7 shows the results of applying EasyAdapt with the ranking model. For comparison, we also present the results obtained when we apply the model trained on the native data to the L2 data di-rectly, and the results obtained when we train the ranking model on the L2 data only. We can see that ranking with EasyAdapt outperforms the naive generalization approach significantly (p<0.05), but it does not beat the results obtained when training a model on L2 data directly.
After applying the ranking model with EasyAdapt, the ranking scores can be converted to CEFR levels using the same methods as described in Section 5.2. The best mapped CEFR estimation is achieved with a linear SVM classifier on the ranking score, reaching an ACC of 0.707 and P CC of
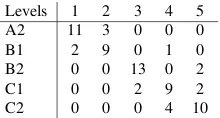
[image:8.612.100.274.54.131.2]Levels 1 2 3 4 5 A2 11 3 0 0 0 B1 2 9 0 1 0 B2 0 0 13 0 2 C1 0 0 2 9 2 C2 0 0 0 4 10
Table 8: Confusion matrix of the mapped estimation after EasyAdapt application on one of the cross-validation folds
Type ACC PCC
L2 data only 0.785 0.924 self-training 0.797 0.938 Table 9:Results of self-training
5.4 Using Self-training to Enhance the Classification Model
In addition to the domain adaptation, we experi-mented with self-training to boost the performance on the limited L2 data with the native data. To the best of our knowledge, neither of the approaches has been applied to readability assessment before.
Self-training is a commonly used semi-supervised machine learning algorithm that aims to use the large amount of unlabelled data to help build a better clas-sifier on a small amount of labeled data (Zhu, 2005). When using native data to boost model performance on L2 data with self-training, the L2 data is regarded as labeled instances, and the native data as unlabeled ones. A model is trained on the L2 data and then used to score the native data. The most confident
K instances as well as their labels are added to the training set. Then the model is re-trained and the procedure is repeated. A five-fold cross-validation is used in evaluation as before.
We have experimented with a grid search onK’s and the number of iterations, and found out that whatever the choice of the parameters is, the model performance degrades with self-training when the unlabeled instances are added blindly to all levels of the L2 dataset. Taking into account the mismatch in the difficulty levels between the native and L2 texts, we adapted the algorithm to add the unlabeled data only to the lower three levels of the L2 dataset. The best result is achieved withK=10and9iterations, with270texts added in total (as shown in Table 9). It seems reasonable to compare the results of this ap-proach to those obtained with a model that is trained directly on the L2 data. Hence, we include the re-sults of this model in Table 9 for comparison.
The results show that self-training can signifi-cantly (p<0.05) help estimating readability for L2 texts by including a certain amount of unlabeled data (in this case, the native data) in training. However, the range of the reading difficulty covered by the un-labeled data may influence the model performance.
6 Conclusions and Future Work
We investigated text readability assessment for both native and L2 learners. We collected a dataset with text tailored for language learners’ readability and explored methods to adapt models trained on larger existing native corpora in estimating text read-ing difficulty for learners. In particular, we devel-oped a system that achieves state-of-the-art perfor-mance in readability estimation, withACC=0.803
andP CC=0.900on native data, andACC=0.785
andP CC=0.924on L2 data, using a linear SVM. We compared a ranking model against the classifi-cation model for the task and showed that although a ranking model does not necessarily outperform a classification one in readability assessment on the same data, it is more accurate when generalizing to an unseen dataset. Following this, we showed that, by applying a ranking model and then learn-ing a mapplearn-ing function, the model trained on the na-tive data can be applied to estimate the CEFR levels of unseen text effectively. This model achieves an accuracy of0.622andP CC of0.864, and consid-erably outperforms the naive generalization of the classification model, which achieves an accuracy of
0.233andP CCof0.730.
In addition, we experimented with domain adap-tation and self-training approaches to make use of the more plentiful native data to produce better es-timation of readability when the L2 data is limited. When treating the native data as a source domain and L2 data as a target domain, applying the EasyAdapt algorithm for ranking achieves an accuracy of0.707
and P CC=0.899. The best result is achieved by using self-training to include native data as unla-belled data in training the classification model, with
ACC=0.797andP CC=0.938.
Acknowledgements
We thank Cambridge Assessment for their assis-tance in the collection of the language testing data. We would like to express our gratitude to Sowmya Vajjala and Detmar Meurers for sharing the WeeBit corpus with us. We are also grateful to the reviewers for their useful comments.
References
Regina Barzilay and Mirella Lapata. 2008. Modeling local coherence: An entity-based approach. Computa-tional Linguistics, 34(1):1–34.
Ant´onio Branco, Jose Rodrigues, Francois Costa, Jaime Silva, and Richard Vaz. 2014. Assessing automatic text classification for interactive language learning. InInformation Society (i-Society), 2014 International Conference on, pages 70–78.
Ted Briscoe, John Carroll, and Rebecca Watson. 2006. The second release of the RASP system. In Proceed-ings of the COLING/ACL on Interactive presentation sessions, pages 77–80.
Annette Capel. 2012. Completing the English Vocabu-lary Profile: C1 and C2 vocabuVocabu-lary. English Profile Journal, 3(e1).
Chih-Chung Chang and Chih-Jen Lin. 2011. LIBSVM: a library for support vector machines. ACM Trans-actions on Intelligent Systems and Technology (TIST), 2(3):27.
Meri Coleman and Ta Lin Liau. 1975. A computer read-ability formula designed for machine scoring. Journal of Applied Psychology, 60(2):283–284.
Kevyn Collins-Thompson and James Callan. 2004. A Language Modeling Approach to Predicting Reading Difficulty. InProceedings of North American Chap-ter of the Association for Computational Linguistics: Human Language Technologies, pages 193–200. Kevyn Collins-Thompson. 2014. Computational
assess-ment of text readability: A survey of current and future research. ITL - International Journal of Applied Lin-guistics, 165(2):97–135.
Council of Europe. 2001. Common European Frame-work of Reference for Languages: Learning, Teaching, Assessment. Cambridge University Press.
Averil Coxhead. 2000. A new academic word list.
TESOL Quarterly, pages 213–238.
Edgar Dale and Jeanne S. Chall. 1949. The concept of readability.Elementary English, 26(1):19–26. Hal Daum´e III. 2007. Frustratingly easy domain
adapta-tion. InProceedings of the 45th Annual Meeting of the Association of Computational Linguistics, pages 256– 263.
Micha Eisner and Eugene Charniak. 2011. Extending the entity grid with entity-specific features. In Pro-ceedings of the 49th Annual Meeting of the Associa-tion for ComputaAssocia-tional Linguistics: Human Language Technologies: short papers-Volume 2, pages 125–129. Lijun Feng, No´emie Elhadad, and Matt Huenerfauth. 2009. Cognitively motivated features for readability assessment. InProceedings of the 12th Conference of the European Chapter of the Association for Compu-tational Linguistics, pages 229–237.
Lijun Feng, Martin Jansche, Matt Huenerfauth, and No´emie Elhadad. 2010. A comparison of features for automatic readability assessment. In Proceedings of the 23rd International Conference on Computational Linguistics: Posters, pages 276–284.
Thomas Franc¸ois and C´edrick Fairon. 2012. An AI readability formula for French as a foreign language. In Proceedings of the 2012 Joint Conference on Em-pirical Methods in Natural Language Processing and Computational Natural Language Learning, pages 466–477.
Michel Galley and Kathleen McKeown. 2003. Improv-ing word sense disambiguation in lexical chainImprov-ing. In International Joint Conference on Artificial Intel-ligence, volume 3, pages 1486–1488.
Michael Heilman, Kevyn Collins-Thompson, Jamie Callan, and Maxine Eskenazi. 2007. Combining lex-ical and grammatlex-ical features to improve readability measures for first and second language texts. In Pro-ceedings of North American Chapter of the Associa-tion for ComputaAssocia-tional Linguistics: Human Language Technologies, pages 460–467.
Michael Heilman, Kevyn Collins-Thompson, and Max-ine Eskenazi. 2008. An analysis of statistical models and features for reading difficulty prediction. In Pro-ceedings of the Third Workshop on Innovative Use of NLP for Building Educational Applications, pages 71– 79.
Rohit J. Kate, Xiaoqiang Luo, Siddharth Patwardhan, Martin Franz, Radu Florian, Raymond J. Mooney, Salim Roukos, and Chris Welty. 2010. Learning to predict readability using diverse linguistic features. In
Proceedings of the 23rd International Conference on Computational Linguistics, pages 546–554.
J. Peter Kincaid, Robert P. Fishburne Jr., Richard L. Rogers, and Brad S. Chissom. 1975. Derivation of new readability formulas (Automated Readability In-dex, Fog Count and Flesch Reading Ease Formula) for Navy enlisted personnel. Technical report, DTIC Doc-ument.
George A Miller. 1995. WordNet: a lexical database for English. Communications of the ACM, 38(11):39–41. Peter Phandi, Kian Ming A. Chai, and Hwee Tou Ng. 2015. Flexible Domain Adaptation for Automated Essay Scoring Using Correlated Linear Regression. In Proceedings of the 2015 Conference on Empirical Methods in Natural Language Processing, pages 431– 439.
Ildik´o Pil´an, Sowmya Vajjala, and Elena Volodina. 2015. A readable read: Automatic Assessment of Language Learning Materials based on Linguistic Complexity.
To appear in Research in Computing Science. Emily Pitler and Ani Nenkova. 2008. Revisiting
read-ability: A unified framework for predicting text qual-ity. In Proceedings of the Conference on Empirical Methods in Natural Language Processing, pages 186– 195.
Sarah E. Schwarm and Mari Ostendorf. 2005. Read-ing level assessment usRead-ing support vector machines and statistical language models. In Proceedings of the 43rd Annual Meeting on Association for Compu-tational Linguistics, pages 523–530.
Wade Shen, Jennifer Williams, Tamas Marius, and Eliz-abeth Salesky. 2013. A Language-Independent Ap-proach to Automatic Text Difficulty Assessment for Second-Language Learners. InProceedings of the 2nd Workshop on Predicting and Improving Text Readabil-ity for Target Reader Populations, pages 30–38. Luo Si and Jamie Callan. 2001. A statistical model for
scientific readability. InProceedings of the tenth in-ternational conference on Information and knowledge management, pages 574–576.
Andreas Stolcke. 2002. SRILM-an extensible language modeling toolkit. InProceedings of the International Conference on Spoken Language Processing, pages 901–904.
Sowmya Vajjala and Detmar Meurers. 2012. On improv-ing the accuracy of readability classification usimprov-ing in-sights from second language acquisition. In Proceed-ings of the Seventh Workshop on Building Educational Applications Using NLP, pages 163–173.
Sowmya Vajjala and Detmar Meurers. 2014. Read-ability assessment for text simplification: From analysing documents to identifying sentential simplifi-cations. International Journal of Applied Linguistics, 165(2):194–222.
Evan James Williams. 1959. Regression analysis, vol-ume 14. Wiley New York.
Helen Yannakoudakis. 2013. Automated assessment of English-learner writing. Technical Report UCAM-CL-TR-842, University of Cambridge, Computer Lab-oratory.