Munich Personal RePEc Archive
Does aid enhance growth?
Yahyaoui, Ismahen and Bouchoucha, Najeh
University Sousse, University Sousse
30 December 2018
Online at
https://mpra.ub.uni-muenchen.de/91093/
1
Does Aid enhance Growth?
Ismahene Yahyaoui1*,
Najeh Bouchoucha2**
Abstract:
In recent years, the volume of international aid has increased, from rich countries to poor countries.
Despite the importance of this aid, developing countries have not even been able to catch up with
emerging countries, contrary to the expectations of convergence theories. Thus, the purpose of this
article is to examine the short and the long term impact of foreign aid on economic growth in the case of
Tunisia. The paper opted to use a VECM model to examine the long-term relationship of foreign aid on
growth. The data cover from the year 1980 to 2013 in the case of Tunisia. The results obtained through
VECM model, three are statistically significant. The empirical results are showing that Official
Developped Aid affects positively the Tunisian economic growth. On the other hand, there is a long-term
relationship between the two variables. In addition, the effectiveness of aid in terms of economic growth
is more important in the long term than in the short term.
Keywords: economic growth, Official Developped Aid, effectiveness, long-term relationship, VECM
JEL Classification: F35
1.
Introduction
To reduce unemployment and ensure economic growth, investments are increasing and they hold great
importance to the government. Its funding is through domestic savings, if sufficient, or by external
financing, in case of its failure. This last category is made for developed countries by debt and the
developing countries by debt and foreign aid.
1University of Economics and Management Sousse, Tunisia *contact email : asmahen.yahyaoui@gmail.com
2University of Economics and Management Sousse, Tunisia
2
According to the Development Assistance Committee (DAC) of the OECD, aid is a statistic. It represents
all donations and loans at sufficiently favorable terms (net of principal repayments) to specified
countries, granted by public bodies in the pursuit of objectives of economic development and
improvement of living conditions including excluding military activities. Thus, ODA has a moral aspect.
It is considered as an act of international solidarity. It is a moral duty to compensation, under which a
significant effort, in terms of percentage of GDP, was expected from donor countries.
The aid aims to stimulate growth in developing countries to extract poverty. But poor countries are
mainly characterized by low capital stock. So, if help finances investment in these countries, it increases
their capital stock. The production’s capacity is proportional to the capital stock, while assistance will
promotes economic growth in the countries in difficulty, and hence global development.
Thus, the aid becomes the largest program of humanity. Today, the underdeveloped countries have
varied and enormous contributions in foreign aid. Either in the form of loans and/or grants, ODA has
financed many projects and programs in developing countries, in multiple areas: education, health,
infrastructure...
Nevertheless, the controversy multiply around the positive impact of ODA on growth. In this context,
there are three theories that oppose this regard: The first shows the existence of a positive relationship to
the extent that aid increases investment and capital stock, finance investment. Also, ODA transmitted
technology and knowledge from rich countries to poor countries.
The second relationship is conditional. Indeed, under certain circumstances, aid can stimulate growth.
Among these conditions, we can distinguish the characteristics of the recipient country and the practices
and procedures of donors, On the other hand, the third relationship is negative (or absent). Here, the aid
only increases corruption, deteriorates the quality of governance. ODA is necessarily absorbed in
limousines and presidential palaces.
From today, Tunisia is unable to catch up with GDP levels seen in developed countries. The various
partnerships and agreements, especially with the European Union and international aid have alternated,
without real impact on its levels of development.
Indeed, Tunisia’s GDP per capita (current US $) decreased in recent years from 4,342.676 in 2008 to
4,197.528 in 2012 despite the fact that net ODA received per capita (constant US dollars) greatly
increased during this period from 36.302 to 94.365. The questions that arise are: why this deterioration of
growth? And what is the effect of development aid on economic growth in the case of Tunisia?
So, in this framework, we try to elaborate theoretically and empirically the effectiveness of the
3
The majority of previous studies focus on short-term relationship, using the static model or the dynamic
model but they neglected to examine the relationship between foreign aid and economic growth in the
long-term run. Precisely, this work attempts to fill this gap by granting any major importance to the
analysis of this long-term relationship (cointegration), which is our major expansion. In this context, we
will study the long-term relationship between ODA and economic growth in the case of Tunisia for the
period 1980-2013.
The rest of the document is organized as follows. Section 2 presents a review of the literature. Then, the
paper presents the methodology used and results in section 3. The last section of the paper provides a
conclusion.
2. Literature Review
Controversies multiply around the effectiveness of foreign aid. Sachs (2004) and Stiglitz (2002) argue
that aid is positively correlated to growth. It contributed to the reduction of poverty. According to them,
the abundant country of aid would have held even worse results. However, aid enhances economic
growth as it increases savings and the stock of capital and finance investment. In addition, it increases
worker productivity and transmitted technology and knowledge between poor and rich countries.
However, diminishing returns remains ambiguous, if aid increases.
Similarly, Moolio and Kong (2016) showed that foreign aid has a positive long-term effect on economic
growth in the case of four countries (Cambodia, Laos, Myanmar, Vietnam) in the region of ASEAN.
In the same context, Arndt et al. (2015) confirmed the effectiveness of foreign aid in terms of economic
growth. Arndt et al. (2015) have focused on the role of international aid on immediate sources of growth:
they have shown that development aid stimulates economic growth, promotes structural change,
improves social indicators and reduces poverty.
However, other economists show the existence of a negative correlation between these two variables.
Indeed, Peter Bauer is the pioneer of this thesis, arguing that the aid has a deterrent effect on investment,
it influences the private sector and hinders development. Others (like Mosley (1980)) show no
correlation between these two variables. The negative effect is mainly explained by the fact that aid is
absorbed into limousines and presidential palaces, it encourages corruption.
Similarly, ODA leads to currency appreciation, reduces the profitability of the production of tradable
goods, and negatively affect agricultural prices and producers incomes. In addition, aid can reduce
savings, whether individuals (effect on the interest rate) or public and can increase the bad governments.
4
Looking at the long-run relationship between economic growth and foreign aid, Mallik (2008) found that
there is a long-term negative relationship between real GDP per capita and aid as a percentage of GDP,
in the case of the six poorest and most aid-dependent African countries (Central African Republic,
Malawi, Mali, Niger, Sierra Leone and Togo). Similarly, in the case of Egypt, Abd El Hamid Ali (2013)
has shown that foreign aid is negatively and significantly correlated with short- and long-term economic
growth.
While a third group of researchers claims that the relationship between these two variables is conditional.
Indeed, some economists, such as Kaufmann and Pritchet (1997), argue that the World Bank’s projects
have a better performance in countries where civil liberties were more respected. As well, in the same
context, Burnside and Dollar (1997, 2000a) have shown that the effectiveness of foreign aid depends on
the quality of economic policies. These authors used a policy variable that depends on open trade,
inflation and the budget deficit. In this context, Burnside and Dollar (2000) and Collier and Dollar (2002)
affirm that the effectiveness of aid is conditional on the quality of economic policies, the quality of
governance. Also, there are other factors that influence the effectiveness of aid as: vulnerability to
external shocks, the socio-political system, the volatility of aid flows and the absorption capacity.
Indeed, Amprou and Chauvet (2004) show that economic growth in vulnerable countries may feel twice
shocks which the first is direct, while the second is indirect through their influence on the quality of
economic policies. So the effectiveness of aid is higher in countries suffering from shock even if they
have poor policies.
About post-conflict situations, Collier and Hoeffler (2002) argue that these periods may approve two
contradictory situations: first, rebuilding the country and with the logical collapse of wages, aid
effectiveness decreases on the other hand, weak governments during these periods weakens efficiency. In
addition, there are other circumstances such as export price shocks (Collier and Dehn 2001), climate
disruption and the terms of trade (Guillaumont and Chauvet 2001), the quality of policies and
institutions...
Similarly, practices and procedures of donors may also condition the aid-growth relationship. However,
multilateral aid could be more effective than bilateral aid, and tied aid is supposed to be more productive
than untied aid. In addition, donor programs are less effective if they set up a large bureaucracy.
We can say then that the direct relationship between aid and growth is not decided. So, some conditions
5
3
. Methodology and Results
Various methods have been used to understand the effectiveness of ODA in terms of economic growth.
The authors neglected the long-term relationship, in this context we focus on the long-term relationship
by using the Johansen model and the VECM model.
3.1. Model and choice of variables:
From a methodological point of view, we choose to evaluate the effectiveness of development assistance
in terms of economic growth in the case of Tunisia. The data are obtained from the database of the World
Development Indicators of the World Bank in 2013. Then, the equation to be studied is as follows:
𝒀𝒊𝒕 = 𝝉𝟎 +𝝋𝟏𝒐𝒅𝒂𝒊𝒕+𝝋𝟑𝒎𝟐𝒊𝒕 +𝝋𝟒𝒐𝒑𝒆𝒏𝒊𝒕 +𝝋𝟓𝒊𝒏𝒇𝒊𝒕 +𝝋𝟔𝒑𝒐𝒑𝒊𝒕 +𝝅𝒊𝒕 (1)
With: 𝐘𝐢𝐭: Per capita growth rates (Burnside and Dollar, 2000), 𝐨𝐝𝐚𝐢𝐭: Aid net received by resident divided by the GDP per capita (McGillivray et al., 2006), 𝒐𝒑𝒆𝒏: the trade opening that is measured by the sum of export and import relative to GDP (%) (McGillivray et al., 2006; Gries et al., 2009), 𝐌𝟐𝐢𝐭:
The money supply (M2) divided by the interior product gross which measures the financial depth )
(Burnside and Dollar, 2000), 𝐩𝐨𝐩𝐢𝐭: the population growth (annual%) (Ekanayake and Chatrna, 2010) which is a proxy for the labor force related to GDP (%) (McGillivray et al., 2006, Gries et al., 2009),
𝐢𝐧𝐟𝐢𝐭: the Consumer Price Index (McGillivray et al., 2006), 𝛑𝐢𝐭: The term of error 𝛕𝟎: The constant
The estimation of our model goes first by studying the short term relationship between aid and economic
growth. Then we will study the long-term relationship between the two variables by applying the
cointegration test.
3.2. Results
3.2.1. Determination of the number of lags
The choice of the optimum number of lags involves estimating our VAR (p) in order to find the order "p"
between "0" and a certain order, which minimizes the Akaike criteria (AIC) and Schwartz criteria (SC).
So, we estimate our VAR in several models ranging VAR with a ‘0’ lag to ’2’ lags. So we can say that
the number of lags is equal to '2', as shown in the following table:
Table 1: Determination of the number of lags
6
0 -12.17815 -11.90332
1 -28.49764 -26.57386
2 -31.66392* -28.09119*
* indicates lag order selected by the criterion
3.2.2. Long term relationship
In order to study the long-term relationship, we Apply, first, the stationarity test for each variable, which
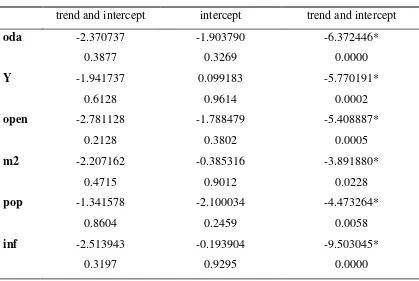
[image:7.595.45.464.343.624.2]is usually manifested by the Unit Root test.
Table 2: Unit root test results
Stationarity in level Stationarity in first
difference
trend and intercept intercept trend and intercept
oda -2.370737 -1.903790 -6.372446*
0.3877 0.3269 0.0000
Y -1.941737 0.099183 -5.770191*
0.6128 0.9614 0.0002
open -2.781128 -1.788479 -5.408887*
0.2128 0.3802 0.0005
m2 -2.207162 -0.385316 -3.891880*
0.4715 0.9012 0.0228
pop -1.341578 -2.100034 -4.473264*
0.8604 0.2459 0.0058
inf -2.513943 -0.193904 -9.503045*
0.3197 0.9295 0.0000
Values in parentheses are probability: * significance at 5%
According to this table all variables are not stationary in level (not for DS). However, there are stationary
in the first difference.
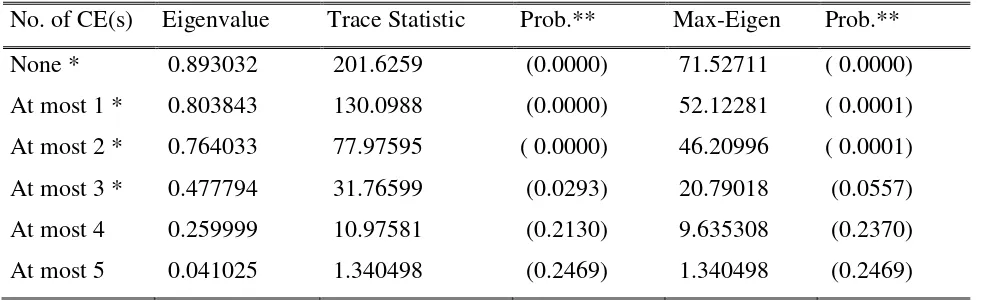
Second, Testing the long-term relationship’s existence or not in our model is based on the Trace
Statisctic and Max-Eigen Statisctic, as shown in the following table:
This is to check the cointegration test of Johansen (1988) based on the criterion of the value of the trace
7
The hypothesis test is formulated as follows:
-If the statistic of the trace is greater than the value criticized then one rejects H0 therefore there exists at
least one cointegration relation.
- If the trace statistic is less than the critiqued value, then H0 is accepted so there is no cointegration
relationship.
For a significance level of 5%, the null hypothesis placing the existence of cointegrating relationship
between the variables of the model is accepted if the value of the trace (TR) is less than the critical value
tabulated. However, if the value of the trace is greater than its critical value, then there is no
cointegration relation between the variables.
[image:8.595.46.547.349.499.2]3.2.3. Test results
Table 3: Cointegration test results
No. of CE(s) Eigenvalue Trace Statistic Prob.** Max-Eigen Prob.**
None * 0.893032 201.6259 (0.0000) 71.52711 ( 0.0000)
At most 1 * 0.803843 130.0988 (0.0000) 52.12281 ( 0.0001)
At most 2 * 0.764033 77.97595 ( 0.0000) 46.20996 ( 0.0001)
At most 3 * 0.477794 31.76599 (0.0293) 20.79018 (0.0557)
At most 4 0.259999 10.97581 (0.2130) 9.635308 (0.2370)
At most 5 0.041025 1.340498 (0.2469) 1.340498 (0.2469)
Trace test indicates 1 cointegratingeqn(s) at the 0.05 level
Max-eigenvalue test indicates 1 cointegratingeqn(s) at the 0.05 level * denotes rejection of the hypothesis at the 0.05 level
**MacKinnon-Haug-Michelis (1999) p-values
We conclude that the trace and the intrinsic value that is below the tabulated value at the 5% level
indicates that there is one (1) cointegration relationship. Given the existence of cointegration
relationship, we can then estimate the vector error correction model (VECM).
3.2.4. Identification of the cointegration relationship
The identification of the cointegration relationship between the variables is shown by the econometric
estimation by LS (Least Square) which tends to assess the true impact of the exogenous variable on the
8
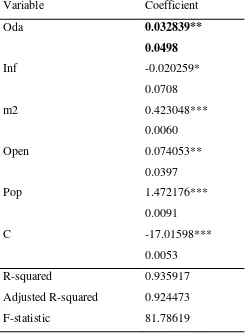
Table 4: OLS model results
Variable Coefficient
Oda 0.032839**
0.0498
Inf -0.020259*
0.0708
m2 0.423048***
0.0060
Open 0.074053**
0.0397
Pop 1.472176***
0.0091
C -17.01598***
0.0053
R-squared 0.935917
Adjusted R-squared 0.924473
F-statistic 81.78619
In Tunisia, ODA is positively and significantly correlated with economic growth. In fact, a 1% increase
in ODA will lead to 0.032839 increase economic growth. This confirms the ideas of Sachs (2004).
3.2.5. Causality test
Table 5: causality test results
Null Hypothesis: Obs F-Statistic Prob.
oda does not cause Y 35 2.79781 0.0769
Y does not cause oda 1.25843 1.88398
By applying the Granger causality test, we can synthesize as shown in the table below that the causal
relationship between economic growth and ODA is unidirectional for the case of Tunisia. Indeed, we
find that the null hypothesis (H0) that "Y" does not cause "ODA" is accepted (probability> 0.05).
However, the null hypothesis (H0) that "apd" does not cause "Y" is rejected at the 5% level, Which
9
This relationship is prejudged because aid flows are intended principally to improve the economic
growth: poverty reduction, improvement of infrastructure, reducing unemployment, increasing
investment...
3.2.6. Estimation VECM model
Table 6: Heteroscedasticity test
Heteroscedasticity Test: Breusch-Pagan-Godfrey
F-statistic 0.368312 Prob. F(3,30) 0.7764
Obs*R-squared 1.207777 Prob. Chi-Square(3) 0.7511
Scaled explained SS 1.120669 Prob. Chi-Square(3) 0.7721
According to the test Breusch-Pagan-Godfrey, 0.7764 the probability is greater than 5%, hence we
[image:10.595.46.405.354.799.2]accept the null hypothesis of homoscedasticity residues or error terms.
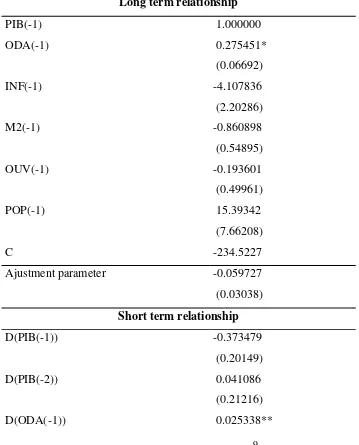
Table 7 : VECM model results
Long term relationship
PIB(-1) 1.000000
ODA(-1) 0.275451*
(0.06692)
INF(-1) -4.107836
(2.20286)
M2(-1) -0.860898
(0.54895)
OUV(-1) -0.193601
(0.49961)
POP(-1) 15.39342
(7.66208)
C -234.5227
Ajustment parameter -0.059727
(0.03038)
Short term relationship
D(PIB(-1)) -0.373479
(0.20149)
D(PIB(-2)) 0.041086
(0.21216)
10
(0.01236)
D(ODA(-2)) 0.002647**
(0.01348)
D(INF(-1)) -0.075371
(0.49292)
D(INF(-2)) -0.568858
(0.51389)
D(M2(-1)) -0.324477
(0.12798)
D(M2(-2)) -0.116756
(0.14921)
D(OUV(-1)) 0.025744*
(0.05895)
D(OUV(-2)) 0.127875*
(0.06450)
D(POP(-1)) -0.326580
(9.02632)
D(POP(-2)) -4.720670
(8.97838)
C 0.142063**
(0.04741)
R-squared 0.616932
Adj. R-squared 0.323997
F-statistic 2.106039
The opening trade (open) is positively and significantly correlated with the economic growth, in the
short-term. This means that in the short term, liberalization will facilitate the transfer of technologies
witch improve the productivity; it therefore has a positive impact on economic growth (Tiba et al
(2015)).
For the others variables (pop, inf) are not significantly correlated with the economic growth in the short
term, so no relationship between these variables and economic growth in the short term.
Therefore, Aid has a positive and significant relationship with economic growth. These findings are in
11
In the long term, only the foreign aid is significantly and positively correlated with the economic
growth. So, a 1% increase in ODA will lead to 0.275451 increase economic growth. These findings are
in line with those of Abd El Hamid Ali. (2013). We can conclude that the effectiveness of aid in terms of
economic growth is more important in the long term than in the short term. In fact the coefficient of
foreign aid is more important in the long run (0.275451) than in the short run (0.032839)
4. Conclusion
Since the existence of the aid to development, multiples discuss are interrogated on its fundamentals and
measures of its impact. Such has been our temptation in full of this work, which has carried on the
countries down returned. It is true that aid can be justified by the need for a policy of redistribution on a
planetarium scale but also aims at fighting poverty.
Burnside and Dollar (1997) showed by the estimation of a model in the data of the panel that the
coefficient "aid * economic policy" is positive and significant. They have finished that aid promotes
growth when combined with sound policies. In addition, Burnside and Dollar (2004), with the interaction
of the aid with the quality of governance measured by the CPIA, have shown the no significativity of the
coefficient of the aid when the variable of interaction is significant. Besides, Easterly,
Levine and Roodman (2003), in an analysis on another worldwide sample, were finding a coefficient
"Aide * political economic" that is negative and not-significant.
To achieve our objective, we used a methodology based on a VECM model applied to the case of
Tunisia. The results of our regression allow us to take a stand on the problem of aid. From a theoretical
point of view, ODA appears to be more effective at increasing economic growth in developing
economies. Our results suggest that aid flows should be aimed at improving and promoting Tunisia’s
economic growth in the short and long term. But, the effectiveness of aid in terms of economic growth is
more important in the long term than in the short term. In fact the coefficient of foreign aid is more
important in the long run (0.275451) than in the short run (0.032839).
References
1) Abd El Hamid Ali. H (2013). “Foreign Aid and Economic Growth in Egypt: A Cointegration
Analysis” International Journal of Economics and Financial Issues 3, 743-751
2) Alesina, A& Dollar. D (2000). “Who Gives Foreign Aid to Whom and Why?”, Journal of
12
3) Amprou. J & Chauvet. L(2007). “ Débats sur l’efficacité de l’aide: fondements et nouveaux
enjeux” , Document de travail AFD.
4) Amprou. J & Chauvet cave, L. (2007). “Debates on the effectiveness of aid: foundations and new
challenges", Working Document of AFD.
5) Arndt. C and Jones. S, (2015) “Assessing Foreign Aid’s Long-Run Contribution to Growth and
Development”,World Development 69, 6–18
6) BanqueMondiale(1998). “Assessing Aid: What Works, What Doesn’t and Why”, World Bank
Policy Research Report, Oxford University Press, Oxford.
7) Burnside, C &Dollar.D (1997).“Aid, Policies, and Growth”, Policy Research Working paper No.
1777,
8) Burnside. C & Dollar.D (2004).“Aid, Policies and Growth: A Reply”, American Economic
Review, 94 (3), 781-784.
9) Burnside. C & Dollar.D (2000), “Aid, Policy and Growth”. American Economic Review, 90 (4),
847-868
10)CHATTI, O. (2010). “Gouvernance et croissance économique”, Centre d’Etudes en
Macroéconomie et Finance Internationale de l’UNIVERSITE DE NICE SOPHIA-ANTIPOLIS.
11)Collier, P&Dehn, J. (2001). “Aid, Shocks, and Growth.” Working Paper, World Bank No. 2688.
12)Collier, P&Dollar, D. (2002). “Aid Allocation and Poverty Reduction.” European Economic
Review 46 (8): 1475–1500.
13)Collier, P&Hoeffler, A. (2002) “Greed and Grievances in Civil Wars”,Center for the Study of
13
14)Collier. P&J. Dehn (2001). “Aid, Shocks and Growth”, World Bank, Development Research
Group, Washington D.C.
15)Do, QuyToan& Lakshmi Iyer (2003). "Land Rights and Economic Development: Evidence from
Viet Nam", World Bank Working Paper No. 3120.
16)Easterly W.; Levine R.;&Roodman, D. (2004). “New Data, New Doubts: A Comment on
Burnside and Dollar’s ‘Aid, Policies, and Growth”, American Economic Review 94 (3): 774–80.
17)Easterly, W., R. Levine &D. Roodman (2003). “New Data, New Doubts: Revisiting ‘Aid,
Policies and Growth’, CGD Working Paper No. 26, June 2003, Centre for Global Development,
Washington, D.C. (forthcoming American Economic Review).
18)Easterly, William (2001). “The Elusive Quest for Growth: Economists’ Adventures and
Misadventures in the Tropics” MIT Press Easterly, William and Stanley Fischer (2001) "Inflation and the Poor”, Journal of Money, Credit and Banking, Ohio State University Press, vol. 33(2),
pages 160-78.
19)Easterly, William (2003) “Can Foreign Aid Buy Growth?” Journal of Economic Perspectives 17
(3): 23-48.
20)GUILLAUMONT, P. (2000). “Making Aid More Effective in Reducing Poverty: Comment”, in
Governance, Equity and Global Markets, Proceedings of the Annual Bank Conference on
Development Economics in Europe, La Documentation Française, Paris.
21)GUILLAUMONT, P. (2001). “On the Economic Vulnerability of Low Income Countries”,
Etudes et Documents E 2001.02, CERDI, Clermont-Ferrand.
22)GUILLAUMONT, P. (2004). “ Juger de la sélectivité de l’aide : de meilleures évaluations sont
14
23)Joseph E. Stiglitz (2002). “Globalization and Its Discontents”, Economic Notes, 32(1):123-142
24)Moolio. P et Kong. S, (2016). “Foreign Aid and Economic Growth: Panel Cointegration Analysis
for Cambodia, Lao PDR, Myanmar, and Vietnam”, Athens Journal of Business and Economics 2
(4), 417-128
25)Mosley P., (1980). “Aid, Savings and Growth Revisited”, Oxford Bulletin of Economics and
Statistics 42(2), 79-95.
26)Resnick, D; Birner, R. (2005). “ Does good governance contribute to pro-poor growth?: a
conceptual framework and empirical evidence from cross-country studies”, Proceedings of the
German Development Economics Conference, Kiel 2005 5, Vereinfür Social politik, Research
Committee Development Economics
27)SACHS, J. (2004).“Ending Africa’s Poverty Trap”, Brookings Papers on Economic Activity 204
(1), pp. 117-240.
28)Sachs, J.; McArthur, J. W.; Schmidt-Traub, G.; Kruk, M.; Bahadur, C.; Faye, M.; and McCord,
G. (2004). “Ending Africa’s Poverty Trap.” Brookings Papers on Economic Activity, No. 1: 117–
240.
29)Sachs, Jeffrey and Andrew Warner (2001).“The Curse of Natural Resources,” European
Economic Review, 45, 827-838.
30)Tiba, S, Omri and Frikha, M. (2015).”The four way linkage between renewable energy
environmental quality, trade and economic growth: a comparative analysis between high and
middle-income countries”, Energy Systems 7, 103-144.
31)World Bank (2003). “World Development Report 2003, Sustainable Development in a Dynamic
World: Transforming Institutions, Growth, and the Quality of Life”, (New York: Oxford
15
32)World Bank. (1998). “Assessing Aid: What Works, What Doesn't and Why”, World Bank Policy