Munich Personal RePEc Archive
Economic Development Thresholds for a
Green Economy in Sub-Saharan Africa
Asongu, Simplice and Odhiambo, Nicholas
January 2019
Online at
https://mpra.ub.uni-muenchen.de/93534/
1
A G D I Working Paper
WP/19/010
Economic Development Thresholds for a Green Economy in Sub-Saharan
Africa
1Forthcoming: Energy Exploration & Exploitation
Simplice A. Asongu
Department of Economics, University of South Africa. P. O. Box 392, UNISA 0003, Pretoria South Africa.
E-mails: asongusimplice@yahoo.com, asongus@afridev.org
Nicholas M. Odhiambo
Department of Economics, University of South Africa. P. O. Box 392, UNISA 0003, Pretoria, South Africa.
Emails: odhianm@unisa.ac.za, nmbaya99@yahoo.com
1
2
2019 African Governance and Development Institute WP/19/010
Research Department
Economic Development Thresholds for a Green Economy in Sub-Saharan Africa
Simplice A. Asongu & Nicholas M. Odhiambo
January 2019
Abstract
This study investigates how increasing economic development affects the green economy in
terms of CO2 emissions, using data from 44 countries in the SSA for the period 2000-2012.
The Generalised Method of Moments (GMM) is used for the empirical analysis. The
following main findings are established. First, relative to CO2 emissions, enhancing economic
growth and population growth engenders a U-shaped pattern whereas increasing inclusive
human development shows a Kuznets curve. Second, increasing GDP growth beyond 25% of
annual growth is unfavorable for a green economy. Third, a population growth rate of above
3.089% (i.e. annual %) has a positive effect of CO2 emissions. Fourth, an inequality-adjusted
human development index (IHDI) of above 0.4969 is beneficial for a green economy because
it is associated with a reduction in CO2 emissions. The established critical masses have policy
relevance because they are situated within the policy ranges of adopted economic
development dynamics.
JEL Classification: C52; O38; O40; O55; P37
3
1. Introduction
What thresholds of economic development are associated with reversals in carbon dioxide
(CO2) emissions in sub-Saharan Africa (SSA)? The positioning of this study on thresholds of
economic development for a green economy in sub-Saharan Africa (SSA) is motivated by two
main factors in scholarly and policy-making circles, notably: the relevance of the green
economy in the post-2015 development agenda and gaps in the extant literature
First, the green economy is a central theme in sustainable development goals (SDGs)
because, inter alia, greenhouse gas emissions are a great challenge to the sustainability of the
global environment in the post-2015 development agenda (Shaw & Bachu, 2012; Collett,
2012; Akinyemi et al., 2015; Akpan et al., 2015; Mbah & Nzeadibe, 2016; Asongu et al.,
2016a; Rui et al., 2017; Efobi et al., 2018; Akinyemi et al., 2018). Moreover, as documented
by Asongu (2018a), the consequences of global warming are most detrimental to countries in
Africa for numerous reasons, notably: (i) rampant crises in environmental pollution,
persistence in energy crisis and (ii) the ramifications of mismanagement of energy across the
continent. These fundamental factors are explained in elaborate detail in the following
passages.
On the front of mismanagement, consistent with the attendant literature (Anyangwe,
2014; Odhiambo, 2010, 2014a; Asongu et al., 2017, 2018), the energy sector of many
countries in SSA is not being managed properly, especially when it pertains to less investment
in renewable energy and more allocation of funds to the subsidisation of fossil fuels. It is
worthwhile to emphasise that economic prosperity in the lasttwo centuries has been
fundamentally reliant on energy availability which is indispensible for economic processes,
inter alia: production, distribution and consumption activities (Odhiambo, 2009a, 2009b,
2014b). One very glaring case of the inability of policy makers to come up with effective
renewable energy policies is the case of Nigeria where instead of promoting sustainable
energy sources, fossil fuels are subsidised (Apkan & Apkan, 2012).
Concerning the persistence of CO2, whereas these emissions makeup about 75% of
global greenhouse emissions (Akpan & Akpan, 2012), there are many accounts that are in
accordance with the view that the unfavorable ramifications of climate change will be most
apparent in SSA (Shurig, 2015; Kifle, 2008; Asongu, 2018b). Accordingly, this change of
4
et al., 2015). Moreover, approximately 620 million of inhabitants in SSA (which represents
about two-thirds of the population) lack access to electricity (World Energy Outlook 2014
Factsheet). This substantially contrasts with the growing demand for energy in the sub-region
which: (i) represents about 4% of the global demand and (ii) increased by approximately 45%
during the period 2000-2012 (World Energy Outlook 2014 Factsheet).
Second, the extant literature on linkages between the consumption of energy, CO2
emissions and development outcomes can be classified in two main categories: while the first
emphasises the relationships between environmental degradation and economic growth, the
second strand is concerned with associations between energy consumption and economic
development. Two sub-strands are apparent in the second strand, notably: (i) research
focusing on linkages between energy consumption and economic development (Jumbe, 2004;
Ang, 2007; Apergis & Payne, 2009; Odhiambo, 2009a, 2009b; Ozturk & Acaravci, 2010;
Menyah & Wolde-Rufael, 2010; Bölük & Mehmet, 2015; Begum et al., 2015) and enquires
into relationships between energy consumption, environmental degradation and economic
prosperity (Mehrara, 2007; Olusegun, 2008; Akinlo, 2008; Esso, 2010).
The second strand which is more related to the positioning of this research underlines
the investigation of the Environmental Kuznets Curve (EKC)2 hypothesis (Diao et al., 2009;
Akbostanci et al., 2009; He & Richard, 2010). The attendant literature pertaining to the EKC
has largely focused on the nexus between environmental degradation and per capita income.
This research departs from the underlying literature on two fronts. On the one hand, we
contribute to the EKC literature by investigating the relationship between environmental
degradation and economic development using three outcome variables, namely: economic
growth, population growth and inclusive human development. This study departs from the
engaged contemporary literature which has largely focused on two factors: income and
environmental degradation. On the other hand, this study argues that simply assessing the
EKC hypothesis is not enough for policy-making initiatives. For instance, rejecting or
confirming evidence of an EKC is less relevant to policy than establishing specific policy
thresholds that policy makers can act upon to address concerns pertaining to environmental
degradation. Accordingly, providing policy makers with a specific critical mass at which
2
5
more economic growth or population growth is detrimental to the environment is more
informative than simply confirming the existence or not, of an EKC. Moreover, in the light of
the post-2015 development agenda which is particularly focused on inclusive human
development, providing a specific human development critical mass that drives the green
economy is more informative and relevant to policy makers. Therefore, the policy relevance
of the study is in line with scholarly recommendations for a green revolution (Pingali, 2012).
While the theoretical underpinning of the EKC hypothesis has been substantially
documented in the literature (Diao et al., 2009; Akbostanci et al., 2009; He & Richard, 2010),
the theory-building contribution of this study relates to the establishment of specific
thresholds at which macroeconomic outcomes can either positively or negatively influence
environmental degradation. Hence, while this study builds on an established EKC hypothesis,
it also advances knowledge within the perspective that it informs policy makers on thresholds
pertaining to the EKC. The applied econometrics framework is consistent with the literature
supporting the view that applied econometrics should not be exclusively limited to studies
designed to either accept or reject existing theories and established hypotheses (Narayan et
al., 2011; Asongu & Nwachukwu, 2016a).
The remainder of the study is organised as follows. The data and methodology are
discussed in section 2 while the empirical results are covered in section 3. Section 4 concludes
with implications and future research directions.
2. Data and methodology
2.1 Data
The study focuses on the 44 nations in the SSA region for the period 2000-20123
with data
from three main sources, namely: (i) the World Development Indicators of the World Bank
for the dependent variable (i.e. CO2 emissions), two independent variables of interest (i.e.
economic growth and population growth) and a control variable (education quality); (ii) the
3The 44 countries are: “
6
World Governance Indicators of the World Bank for the control variable (i.e. regulatory
quality) and (iii) the United Nations Development Programme (UNDP) for an independent
variable of interest (i.e. the inequality-adjusted human development index). The geographical
and temporal scopes of the study are contingent on data availability constraints at the time of
the study.
The adopted CO2 emissions per capita variable, as a proxy for environmental
degradation is in accordance with Asongu (2018a), while the use of the inequality-adjusted
human development index (IHDI) to proxy for inclusive human development is consistent
with recent inclusive human development literature in Africa (Asongu et al., 2015; Asongu &
Nwachukwu, 2017a). According to the underlying literature, the human development index
(HDI) denotes the average of achievements in three main areas, namely: (i) basic standard of
living, (ii) knowledge and (iii) health and long life. Furthermore, the IHDI is the human
development (HDI) that is adjusted to the equitable distribution of the three main
achievements. Hence, the IHDI is the HDI that has been adjusted for inequality.
In the light of the motivation of this study, the three economic development variables
are: economic growth in the perspective to Gross Domestic Product (GDP) growth rate; the
population growth rate and the IHDI discussed in the preceding paragraph. In order to limit
issues pertaining to variable omission bias, two control variables are defined in the
conditioning information set, namely: education quality and regulation quality. The control
variables which are in line with recent CO2 emissions literature (Asongu, 2018b), are
restricted to two because upon a pilot empirical investigation, it was apparent that focusing on
more than two control variables generates concerns of instrument proliferation and
over-identification. This procedure of adopting limited control variables in the generalized method
of moments (GMM) approach (in order to avoid invalid models that do not pass
post-estimation diagnostic tests) is not uncommon in the empirical literature. In essence, there is an
abundant supply of GMM literature that has used limited control variables, notably: (i) zero
control variable (Osabuohien & Efobi, 2013; Asongu & Nwachukwu, 2017b) and (ii) two
control variables (Bruno et al., 2012).
Concerning the anticipated signs, while both variables are expected to significantly
influence the outcome variable, the expected effects on the dependent variable may also be
7
regulation quality should naturally reduce CO2 emissions, the effectiveness of such regulation
is contingent on the feasible implementation of adopted policies. It is worthwhile to emphasis
that the regulation quality variable is negatively and positively skewed. Hence, an
overwhelmingly negative skew can weigh unfavourably on the expected sign. The relevance
of primary education in countries at initial levels of industrialisation is consistent with the
attendant literature on the relative importance of this education level (i.e. compared to higher
education levels) in development outcomes (Petrakis & Stamakis, 2002; Asiedu, 2014;
Asongu & le Roux, 2017; Asongu & Odhiambo, 2018a).
2.2 Methodology
2.2.1 GMM: Specification, identification and exclusion restrictions
This study adopts the Generalised Method of Moments (GMM) approach to empirical
investigation for four main reasons. First, a baseline requirement is that the number of cross
sections should be higher than the corresponding number of periods in each cross section.
This is the case in our study which is focusing on 44 countries with data points from 2004 to
2014. Therefore, the N (or 48) > T(or 11) primary condition is satisfied. Second, the
environmental degradation variable is persistent given that the correlation between the level
values and first difference (i.e. 0.9945) is higher than 0.800 which has been established to be
the threshold for determining persistence (Tchamyou, 2019a, 2019b). Third, owing to the
panel structure of the dataset, it is apparent that cross-country variations are taken into
account in the estimations. Fourth, the concern of endogeneity is tackled from two main
perspectives. On the one hand, reverse causality, or simultaneity, is addressed with the help of
an instrumentation process. On the other hand, the unobserved heterogeneity is accounted for
with the help of time-invariant variables.
The GMM strategy is the Roodman (2009a, 2009b) extension of Arellano and Bover
(1995) which has been documented in contemporary literature to restrict instrument
proliferation with an option that collapses instruments (Asongu & Nwachukwu, 2016b;
Boateng et al., 2018; Tchamyou et al., 2019).
The following equations in level (1) and first difference (2) summarise the standard system
8 t i t i t i h h h t i t i t i t
i CO ED EDED W
CO ,, ,
2 1 , 3 , 2 , 1 0 ,
(1)) ( ) ( ) ( ) ( ) ( ) ( , , 2 , , , , 2 1 , , 3 , , 2 2 , , 1 , ,
hit hit t t it ith h t i t i t i t i t i t i t i t i W W EDED EDED ED ED CO CO CO CO (2)
where,COi,tis the carbon dioxide emission variableof country iin period t, 0is a constant,
ED entails economic development (GDP growth, population growth and inclusive development), EDED denotes quadratic interactions between economic development
indicators (“GDP growth” × “GDP growth”, “population growth” × “population growth” and
“inclusive development” × “inclusive development”), W is the vector of control variables
(education quality and regulation quality), represents the coefficient of auto-regression
which is one within the framework of this study because a year lag is enough to capture past
information, tis the time-specific constant,iis the country-specific effect and i,t the error
term.
2.2.2Identification and exclusion restrictions
We now devote space to clarifying identification properties and corresponding
exclusion restrictions because they are paramount to a robust GMM specification. In
accordance with the underlying literature (Asongu & Nwachukwu, 2016c; Tchamyou &
Asongu, 2017; Tchamyou et al., 2019; Boateng et al., 2018), the time invariant variables
adopted, are defined as strictly exogenous whereas all explanatory variables are
acknowledged as “suspected endogenous” or predetermined. The intuition underlying this
identification strategy is in accordance with Roodman (2009b) who has documented that it is
not very probable for the suggested time invariant indicators to be first-differenced
endogenous4.
Given the discussed identification strategy, the exclusion restriction assumption is
investigated by assessing if the identified strictly exogenous indicator affects CO2 emissions
4
9
exclusively via the suggested endogenous explaining variable mechanisms. The criterion used
to assess the validity of this exclusion restriction is the Difference in Hansen Test (DHT). The
null hypothesis of this test is the position that the identified strictly exogenous variable does
not affect the CO2 emission variables beyond the engaged endogenous explaining variables.
Hence, we expect the null hypothesis not to be rejected for the exclusion restriction
assumption to hold. This expectation is consistent with the standard instrumental variable
approach in which the rejection of the null hypothesis of the Sargan Overidentifying
Restrictions (OIR) test indicates that the proposed instruments explain the outcome variable
beyond the proposed channels or endogenous explaining mechanisms (Beck et al., 2003;
Asongu & Nwachukwu, 2016d).
3. Empirical results
3.1 Presentation of results
The empirical results are disclosed in Table 1. There are three main sets of specifications
pertaining to each of the economic development variables. Each specific economic
development variable is associated with three main specifications. From the left-hand to the
right-hand side, the variables in the conditioning information set are increased. Accordingly,
the first specification does not include a control variable; the middle specification entails a
control variable while the last specification is associated with two control variables. In the
light of the explanation in the data section, not involving control variables in the GMM
specification is acceptable in the empirical literature. Hence, the step-wise approach of
involving control variables can be tacitly considered as a robustness check procedure.
In the light of the identification strategy and corresponding discussion on exclusion
restrictions in the preceding section, four main criteria are used to investigate the
post-estimation validity of the GMM findings5. Building on these criteria, it is apparent that all
estimated models pass the post-estimation diagnostic tests.
5“
10
In order to investigate the overall effect of increasing economic development on
environmental degradation, net effects are computed in accordance with contemporary
literature on the interactive (Tchamyou & Asongu, 2017; Tchamyou, 2019b; Agoba et al.,
2019) and quadratic (Asongu & Odhiambo, 2019) regressions. The corresponding net effects
consist of both the unconditional effects and the marginal effects from the association
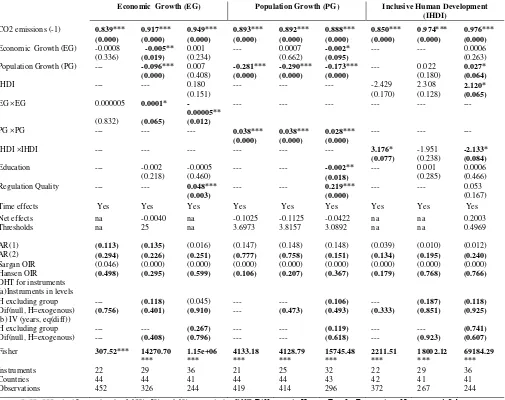
interactions. For example in the third column of Table 1, the net effect of enhancing economic
growth is -0.0040 (2×[0.0001× 4.801] + [-0.005]). In this calculation, the average value of
economic growth is 4.801, the marginal effect of economic growth in CO2 emissions is
0.0001 while the unconditional effect of economic growth is -0.005. The leading 2 on the first
term is from the differentiation of the quadratic term.
In the light of the same computational analogy, in the last column of the table, the net
effect derived from enhancing inclusive human development is 0.2003 (2×[-2.133× 0.450] +
[2.120]). In this calculation, the mean value of inclusive human development is 0.450, the
unconditional effect is 2.120 while the marginal effect is -2.133. Accordingly, the leading 2
on the first term is from the differentiation of the quadratic term.
The following findings can be established from Table 1. The significant control
variables have the expected signs. Enhancing economic growth and population growth both
have net negative effects on CO2 emissions while enhancing inclusive human development
has an overall net positive effect on the CO2 emissions. While from the perspective of net
effect, the finding on inclusive human development is unanticipated, the corresponding
negative marginal effect implies that increasing inclusive human development decreases the
positive unconditional effect up to a certain threshold. Hence, the negative net effect can be
neutralised at a specific threshold of inclusive human development. The attendant policy
thresholds are established in the next section.
Hansen Test (DHT) for exogeneity of instruments is also employed to assess the validity of results from the Hansen OIR test.
11
Table 1: Empirical results
Dependent variable: CO2 emissions per capita
Economic Growth (EG) Population Growth (PG) Inclusive Human Development (IHDI)
CO2 emissions (-1) 0.839*** 0.917*** 0.949*** 0.893*** 0.892*** 0.888*** 0.850*** 0.974*** 0.976*** (0.000) (0.000) (0.000) (0.000) (0.000) (0.000) (0.000) (0.000) (0.000)
Economic Growth (EG) -0.0008 -0.005** 0.001 --- 0.0007 -0.002* --- --- 0.0006 (0.336) (0.019) (0.234) (0.662) (0.095) (0.263) Population Growth (PG) --- -0.096*** 0.007 -0.281*** -0.290*** -0.173*** --- 0.022 0.027*
(0.000) (0.408) (0.000) (0.000) (0.000) (0.180) (0.064)
IHDI --- --- 0.180 --- --- --- -2.429 2.308 2.120*
(0.151) (0.170) (0.128) (0.065)
EG ×EG 0.000005 0.0001* -0.00005**
--- --- --- --- --- --- (0.832) (0.065) (0.012)
PG ×PG --- --- --- 0.038*** 0.038*** 0.028*** --- --- ---
(0.000) (0.000) (0.000)
IHDI ×IHDI --- --- --- --- --- --- 3.176* -1.951 -2.133* (0.077) (0.238) (0.084)
Education --- -0.002 -0.0005 --- --- -0.002** --- 0.001 0.0006 (0.218) (0.460) (0.018) (0.285) (0.466) Regulation Quality --- --- 0.048*** --- --- 0.219*** --- --- 0.053
(0.003) (0.000) (0.167)
Time effects Yes Yes Yes Yes Yes Yes Yes Yes Yes Net effects na -0.0040 na -0.1025 -0.1125 -0.0422 na na 0.2003 Thresholds na 25 na 3.6973 3.8157 3.0892 na na 0.4969 AR(1) (0.113) (0.135) (0.016) (0.147) (0.148) (0.148) (0.039) (0.010) (0.012) AR(2) (0.294) (0.226) (0.251) (0.777) (0.758) (0.151) (0.134) (0.195) (0.240)
Sargan OIR (0.046) (0.000) (0.000) (0.000) (0.000) (0.000) (0.000) (0.000) (0.000) Hansen OIR (0.498) (0.295) (0.599) (0.106) (0.207) (0.367) (0.179) (0.768) (0.766)
DHT for instruments (a)Instruments in levels
H excluding group --- (0.118) (0.045) --- --- (0.106) --- (0.187) (0.118)
Dif(null, H=exogenous) (0.756) (0.401) (0.910) --- (0.473) (0.493) (0.333) (0.851) (0.925)
(b) IV (years, eq(diff))
H excluding group --- --- (0.267) --- --- (0.119) --- --- (0.741)
Dif(null, H=exogenous) --- (0.408) (0.796) --- --- (0.618) --- (0.923) (0.607)
Fisher 307.52*** 14270.70 *** 1.15e+06 *** 4133.18 *** 4128.79 *** 15745.48 *** 2211.51 *** 18002.12 *** 69184.29 ***
Instruments 22 29 36 21 25 32 22 29 36 Countries 44 44 41 44 44 43 42 41 41 Observations 452 326 244 419 414 296 372 267 244
*, **, ***: significance levels of 10%, 5% and 1% respectively. DHT: Difference in Hansen Test for Exogeneity of Instruments’ Subsets.
Dif: Difference. OIR: Over-identifying Restrictions Test. The significance of bold values is twofold. 1) The significance of estimated coefficients, Hausman test and the Fisher statistics. 2) The failure to reject the null hypotheses of: a) no autocorrelation in the AR(1)andAR(2)
tests and; b) the validity of the instruments in the Sargan OIR test. na: not applicable because at least one estimated coefficient needed for the computation of net effects is not significant. The mean value of GDP growth, population growth and inclusive development are respectively, 4.801, 2.335 and 0.450. Constants are included in the regressions.
3.2 Extension with policy thresholds
In the light of the motivation and positioning of this study with respect to the extant
literature (which is covered in the introduction), this section engages the policy thresholds and
by extension, policy implications of the study. The computations of the thresholds are also
substantiated with the attendant literature on thresholds that are relevant for more targeted
12
Given the problem statement motivating this study, it is not enough to stop at
establishing overall net effects on CO2 emissions from improving economic development.
Hence, we move a step further by computing thresholds related to the marginal effects. For
instance, the unconditional and conditional effects from increasing economic growth and
population growth are respectively, negative and positive whereas the unconditional and
conditional impacts from enhancing inclusive human development are respectively, positive
and negative. Therefore, in the light of the attendant positive marginal effects from economic
growth and population growth, an extended analysis can be made to assess at what specific
thresholds or critical masses the positive marginal or conditional effects completely crowd-out
the negative unconditional effects. It follows that at a specific economic development
threshold, further increasing economic growth, or population growth, increases CO2
emissions. This is also translated as a U-shaped pattern. The narrative is the opposite for the
relationship between inclusive human development and CO2 emissions: a Kuznets shape
pattern.
It is also relevant to emphasise that the underlying thresholds are critical masses of
economic development at which the net effect on CO2 emissions is completely nullified.
However, in order for these thresholds to be economically relevant and make policy sense,
they should be situated between the minimum and maximum values disclosed in the summary
statistics. Hence, the policy relevance of the thresholds to be computed is contingent on
whether policy actions with the established thresholds are feasible. This feasibility exclusively
relies on whether the thresholds are consistent with the data underpinning the empirical
exercise. This conception and definition of threshold conforms to the extant literature on the
subject, notably: thresholds for favourable results that are relevant to policy makers (Batuo,
2015; Asongu & Odhiambo, 2018b; Asongu et al., 2019); conditions for Kuznets and U
shapes (Ashraf & Galor, 2013) and CO2 emission thresholds that are detrimental to inclusive
development (Asongu, 2018a).
In Table 1, the positive threshold in the second column is 25 (0.005/ [2×0.0001]).
Hence, at 25% of GDP growth rate (i.e. annual %), GDP growth increases CO2 emissions, or
is detrimental to a green economy. In the same vein, a population growth rate of above
3.089% (i.e. annual %) has a positive effect on CO2 emissions. Moreover, following the same
analogy, an IHDI of 0.496 is the critical mass from which inclusive development decreases
13
order to benefit from the relevance of the inclusive development in promoting the green
economy.
The above thresholds have economic relevance and can be applied by policy makers
because they are within the policy ranges disclosed in the summary statistics, notably:
“-32.832 to 33.735”, “-1.081 to 6.576” and “0.219 to 0.768” for respectively, GDP growth,
population growth and inclusive development.
4. Conclusion and future research directions
This study has investigated how increasing economic development affects the green economy
in terms of CO2 emissions, using data from 44 countries in the SSA region for the period
2000-2012. The Generalised Method of Moments (GMM) is used for the empirical analysis.
The following main findings are established. First, enhancing economic growth and
population growth both have net negative effects on CO2 emissions while improving
inclusive human development has an overall net positive effect on the CO2 emissions.
Second, there is a U-shape pattern between two indicators of economic development (i.e.
economic growth and population growth) and CO2 emissions, while there is a Kuznets nexus
between inclusive human development and CO2 emissions.
Third, when the analysis is extended to establish thresholds, the following findings are also
established. (i) Increasing GDP growth beyond 25% of annual growth is unfavorable for a
green economy; (ii) a population growth rate of above 3.089% (i.e. annual %) has a positive
effect on CO2 emissions and (iii) an inequality-adjusted human development index (IHDI) of
above 0.496 is beneficial for a green economy because it is associated with a reduction in
CO2 emissions. The established critical masses have policy relevance because they are
situated within the policy ranges of economic growth, population growth and inclusive human
development.
It will be relevant to investigate whether the established linkages in this study can
withstand empirical scrutiny when specific studies are involved. These
country-specific cases are important because in the modelling of the GMM, country-country-specific impacts
14
Appendices
Appendix 1: Definitions of variables
Variables Signs Definitions of variables (Measurements) Sources
CO2 per capita CO2mtpc CO2 emissions (metric tons per capita) World Bank
(WDI) GDP growth GDPg Gross Domestic Product (GDP) growth (annual %) World Bank
(WDI) Population
growth
Popg Population growth rate (annual %) World Bank (WDI) Inclusive
development
IHDI Inequality-Adjusted Human Development Index UNDP
Educational Quality
Educ Pupil teacher ratio in Primary Education World Bank (WDI)
Regulation Quality
RQ
“Regulation quality (estimate): measured as the
ability
of the government to formulate and implement sound
policies and regulations that permit and promote private
sector development”
World Bank (WDI)
WDI: World Bank Development Indicators. UNDP: United Nations Development Program.
Appendix 2: Summary statistics (2000-2012)
Mean SD Minimum Maximum Observations
CO2 per capita 0.911 1.842 0.016 10.093 532
GDP growth 4.801 5.054 -32.832 33.735 530 Population growth 2.335 0.876 -1.081 6.576 495 Inclusive development 0.450 0.110 0.219 0.768 431 Educational Quality 43.892 14.775 12.466 100.236 397 Regulation Quality -0.604 0.542 -2.110 0.983 496
S.D: Standard Deviation.
Appendix 3: Correlation matrix (uniform sample size: 283)
CO2mtpc GDPg Popg IHDI Educ RQ
CO2mtpc 1.000
GDPg 0.011 1.000
Popg -0.574 0.208 1.000
IHDI 0.640 -0.092 -0.611 1.000
Educ -0.449 0.106 0.363 -0.524 1.000
RQ 0.401 -0.144 -0.279 0.536 -0.330 1.000
15
References
Agoba, A. M., Abor, J., Osei, K. A., & Sa-Aadu, J. (2019). Do independent Central Banks Exhibit Varied Bahaviour in Election and Non-Election Years: The Case of Fiscal Policy in Africa. Journal of African Business: Forthcoming.
Akbostanci, E., S. Turut-Asi & Tunc, G. I., (2009). “The Relationship between Income and
Environment in Turkey: Is there an Environmental Kuznets Curve?”, Energy Policy, 37(3),
pp. 861-867.
Akinlo, A. E., (2008). “Energy consumption and economic growth: evidence from 11 Sub
-Sahara African countries”. Energy Economics, 30(5), pp. 2391-2400.
Akinyemi, O., Alege, P., Osabuohien, E., & Ogundipe, A., (2015). “Energy Security and the Green Growth Agenda in Africa: Exploring Trade-offs and Synergies”, Department of Economics and Development Studies, Covenant University, Nigeria.
Akinyemi, O., Efobi, U., Asongu, S., & Osabuohien, E., (2018). “Green Growth Strategy and Trade Performance in sub-Saharan Africa”, Department of Economics and Development Studies, Covenant University, Nigeria.
Akpan, G. E. & Akpan, U. F. (2012). “Electricity Consumption, Carbon Emissions and
Economic Growth in Nigeria”, International Journal of Energy Economics and Policy, 2(4),
pp. 292-306.
Akpan, U., Green, O., Bhattacharyya, S., & Isihak, S., (2015). “Effect of Technology Change
on CO2 Emissions in Japan’s Industrial Sectors in the period 1995-2005: An Input-Output
Structural Decomposition Analysis”, Environmental and Resources Economics, 61(2), pp.
165-189.
Ang, J. B. (2007). “CO2 emissions, energy consumption, and output in France”, Energy
Policy, 35(10), pp. 4772-4778.
Anyangwe, E. (2014). “Without energy could Africa’s growth run out of steam?”
theguardian,
http://www.theguardian.com/global-development-professionals-network/2014/nov/24/energy-infrastructure-clean-cookstoves-africa(Accessed: 08/09/2015).
Apergis, N. & J. Payne, J. E., (2009). “CO2 emissions, energy usage, and output in Central
America”, Energy Policy, 37(8), pp. 3282-3286.
Arellano, M., & Bover, O., (1995), “Another look at the instrumental variable estimation of
error components models”, Journal of Econometrics, 68(1), pp. 29-52.
Asiedu, E., (2014). “Does Foreign Aid in Education Promote Economic Growth? Evidence
From Sub-Saharan Africa”, Journal of African Development, 16(1), pp. 37-59.
Ashraf, Q., & Galor, O., (2013). “The Out of Africa Hypothesis, Human Genetic Diversity,
16
Asongu, S. A., (2018a). “CO2 emission thresholds for inclusive human development in sub-Saharan Africa”, Environmental Science and Pollution Research, 25(26), pp.26005-26019.
Asongu, S. A., (2018b). “ICT, Openness and CO2 emissions in Africa”, Environmental
Science and Pollution Research, 25(10), pp. 9351-9359.
Asongu, S. A., Efobi, U., & Beecroft, I., (2015). “Inclusive Human Development in Pre-Crisis Times of Globalisation-Driven Debts”, African Development Review, 27(4), pp. 428-442.
Asongu S. A. & De Moor, L., (2017). “Financial globalisation dynamic thresholds for
financial development: evidence from Africa”, European Journal of Development Research,
29(1), pp. 192–212.
Asongu, S. A., El Montasser, G., & Toumi, H., (2016a). “Testing the relationships between energy consumption, CO2 emissions, and economic growth in 24 African countries: a panel
ARDL approach”, Environmental Science and Pollution Research, 23(7), pp.6563–6573.
Asongu, S. A., & le Roux, S., (2017). “Enhancing ICT for inclusive human development in
Sub-Saharan Africa”, Technological Forecasting and Social Change, 118(May), pp. 44–54.
Asongu, S. A., le Roux, S.,, & Biekpe, N., (2017). “Environmental degradation, ICT and inclusive development in Sub-Saharan Africa”, Energy Policy, 111(December), pp. 353-361.
Asongu, S. A., le Roux, S.,& Biekpe, N., (2018). “Enhancing ICT for environmental sustainability in sub-Saharan Africa”, Technological Forecasting and Social Change, 127(February), pp. 209-216.
Asongu, S. A., le Roux, S.,& Tchamyou, V. S., (2019). “Essential information sharing thresholds for reducing market power in financial access: a study of the African banking industry”, Journal of Banking Regulation. DOI: 10.1057/s41261-018-0065-4.
Asongu, S. A., & Nwachukwu, J. C., (2016a). “Revolution empirics: predicting the Arab
Spring”, Empirical Economics, 51(2), pp. 439-482.
Asongu, S. A., & Nwachukwu, J. C., (2016b). “The Role of Governance in Mobile Phones for Inclusive Human Development in Sub-Saharan Africa”, Technovation, 55-56 (September- October), pp. 1-13.
Asongu, S. A., & Nwachukwu, J. C., (2016c). “The Role of Governance in Mobile Phones for Inclusive Human Development in Sub-Saharan Africa”, Technovation, 55-56 (September-October), pp. 1-13.
Asongu, S. A, & Nwachukwu, J. C., (2016d). “Foreign aid and governance in Africa”,
International Review of Applied Economics, 30(1), pp. 69-88.
Asongu, S. A., & Nwachukwu, J. C., (2017a). “The Comparative Inclusive Human
17
Asongu, S. A., & Nwachukwu, J. C., (2017b).“ Foreign Aid and Inclusive Development: Updated Evidence from Africa, 2005–2012”, Social Science Quarterly, 98(1), pp. 282-298.
Asongu, S. A., &Odhiambo, N. M., (2018a). “Basic Formal Education Quality, Information Technology and Inclusive Human Development in Sub-Saharan Africa”, Sustainable
Development. DOI: 10.1002/sd.1914.
Asongu, S. A., & Odhiambo, N. M., (2018b). “Mobile banking usage, quality of growth,
inequality and poverty in developing countries”, Information Development.
DOI: 10.1177/0266666917744006.
Asongu, S. A., & Odhiambo, N. M., (2019). “How enhancing information and communication technology has affected inequality in Africa for sustainable development: An empirical
investigation”, Sustainable Development. DOI: 10.1002/sd.1929.
Batuo, M. E., (2015). “The role of telecommunications infrastructure in the regional economic
growth of Africa”, Journal of Development Areas, 49(1), pp. 313-330.
Beck, T., Demirgüç-Kunt, A., & Levine, R., (2003), “Law and finance: why does legal origin
matter?”, Journal of Comparative Economics, 31(4), pp. 653-675.
Begum, R. A., Sohag, K., Abdullah S. M. S., & Jaafar, M., (2015). “CO2 emissions, energy
consumption, economic and population growth in Malaysia”, Renewal and Sustainable
Energy Reviews, 41(January), pp. 594-601.
Boateng, A., Asongu, S, Akamavi, R., & Tchamyou, V., (2018). “Information asymmetry and
market power in the African banking industry”, Journal of Multinational Financial
Management, 44(March), pp. 69-83.
Bölük, G., & Mehmet, M., (2015). “The renewable energy, growth and environmental
Kuznets curve in Turkey: An ARDL approach”, Renewal and Sustainable Energy Reviews,
52(December), pp. 587-595.
Bruno, G., De Bonis, R., & Silvestrini, A., (2012). “Do financial systems converge? New
evidence from financial assets in OECD countries”. Journal of Comparative Economics,
40(1), pp. 141-155.
Collett, T. S., (2012).“Energy resource potential of natural gas hydrates”. AAPG bulletin,
86(11), pp. 1971-1992.
Diao, X. D., Zeng, S. X., Tam, C. M. & Tam, V. W .Y., (2009). “EKC Analysis for Studying
Economic Growth and Environmental Quality: A Case Study in China”, Journal of Cleaner
Production, 17(5), pp. 541-548.
Efobi, U., Tanankem, B., Orkoh, E., Atata, S. N., Akinyemi, O., & Beecroft, I., (2018).
“Environmental Pollution Policy of Small Businesses in Nigeria and Ghana: Extent and Impact”, Environmental Science and Pollution Research.
18
Esso, L.J. (2010). “Threshold cointegration and causality relationship between energy use and
growth in seven African countries”, Energy Economics, 32(6), pp. 1383-1391.
He, J., & Richard, P., (2010). “Environmental Kuznets Curve for Co2 in Canada”, Ecological
Economics, 69(5), pp. 1083-1093.
Huxster, J. K., Uribe-Zarain, X. & Kempton, W., (2015). “Undergraduate Understanding of Climate Change: The Influences of College Major and Environmental Group Membership on
Survey Knowledge Scores”, The Journal of Environmental Education, 46(3), pp. 149-165.
Jumbe, C. B., (2004). “Cointegration and Causality between Electricity Consumption and
GDP: Empirical Evidence from Malawi”, Energy Economics, 26(1), pp. 61-68.
Kifle, T. (2008). “Africa hit hardest by Global Warming despite its low Greenhouse Gas
Emissions”, Institute for World Economics and International Management Working Paper
No. 108,http://www.iwim.uni-bremen.de/publikationen/pdf/b108.pdf(Accessed: 08/09/2015).
Mbah, P.O., & Nzeadibe, T. C., (2016). “Inclusive municipal solid waste management policy
in Nigeria: engaging the informal economy in post-2015 development agenda”, Local
Environment. The International Journal of Justice and Sustainability, 22(2), pp. 203-224.
Mehrara, M., (2007). “Energy consumption and economic growth: The case of oil exporting
countries”, Energy Policy, 35(5), pp. 2939-2945.
Menyah, K., & Wolde-Rufael, Y., (2010). “Energy consumption, pollutant emissions and economic growth in South Africa”, Energy Economics, 32(6), pp. 1374-1382.
Odhiambo, N. M., (2009a). “Electricity consumption and economic growth in South Africa: a
trivariate causality test”. Energy Economics, 31(5), pp. 635–640.
Odhiambo, N. M., (2009b). “Energy consumption and economic growth nexus in Tanzania:
an ARDL bounds testing approach”. Energy Policy, 37 (2), pp. 617–622.
Odhiambo, N.M. (2010). “Energy Consumption, Prices and Economic Growth in Three SSA Countries: A Comparative Study” Energy Policy, 38(5), pp. 2463-2469.
Odhiambo, NM (2014a). '”Energy Dependence in Developing Countries: Does the Level of
Income Matter'”, Atlantic Economic Journal, 42(1), pp. 65–77.
Odhiambo, NM (2014b). ''Electricity Consumption, Exports And Economic Growth in the Democratic Republic of Congo: An ARDL-Bounds Testing Approach'', Journal of Developing Areas, 48( 4), pp.189-207.
Osabuohien, E. S., & Efobi, U. R., (2013). “Africa’s money in Africa”, South African Journal
of Economics, 81(2), pp. 292-306.
Olusegun, O. A., (2008). “Consumption and Economic Growth in Nigeria: A bounds testing
19
Ozturk, I., & Acaravci, A., (2010). “CO2 emissions, energy consumption and economic
growth in Turkey”, Renewable and Sustainable Energy Reviews, 14(9), pp. 3220-3225.
Petrakis, P. E., & Stamatakis, D., (2002). “Growth and educational levels: a comparative
analysis”. Economics of Education Review, 21(2), pp. 513-521.
Pingali, P. L., (2012).“Green revolution: Impacts, limits, and the path ahead”. Proceedings of
the National Academy of Sciences, 109(31), pp.12302-12308
Roodman, D., (2009a). “A Note on the Theme of Too Many Instruments”, Oxford Bulletin of
Economics and Statistics, 71(1), pp. 135-158.
Roodman, D., (2009b). “How to do xtabond2: An introduction to difference and system
GMM in Stata”, Stata Journal, 9(1), pp. 86-136.
Rui, Z., Li, C., Peng, F., Ling, K., Chen, G., Zhou, X., & Chang, H., (2017). “Development of
industry performance metrics for offshore oil and gas project”, Natural Gas Science and
Engineering, 39(March), pp. 44-53.
Shaw, J., & Bachu, S., (2012). “Screening, evaluation, and ranking of oil reservoirs suitable for CO2-flood EOR and carbon dioxide sequestration”. Journal of Canadian Petroleum
Technology, 41(09), pp. 1-11. DOI: 10.2118/02-09-05.
Shurig, S. (2015). “Who will fund the renewable solution to the energy crisis?”,theguardian,
http://www.theguardian.com/global-development-professionalsnetwork/2014/jun/05/renewable-energy-electricty-africa-policy (Accessed: 08/09/2015).
Tchamyou, V. S., (2019a). “Education, Lifelong learning, Inequality and Financial access:
Evidence from African countries”. Contemporary Social Science.
DOI: 10.1080/21582041.2018.1433314.
Tchamyou, V. S., (2019b).“The Role of Information Sharing in Modulating the Effect of
Financial Access on Inequality”. Journal of African Business: Forthcoming.
Tchamyou, V. S., & Asongu, S. A., (2017). “Information Sharing and Financial Sector
Development in Africa”, Journal of African Business, 18(7), pp. 24-49.
Tchamyou, V.S., Erreygers, G., & Cassimon, D., (2019). “Inequality, ICT and Financial
Access in Africa”, Technological Forecasting and Social Change,139(February), pp.
169-184.
World Bank (2013). World Bank Fact Sheet – http://go.worldbank.org/8VI6E7MRU0