ORIGINAL RESEARCH
High b-Value Diffusion (
b
ⴝ
3000 s/mm
2
) MR
Imaging in Cerebral Gliomas at 3T: Visual and
Quantitative Comparisons with
b
ⴝ
1000 s/mm
2
H.S. Seo K.-H. Chang D.G. Na B.J. Kwon D.H. Lee
BACKGROUND AND PURPOSE: High b-value diffusion-weighted imaging (DWI) provides different fea-tures not appreciated at lower b-value and have been recently studied in several clinical issues. The purpose of this study was to assess whether DWI atb⫽3000 s/mm2is more useful in discriminating high-grade and low-grade gliomas than DWI atb⫽1000 s/mm2at 3T.
MATERIALS AND METHODS: DWIs at bothb⫽1000 and 3000 s/mm2were performed at 3T in 62 patients, 49 high-grade gliomas (20 World Health Organization [WHO] grade III and 29 grade IV) and 13 low-grade gliomas (13 grade II). Visual assessments based on 5-point scaled evaluations, receiver operating characteristic (ROC) curve analysis, and quantitative assessment based on DWI signal intensity (SI) ratio (tumor SI/normal SI) and apparent diffusion coefficient (ADC) values were compared between DWIs atb⫽1000 and 3000 s/mm2.
RESULTS: By visual assessment, DWI atb⫽3000 s/mm2showed more conspicuous hyperintensity in high-grade gliomas and hypointensity in low-grade gliomas than DWI atb⫽1000 s/mm2. Sensitivity and specificity atb⫽3000 s/mm2were higher than atb⫽1000 s/mm2(83.7%, 84.6% vs 69.4%, 76.9%, respectively). Quantitative assessments showed that mean SI ratio of high-grade gliomas was significantly higher than that of low-grade gliomas at both b-values. The mean ADC value of high-grade gliomas was significantly lower than that of low-grade gliomas at both b-values. The difference between the SI ratios of high-grade and low-grade gliomas was significantly larger atb⫽3000 s/mm2 than atb⫽1000 s/mm2.
CONCLUSION:DWI atb⫽3000 s/mm2is more useful than DWI atb⫽1000 s/mm2in terms of discriminating high-grade and low-grade gliomas at 3T.
D
iffusion-weighted imaging (DWI) is a sensitive technique that reflects microscopic water diffusion with the use of a pair of strong diffusion gradients1and has been used routinelyfor the early detection of cerebral ischemia with diffusion re-striction.2 DWI and apparent diffusion coefficient (ADC)
value have been studied in other clinical situations, including the differential diagnosis and grading of brain tumors.3-15
Although it is known that higher cellularity in high-grade glioma results in greater diffusion restriction and a reduction in ADC values, whereas lower cellularity in low-grade glioma increases ADC values,8-14DWI at a standard b-value (b⫽
1000 s/mm2) at 1.5T barely differentiates high-grade and low-grade gliomas in many cases because of overlapping signal intensities (SI) on DWI and ADC maps.
Theoretically, a higher b-value DWI provides better con-trast with its reflection of more tissue diffusivity and less T2 shinethrough effect.16,17 However, at 1.5 or lower field
strength, higher b-values are not usually used in clinical prac-tice because of poor image quality secondary to an inferior signal-to-noise ratio (SNR).18-21Recently, stronger gradients
and faster slew rates have permitted high b-value DWI, partic-ularly in 3T units, because higher SNRs at 3T compensate for
the inferior SNRs of high b-value DWI without increasing data acquisition time.
The purpose of our investigation was to assess whether DWI at high b-value (b⫽3000 s/mm2), is better than DWI at a standardb-value (b⫽1000 s/mm2) for the differential
diag-nosis of high-grade and low-grade cerebral gliomas in clinical practice at 3T.
Methods
Patients
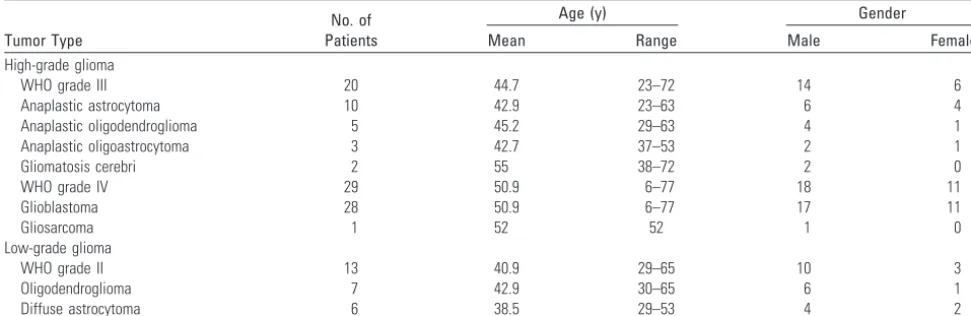
The institutional review board at our institution approved this retro-spective study and waived the requirement for informed consent. A total of 62 patients with 49 high-grade (WHO grade III and IV) and 13 low-grade (WHO grade II) cerebral gliomas (42 men, 20 women; mean age, 46.8 years; age range, 6 –77 years) diagnosed between March 2003 and May 2005 were included in the study (Table 1). All 62 gliomas were confirmed on pathologic examination.
Imaging Data Acquisition
We performed all studies using a 3T MR system (Signa 3T; GE Med-ical Systems, Milwaukee, Wis) with a circularly polarized head coil. The system was equipped with high-performance gradients (40 mT/ms with slew rate of 150 mT/m/s). All patients underwent MR imaging with 2 DWIs atb⫽1000 and 3000 s/mm2in addition to
unenhanced transverse and sagittal T1-weighted imaging, unen-hanced transverse T2-weighted imaging, fluid-attenuated inversion-recovery (FLAIR) imaging, and contrast-enhanced T1-weighted im-aging in 3 orthogonal planes.
We obtained both DWIs using a single-shot echo-planar spin-echo technique and the same following parameters: FOV, 24⫻24 cm; Received May 22, 2007; accepted August 13.
From the Department of Radiology (H.S.S., K.-H.C., D.G.N., B.J.K., D.H.L.), Seoul National University School of Medicine; and the Department of Radiology (H.S.S.), Dongguk Uni-versity International Hospital, Seoul, Korea.
Please address correspondence to Kee-Hyun Chang, MD, Department of Diagnostic Radi-ology, Seoul, National University Hospital, 28 Yongon-dong, Chongno-gu, Seoul 110-744, Korea; e-mail: [email protected]
matrix size, 128⫻128; section thickness, 5 mm; section gap, 1.5 mm, and NEX,1. The TR and TE in DWI atb⫽1000 and 3000 s/mm2were
10,000/73.4 ms and 10,000/94.1 ms, respectively. Diffusion gradients were encoded in 3 orthogonal axes (x, y, and z) to generate trace DWI.
Qualitative Assessment
Two neuroradiologists (K.-H.C., D.G.N.), unaware of other conven-tional MR images and clinical/pathologic information, indepen-dently reviewed the DWI and scored the SIs of tumors on a 1- to 5-point scale. When a tumor had mixed SI, its most hyperintense SI was scored. After independent reviews were performed, discrepant cases were rescored by consensus between the 2 observers.
The 5-point scale assigned to tumor signals on DWI obtained atb ⫽1000 s/mm2was as follows: 1⫽markedly hypointense SI nearly
equal to that of normal CSF; 2⫽hypointense SI between those of normal CSF and normal subcortical white matter; 3⫽isointense SI equal or similar to that of normal subcortical white matter; 4⫽ hy-perintense SI between those of normal subcortical white matter and normal cortex; 5⫽markedly hyperintense SI higher than that of normal cortex.
Atb⫽3000 s/mm2, points from 1 to 3 were assigned to tumor
signals the same as those observed atb⫽1000 s/mm2, but 4 points
were assigned to hyperintense signals between those of the normal subcortical white matter and the corticospinal tract and 5 to markedly hyperintense signals that were equal to or higher than that of the normal corticospinal tract. The corticospinal tract was chosen as a reference tissue for hyperintensity because white matter, especially that in the corticospinal tract, was the most hyperintense normal brain structure onb⫽3000 s/mm2DWI.
Quantitative Assessment
Tumor DWI SI ratios and ADC values were obtained atb⫽1000 s/mm2andb⫽3000 s/mm2for all tumors. Circular regions of interest
(ROIs) were placed in 3 different hyperintense portions of each tumor in an axial plane on each DWI by consensus between the 2 neurora-diologists (D.G.N., H.S.S.). The ROIs varied from 10 to 20 mm2in
area and were adjusted to include only regions of solid tumor based on the other nonenhanced and enhanced MR images. Areas of necro-sis, cyst, hemorrhage, edema, and calcification were avoided.
Of these 3 ROIs, the ROI with the highest SI was selected for measurement purposes. We calculated the SI ratios by dividing the highest SI of a tumor by the SI of normal subcortical white matter in
the contralateral cerebral hemisphere. We calculated the ADC values atb⫽1000 s/mm2using SIs atb⫽0 and 1000 s/mm2, and ADC
values atb⫽3000 s/mm2using SIs atb⫽1000 and 3000 s/mm2.
Statistical Analyses
We performed statistical analyses using commercially available soft-ware packages (SPSS, version 12.0; SPSS, Chicago, Ill, and Medcalc, version 9.3; Medcalc Software, Mariakerke, Belgium).Pvalues of less than .05 were considered statistically significant. In qualitative assess-ments, we compared mean 5-point scale scores for high-grade and low-grade gliomas using the Studentttest. Receiver operating char-acteristic (ROC) curve analysis was performed to compare diagnostic performance atb⫽1000 and 3000 s/mm2
with respect to differenti-ation of high-grade and low-grade gliomas. Areas under the ROC curve (Az values) were also calculated to summarize the performances of the 2 DWI types with respect to this differentiation. We calculated the sensitivities, specificities, and positive and negative predictive val-ues at the 2b-values by using cutoff scores corresponding to mini-mum C1 errors as determined by ROC analysis, where C1⫽1⫺ (sensitivity⫹specificity)/2. When the score of a tumor was higher than the cutoff score, we regarded the tumor as high grade. -coeffi-cients of interobserver visual assessment agreements were calculated at both b-values.
In quantitative assessments, we compared the mean SI ratios and mean ADC values of high-grade and low-grade gliomas using the Studentttest. Analysis of variance with a nondirectional Tukey post hoc procedure was used to compare those of the WHO grades of gliomas. The pairedttest for matched pairs was used to compare those atb⫽1000 and 3000 s/mm2.
Results
Qualitative Assessment
[image:2.594.52.538.59.217.2]On DWI atb⫽1000 s/mm2, all high-grade gliomas were, at least focally, markedly hyperintense (n⫽34) or hyperintense (n⫽15) (Fig 1), whereas low-grade tumors were markedly hyperintense (n⫽3), hyperintense (n⫽5), isointense (n⫽3), or hypointense (n ⫽2) (Fig 2). Atb⫽3000 s/mm2, most high-grade tumors were markedly hyperintense (n⫽36) or hyperintense (n⫽5) (Fig 1), whereas most low-grade tumors were isointense (n ⫽5), hypointense (n ⫽4), or markedly
Table 1: Summary of histologic diagnoses and patient demographics
Tumor Type
No. of Patients
Age (y) Gender
Mean Range Male Female
High-grade glioma
WHO grade III 20 44.7 23–72 14 6
Anaplastic astrocytoma 10 42.9 23–63 6 4
Anaplastic oligodendroglioma 5 45.2 29–63 4 1
Anaplastic oligoastrocytoma 3 42.7 37–53 2 1
Gliomatosis cerebri 2 55 38–72 2 0
WHO grade IV 29 50.9 6–77 18 11
Glioblastoma 28 50.9 6–77 17 11
Gliosarcoma 1 52 52 1 0
Low-grade glioma
WHO grade II 13 40.9 29–65 10 3
Oligodendroglioma 7 42.9 30–65 6 1
Diffuse astrocytoma 6 38.5 29–53 4 2
Note:—WHO indicates World Health Organization.
BRAIN
ORIGINAL
hypointense (n⫽2) (Fig 2). However, 2 grade II gliomas were markedly hyperintense.
Mean scores and ranges of DWI SIs of brain tumors ac-cording to the 5-point scale assessment are presented in Table 2. The mean score of all high-grade gliomas was significantly higher than that of low-grade gliomas atb⫽1000 s/mm2(4.7 ⫾0.5 vs 3.7⫾1.0;P⬍.05) and atb⫽3000 s/mm2(4.6⫾0.8 vs 2.7⫾1.3;P⬍.05), respectively. No significant SI difference was observed between WHO grade III and IV gliomas at either b-value (P⬎.05).
The ROC curves of DWIs atb⫽1000 and 3000 s/mm2are
shown in Fig 3. The Az value ofb⫽3000 s/mm2DWI was
higher than that ofb⫽1000 s/mm2DWI but the difference
was not statistically significant (P⫽.08). As noted in Table 3, when the optimal cutoff scores for high-grade glioma were 5 at
b⫽1000 s/mm2and 4 atb⫽3000 s/mm2, sensitivity and
specificity were higher forb⫽3000 s/mm2(83.7% and 84.6%,
respectively) than forb⫽1000 s/mm2(69.4% and 76.9%, respectively). Positive and negative predictive values atb⫽
3000 s/mm2were also higher than atb⫽1000 s/mm2(95.3% and 57.9% vs 94.4% and 40%, respectively).-values of inter-observer agreement were higher atb⫽3000 s/mm2than atb⫽
1000 s/mm2.
Quantitative Assessment
In high-grade and low-grade gliomas, mean SI ratios and mean ADC values atb⫽1000 and 3000 s/mm2are presented
in Tables 4 and 5. The mean SI ratio of high-grade gliomas was significantly higher than that of low-grade gliomas at both b-values (P⬍.05) (Fig 4A). The mean ADC value of high-grade gliomas was also significantly lower than that of low-grade gliomas at both b-values (P⬍.05) (Fig 4B). No signifi-cant difference was found between the SI ratios or ADC values of grade III and IV gliomas at either b-value.
The mean SI ratio of high-grade gliomas atb⫽3000 s/mm2
was significantly higher than that atb⫽1000 s/mm2(P⬍.05),
whereas the mean SI ratio of low-grade gliomas atb⫽3000 s/mm2was significantly lower than that atb⫽1000 s/mm2(P ⬍.05) (Table 4). Thus, the difference between the mean SI ratios of high-grade and low-grade tumors atb⫽3000 s/mm2
was greater than that atb⫽1000 s/mm2.
The mean ADC values of brain tumors and normal subcor-tical white matter atb⫽3000 s/mm2were significantly lower than atb⫽1000 s/mm2(P⬍.01) (Table 5, Fig 4B). At a b-value of 3000 s/mm2
, the ADCs of high-grade and low-grade gliomas decreased by 34% to 36%, whereas the ADC of normal subcortical white matter decreased by 20%.
Fig 1.Grade IV glioblastoma in a 27-year-old man.A,Transverse T2-weighted image shows a slightly hyperintense main mass (arrow) in the right medial temporal lobe.B,Sagittal contrast-enhanced T1-weighted image shows diffuse tumor enhancement (arrow).C,Transverse DWI atb⫽1000 s/mm2shows slight tumor hyperintensity with some hypointense foci.
[image:3.594.55.534.43.392.2]Discussion
Cellularity is one of the most important determinations of brain tumor grade.22,23Increased cellularity in a high-grade
tumor restricts the microscopic water movement in tissue,23,24
and thus ADC values are lower than those of low-grade tu-mors, which have relatively low cellularity. As a result, high-grade tumors have more intense DWI SIs than low-high-grade tumors.8-14
In our study, our comparisons of DWIs atb⫽1000 s/mm2
andb⫽3000 s/mm2showed more conspicuous hyperinten-sity in most high-grade gliomas, and more conspicuous hy-pointensity in most low-grade gliomas atb⫽3000 s/mm2.
This result indicates that differences between the SI ratios of
high-grade and low-grade gliomas are larger at b ⫽ 3000 s/mm2 (Fig 4A), which results in better diagnostic perfor-mance (higher sensitivity and specificity) atb⫽3000 s/mm2.
In particular, this difference betweenb⫽1000 s/mm2andb⫽
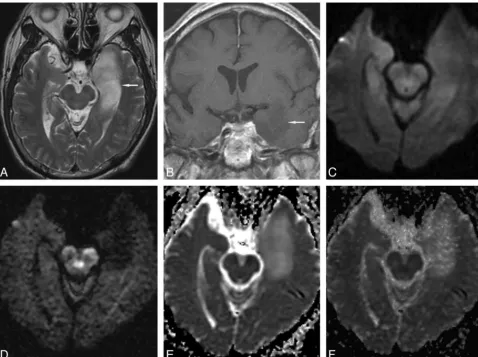
3000 s/mm2was more prominent in low-grade gliomas. Many Fig 2.Grade II diffuse astrocytoma in a 66-year-old man.A, Transverse T2-weighted image shows a hyperintense mass (arrow) in the left medial temporal lobe.B,Coronal contrast-enhanced T1-weighted image shows slight tumor hypointensity without enhancement (arrow).C,Transverse DWI atb⫽1000 s/mm2
[image:4.594.57.536.42.399.2]shows tumor isointensity.D,Transverse DWI atb⫽3000 s/mm2 shows marked tumor hypointensity. Transverse ADC maps atb⫽1000 s/mm2(E) andb⫽3000 s/mm2(F) show tumor hyperintensity.
Table 2: Mean scores and ranges of DWI signal intensities (SIs) in cerebral gliomas according to the five-point visual assessment scale used in this study
b⫽1000 s/mm2 b⫽3000 s/mm2 Mean⫾SD Range Mean⫾SD Range
High-grade glioma (n⫽49) 4.7⫾0.5 4–5 4.6⫾0.8 2–5
WHO grade III (n⫽20) 4.7⫾0.5 4–5 4.4⫾1.0 2–5
WHO grade IV (n⫽29) 4.7⫾0.4 4–5 4.7⫾0.7 3–5
Low-grade (II) glioma (n⫽
13)
3.7⫾1.0 2–5 2.7⫾1.3 1–5
Note:—WHO indicates World Health Organization; SD, standard deviation.
[image:4.594.301.535.442.628.2] [image:4.594.52.285.480.557.2]hyperintense or isointense low-grade gliomas atb ⫽1000 s/mm2became hypointense atb⫽3000 s/mm2with a mean SI ratio of less than 1. This greater difference in SI ratios atb⫽
3000 s/mm2provides better contrast, which we attribute to a
greater diffusion-weighted response and less T2 shinethrough effect atb⫽3000 s/mm2.
As noted in Table 5, atb⫽1000 s/mm2, the mean ADC
values of high-grade and low-grade gliomas were higher than that of normal white matter, which concurs with previous studies,25,26but atb⫽3000 s/mm2, the mean ADC values of high-grade gliomas were lower than that of normal white mat-ter, whereas the ADC value of low-grade glioma remained higher than that of normal white matter (Fig 4B). Conse-quently, these changes in the ADC values in high-grade and low-grade gliomas at high b-value resulted in greater contrast between tumors and normal tissue.
As demonstrated in Table 3, a high positive predictive value (95.3%) indicates that DWI atb⫽3000 s/mm2is clinically useful to predict high-grade tumor (hyperintense or markedly hyperintense on DWI, or higher than score 4), though it is unlikely to replace biopsy to determine tumor grade and pa-thology. However, its low negative predictive value (57.9%) suggests that it is not as useful at predicting low-grade glioma when DWI SIs are isointense or hypointense, and that, thus, the technique should be applied with caution. If predictions of
low-grade glioma were limited to hypointense or markedly hypointense masses, its positive predictive value for low-grade glioma would increase to approximately 85%.
ADC values decrease when b-values are increased beyond 1000 s/mm2.16,27-31DeLano et al16reported that ADC values
decreased by approximately 30% to 35% whenb-values were increased from 1000 s/mm2to 3000 s/mm2for some ROIs. If
the relationship between MR signals and b-values were mono-exponential, the ADC values would remain constant for any 2-point calculation as b-values are increased. The observed ADC decrease on increasing b-values could be explained by biexponential SI decay. Fast and slow diffusion components have been described in human brain models, and at a relatively low b-value, SI is dominated by fast diffusion, whereas at a high b-value SI is governed predominantly by slow diffusion. Intracellular and extracellular water are considered to corre-spond to, but not exactly equal to, slow and fast diffusion components, respectively.27,31-33
In the present study, degrees of ADC decrease atb⫽3000 s/mm2differed in tumors and normal brain tissue (34%–36% vs
20%, respectively). Although the reason for this difference is not known, we speculate that the slow diffusion component fraction, which may be determined by the concentrations of water-bind-ing macromolecules, cellular size, and changes in tissue architec-ture,30is larger in brain tumors than in normal brain tissue.
Fig 4.Box plots of DWI SI ratios (A) in high-grade and low-grade gliomas, and ADC values (B) of high-grade and low-grade gliomas and normal subcortical white matter atb ⫽1000 and 3000 s/mm2
. The horizontal line is the median, and the upper and lower ends of the boxes are the upper and lower quartiles, respectively. The vertical lines represent data ranges.A,The mean SI ratio of high-grade gliomas was significantly higher than that of low-grade gliomas at both b-values (P⬍.01). Note that the difference between the mean SI ratios of high-grade and low-grade gliomas atb⫽
3000 s/mm2was significantly greater than atb⫽1000 s/mm2
(P⬍.05).B,The mean ADC value of high-grade gliomas was significantly lower than that of low-grade glio-mas at both b-values (P⬍.01). The mean ADC values of high-grade and low-grade gliomas and normal subcortical white matter atb⫽3000 s/mm2
[image:5.594.55.533.58.93.2]were significantly lower than atb⫽1000 s/mm2, respectively (P⬍.01). Table 5: Comparison of mean ADC values betweenbⴝ1000 s/mm2
(ADC1) andbⴝ3000 s/mm 2(ADC
3) in high-grade and low-grade
gliomas and normal subcortical white matter
ADC1(m
2/s) ADC
3(m
2/s)
High-grade glioma (n⫽49) 914.6⫾278.9 597.6⫾195.9
WHO grade III (n⫽20) 970.8⫾333.6 627.3⫾248.2
WHO grade IV (n⫽29) 875.9⫾232.4 577.2⫾151.3
Low-grade (II) glioma (n⫽13) 1379.2⫾428.2 910.8⫾227.1 Normal subcortical WM (n⫽62) 779.1⫾70.7 625.0⫾68.9
Note:—WM indicates white matter; ADC, apparent diffusion coefficient. Table 3: Results of ROC analysis of DWIs atbⴝ1000 andbⴝ3000 s/mm2
DWI Az* Cutoff Score† Sensitivity (%) Specificity (%) PPV‡ (%) NPV‡ (%) -value§
b⫽1000 s/mm2 0.790 5 69.4 76.9 94.4 40.0 0.56
b⫽3000 s/mm2 0.864 4 83.7 84.6 95.3 57.9 0.77
Note:—ROC indicates receiver operating characteristic; DWI, diffusion-weighted imaging.
* Az refers to area under the ROC curve; these were not significantly different with the 2 b-values (P⫽.08).
† Cutoff score refers to the optimal cutoff level for high-grade glioma with highest accuracy for obtaining a positive test for high-grade glioma with a minimum C1 error by ROC analysis, where C1⫽1⫺(sensitivity⫹specificity)/2.
[image:5.594.301.533.181.248.2]‡ PPV and NPV are positive and negative predictive values, respectively, for high-grade glioma. §-value is the kappa value for interobserver agreement.
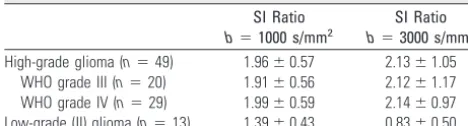
Table 4: Comparison of mean DWI signal intensity (SI) ratios and standard deviations betweenbⴝ1000 s/mm2andbⴝ3000 s/mm2
in high-grade and low-grade gliomas
SI Ratio
b⫽1000 s/mm2
SI Ratio
b⫽3000 s/mm2
High-grade glioma (n⫽49) 1.96⫾0.57 2.13⫾1.05
WHO grade III (n⫽20) 1.91⫾0.56 2.12⫾1.17
WHO grade IV (n⫽29) 1.99⫾0.59 2.14⫾0.97
Low-grade (II) glioma (n⫽13) 1.39⫾0.43 0.83⫾0.50
[image:5.594.52.286.185.248.2]The trade-off of using a high b-value is SNR reduction.20,21 In our study at 3T, mean SNR atb⫽3000 s/mm2and with
NEX of 1 was approximately one third of mean SNR atb⫽
1000 s/mm2and with NEX of 1 (30.8⫾21.7 vs 93.5⫾42.1).
However, the lower SNR atb⫽3000 s/mm2and NEX of 1 did not lead to any diagnostic problem in our study. Thus, higher SNRs at 3T seem to overcome the SNR decrease associated with the use of a high b-value.
One of the limitations of our study concerns the identifica-tions of areas containing highest SIs in tumors with variable tissue components. In our study, we adopted the method de-scribed by Wetzel et al,34who selected highest SI regions from
among 3 measurements to determine high-grade tumors in their perfusion MR imaging study. Different TEs atb⫽1000 s/mm2andb⫽3000 s/mm2could have been another
limita-tion. The TEs used in our study were minimum TEs and were optimized for the 2 b-values.
Conclusion
DWI atb⫽3000 s/mm2showed more conspicuous
hyperin-tensity than DWI atb⫽1000 s/mm2, at least focally, in most high-grade gliomas, and hypointensity in most low-grade gli-omas. Sensitivity and specificity at b ⫽ 3000 s/mm2 were
higher than those atb⫽1000 s/mm2(83.7% and 84.6% vs
69.4% and 76.9%, respectively), and the quantitative assess-ment showed that differences between the SI ratios of high-grade and low-high-grade gliomas were significantly larger atb⫽
3000 s/mm2than atb⫽1000 s/mm2. Thus, we recommend
that high b-value DWI (b⫽3000 s/mm2) be used to predict the grade of cerebral gliomas at 3T.
References
1. Bammer R.Basic principles of diffusion-weighted imaging.Eur J Radiol
2003;45:169 – 84
2. Lutsep HL, Albers GW, DeCrespigny A, et al.Clinical utility of diffusion-weighted magnetic resonance imaging in the assessment of ischemic stroke.
Ann Neurol1997;41:574 – 80
3. Shiga Y, Miyazawa K, Sato S, et al.Diffusion-weighted MRI abnormalities as an early diagnostic marker for Creutzfeldt-Jakob disease.Neurology
2004;63:443– 49
4. Romano A, Bozzao A, Bonamini M, et al.Diffusion-weighted MR imaging: clinical applications in neuroradiology.Radiol Med (Torino) 2003;106:521– 48 5. Asao C, Korogi Y, Kitajima M, et al.Diffusion-weighted imaging of radiation-induced brain injury for differentiation from tumor recurrence.AJNR Am J Neuroradiol2005;26:1455– 60
6. Gaviani P, Schwartz RB, Hedley-Whyte ET, et al.Diffusion-weighted imaging of fungal cerebral infection.AJNR Am J Neuroradiol2005;26:1115–21 7. Hein PA, Eskey CJ, Dunn JF, et al.Diffusion-weighted imaging in the
fol-low-up of treated high-grade gliomas: tumor recurrence versus radiation in-jury.AJNR Am J Neuroradiol2004;25:201– 09
8. Krabbe K, Gideon P, Wagn P, et al.MR diffusion imaging of human intracra-nial tumours.Neuroradiology1997;39:483– 89
9. Filippi CG, Edgar MA, Ulug AM, et al.Appearance of meningiomas on diffu-sion-weighted images: correlating diffusion constants with histopathologic findings.AJNR Am J Neuroradiol2001;22:65–72
10. Stadnik TW, Chaskis C, Michotte A, et al.Diffusion-weighted MR imaging of intracerebral masses: comparison with conventional MR imaging and histo-logic findings.AJNR Am J Neuroradiol2001;22:969 –76
11. Bulakbasi N, Kocaoglu M, Ors F, et al.Combination of single-voxel proton MR spectroscopy and apparent diffusion coefficient calculation in the evaluation of common brain tumors.AJNR Am J Neuroradiol2003;24:225–33 12. Kono K, Inoue Y, Nakayama K, et al.The role of diffusion-weighted imaging in
patients with brain tumors.AJNR Am J Neuroradiol2001;22:1081– 88 13. Okamoto K, Ito J, Ishikawa K, et al.Diffusion-weighted echo-planar MR
im-aging in differential diagnosis of brain tumors and tumor-like conditions.Eur Radiol2000;10:1342–50
14. Yamasaki F, Kurisu K, Satoh K, et al.Apparent diffusion coefficient of human brain tumors at MR imaging.Radiology2005;235:985–91
15. Maeda M, Kato H, Sakuma H, et al.Usefulness of the apparent diffusion coef-ficient in line scan diffusion-weighted imaging for distinguishing between squamous cell carcinomas and malignant lymphomas of the head and neck.
AJNR Am J Neuroradiol2005;26:1186 –92
16. DeLano MC, Cooper TG, Siebert JE, et al.High-b-value diffusion-weighted MR imaging of adult brain: image contrast and apparent diffusion coefficient map features.AJNR Am J Neuroradiol2000;21:1830 –36
17. Burdette JH, Durden DD, Elster AD, et al.High b-value diffusion-weighted MRI of normal brain.J Comput Assist Tomogr2001;25:515–19
18. Kim HJ, Choi CG, Lee DH, et al.High-b-value diffusion-weighted MR imaging of hyperacute ischemic stroke at 1.5T.AJNR Am J Neuroradiol2005;26:208 –15 19. Tha KK, Terae S, Yamamoto T, et al.Early detection of global cerebral anoxia: improved accuracy by high-b-value diffusion-weighted imaging with long echo time.AJNR Am J Neuroradiol2005;26:1487–97
20. Meyer JR, Gutierrez A, Mock B, et al.High-b-value diffusion-weighted MR imaging of suspected brain infarction. AJNR Am J Neuroradiol
2000;21:1821–29
21. Burdette JH, Elster AD.Diffusion-weighted imaging of cerebral infarctions: are higher B values better?J Comput Assist Tomogr2002;26:622–27 22. Kleihues P, Sobin LH.World Health Organization classification of tumors.
Cancer2000;88:2887
23. Sugahara T, Korogi Y, Kochi M, et al.Usefulness of diffusion-weighted MRI with echo-planar technique in the evaluation of cellularity in gliomas.J Magn Reson Imaging1999;9:53– 60
24. Guo AC, Cummings TJ, Dash RC, et al. Lymphomas and high-grade astrocytomas: comparison of water diffusibility and histologic characteris-tics.Radiology2002;224:177– 83
25. Castillo M, Smith JK, Kwock L, et al.Apparent diffusion coefficients in the evaluation of high-grade cerebral gliomas. AJNR Am J Neuroradiol
2001;22:60 – 64
26. Lam WW, Poon WS, Metreweli C.Diffusion MR imaging in glioma: does it have any role in the pre-operation determination of grading of glioma?Clin Radiol2002;57:219 –25
27. Niendorf T, Dijkhuizen RM, Norris DG, et al.Biexponential diffusion attenu-ation in various states of brain tissue: implicattenu-ations for diffusion-weighted imaging.Magn Reson Med1996;36:847–57
28. Mulkern RV, Gudbjartsson H, Westin CF, et al.Multi-component apparent diffusion coefficients in human brain.NMR Biomed1999;12:51– 62 29. Brugieres P, Thomas P, Maraval A, et al.Water diffusion
compartmenta-tion at high b values in ischemic human brain.AJNR Am J Neuroradiol
2004;25:692–98
30. Maier SE, Bogner P, Bajzik G, et al.Normal brain and brain tumor: multi-component apparent diffusion coefficient line scan imaging.Radiology
2001;219:842– 49
31. Clark CA, Le Bihan D.Water diffusion compartmentation and anisotropy at high b values in the human brain.Magn Reson Med2000;44:852–59 32. Nicholson C, Sykova´ E.Extracellular space structure revealed by diffusion
analysis.Trends Neurosci1998;21:207–15
33. Sehy JV, Ackerman JJ, Neil JJ.Evidence that both fast and slow water ADC components arise from intracellular space.Magn Reson Med2002;48:765–70 34. Wetzel SG, Cha S, Johnson G, et al.Relative cerebral blood volume