2023
Data-to-text Generation with Entity Modeling
Ratish PuduppullyandLi DongandMirella Lapata Institute for Language, Cognition and Computation
School of Informatics, University of Edinburgh 10 Crichton Street, Edinburgh EH8 9AB
[email protected] [email protected] [email protected]
Abstract
Recent approaches to data-to-text generation have shown great promise thanks to the use of large-scale datasets and the application of neural network architectures which are trained end-to-end. These models rely on represen-tation learning to select content appropriately, structure it coherently, and verbalize it gram-matically, treating entities as nothing more than vocabulary tokens. In this work we pro-pose an entity-centric neural architecture for data-to-text generation. Our model creates entity-specific representations which are dy-namically updated. Text is generated con-ditioned on the data input and entity mem-ory representations using hierarchical atten-tion at each time step. We present experi-ments on the ROTOWIRE benchmark and a (five times larger) new dataset on the baseball domain which we create. Our results show that the proposed model outperforms competitive baselines in automatic and human evaluation.1
1 Introduction
Data-to-text generation is the task of generating
textual output from non-linguistic input (Reiter
and Dale,1997;Gatt and Krahmer,2018). The in-put may take on several guises including tables of records, simulations of physical systems,
spread-sheets, and so on. As an example, Figure1shows
(in a table format) the scoring summary of a major league baseball (MLB) game, a play-by-play sum-mary with details of the most important events in the game recorded chronologically (i.e., in which play), and a human-written summary.
Modern approaches to data-to-text generation
have shown great promise (Lebret et al., 2016;
Mei et al., 2016; Perez-Beltrachini and Lapata,
2018; Puduppully et al., 2019; Wiseman et al.,
1Our code and dataset can be found at https://
github.com/ratishsp/data2text-entity-py.
2017) thanks to the use of large-scale datasets and
neural network models which are trained end-to-end based on the very successful encoder-decoder
architecture (Bahdanau et al., 2015). In
con-trast to traditional methods which typically
imple-ment pipeline-style architectures (Reiter and Dale,
2000) with modules devoted to individual
genera-tion components (e.g., content selecgenera-tion or lexical choice), neural models have no special-purpose mechanisms for ensuring how to best generate a text. They simply rely on representation learning to select content appropriately, structure it coher-ently, and verbalize it grammatically.
In this paper we are interested in the genera-tion of descriptive texts such as the game summary
shown in Figure 1. Descriptive texts are often
characterized as “entity coherent” which means
that their coherence is based on the way entities
(also known as domain objects or concepts) are
introduced and discussed in the discourse (
Kara-manis et al., 2004). Without knowing anything about baseball or how game summaries are
typi-cally written, a glance at the text in Figure1
re-veals that it is about a few entities, namely players who had an important part in the game (e.g., Brad Keller, Hunter Dozier) and their respective teams (e.g., Orioles, Royals). The prominent role of en-tities in achieving discourse coherence has been long recognized within the linguistic and
cogni-tive science literature (Kuno, 1972;Chafe, 1976;
Halliday and Hasan,1976;Karttunen,1976;Clark and Haviland,1977;Prince,1981), with Centering
Theory (Grosz et al.,1995) being most prominent
at formalizing how entities are linguistically real-ized and distributed in texts.
TEAM Inn1 Inn2 Inn3 Inn4 . . . R H E . . .
Orioles 1 0 0 0 . . . 2 4 0 . . .
Royals 1 0 0 3 . . . 9 14 1 . . .
BATTER H/V AB R H RBI TEAM . . .
C. Mullins H 4 2 2 1 Orioles . . .
J. Villar H 4 0 0 0 Orioles . . .
W. Merrifield V 2 3 2 1 Royals . . .
R. O’Hearn V 5 1 3 4 Royals . . . . . . .
PITCHER H/V W L IP H R ER BB K . . .
A. Cashner H 4 13 5.1 9 4 4 3 1 . . .
B. Keller V 7 5 8.0 4 2 2 2 4 . . . . . . .
Inn1:innings,R:runs,H:hits,E:errors,AB:at-bats,
RBI:runs-batted-in,H/V:home or visiting,W:wins,
L:losses,IP:innings pitched,ER:earned runs,BB:
walks,K:strike outs.
KANSAS CITY, Mo. –Brad Kellerkept up his recent pitching surge with another strong outing. Kellergave up a home run to the first batter of the game –Cedric Mullins– but quickly settled in to pitch eight strong innings in the Kansas CityRoyals’ 9–2 win over the Bal-timoreOriolesin a matchup of the teams with the worst records in the majors. Keller(7–5) gave up two runs and four hits with two walks and four strikeouts to improve to 3–0 with a 2.16 ERA in his last four starts.Ryan O’Hearnhomered among his three hits and drove in four runs,Whit Merrifieldscored three runs, andHunter DozierandCam Gallagheralso went deep to help theRoyalswin for the fifth time in six games on their current homestand. With the scored tied 1–1 in the fourth,Andrew Cashner(4–13) gave up a sacrifice fly toMerrifield after loading the bases on two walks and a single. Dozierled off the fifth inning with a 423-foot home run to left field to make it 3-1. The
Oriolespulled within a run in the sixth whenMullinsled off with a double just beyond the reach ofDozierat third, advanced to third on a fly ball and scored onTrey Mancini’s sacrifice fly to the wall in right. TheRoyalsanswered in the bottom of the inning asGallagherhit his first home run of the season. . .
BATTER PITCHER SCORER EVENT TEAM INN RUNS . . .
C. Mullins B. Keller - Home run Orioles 1 1 . . .
H. Dozier A. Cashner W. Merrifield Grounded into DP Royals 1 1 . . .
W. Merrifield A. Cashner B. Goodwin Sac fly Royals 4 2 . . .
[image:2.595.74.250.61.216.2]H. Dozier A. Cashner - Home run Royals 4 3 . . . . . . .
Figure 1: MLB statistics tables and game summary. The tables summarize the performance of the two teams and of individual team members who played as batters and pitchers as well as the most important events (and their actors) in each play. Recurring entities in the summary are boldfaced and colorcoded, singletons are shown in black.
being generated. Our model generates descriptive
texts with a decoder augmented with a memory
celland aprocessorfor each entity. At each time
step in the decoder, the processor computes an up-dated representation of the entity as an interpola-tion between a candidate entity memory and its previous value. Processors are each a gated recur-rent neural network and parameters among them are shared. The model generates text by
hierarchi-cally attending over memory cellsandthe records
corresponding to them.
We report experiments on the benchmark RO
-TOWIRE dataset (Wiseman et al., 2017) which
contains statistics of NBA basketball games paired with human-written summaries. In addition, we
create a new dataset for MLB (see Figure1).
Com-pared to ROTOWIRE, MLB summaries are longer
(approximately by 50%) and the input records are richer and more structured (with the addition of play-by-play). Moreover, the MLB dataset is five times larger in terms of data size (i.e., pairs of ta-bles and game summaries). We compare our entity model against a range of recently proposed neural architectures including an encoder-decoder model
with conditional copy (Wiseman et al.,2017) and
a variant thereof which generates texts while
tak-ing content plans into account (Puduppully et al.,
2019). Our results show that modeling entities
ex-plicitly is beneficial and leads to output which is not only more coherent but also more concise and grammatical across both datasets.
Our contributions in this work are three-fold: a novel entity-aware model for data-to-text genera-tion which is linguistically motivated, yet resource lean (no preprocessing is required, e.g., to extract document plans); a new dataset for data-to-text generation which we hope will encourage further work in this area; a comprehensive evaluation and comparison study which highlights the merits and shortcomings of various recently proposed data-to-text generation models on two datasets.
2 Related Work
The sports domain has attracted considerable at-tention since the early days of generation systems (Robin, 1994; Tanaka-Ishii et al., 1998). Like-wise, a variety of coherence theories have been
de-veloped over the years (e.g.,Mann and Thomson
1988;Grosz et al. 1995) and their principles have found application in many symbolic text
genera-tion systems (e.g.,Scott and de Souza 1990;
(Cavazza et al.,2002;Cavazza and Charles,2005)
and dialogue generation (Walker et al.,2011).
More recently, the benefits of modeling entities explicitly have been demonstrated in various tasks
and neural network models. Ji et al.(2017) make
use of dynamic entity representations for language
modeling. And Clark et al. (2018) extend this
work by adding entity context as input to the
de-coder. Both approaches condition on asingle
en-tity at a time, while we dynamically represent and
condition onmultipleentities in parallel. Kiddon
et al.(2016) make use of fixed entity representa-tions to improve the coverage and coherence of
the output for recipe generation. Bosselut et al.
(2018) model actions and their effects on entities
for the same task. However, in contrast to our work, they keep entity representations fixed during
generation. Henaff et al.(2017) make use of
dy-namic entity representations in machine reading. Entity representations are scored against a query vector to directly predict an output class or com-bined as a weighted sum followed by softmax over the vocabulary. We make use of a similar entity representation model, extend it with hierarchical attention and apply it to data-to text generation. The hierarchical attention mechanism was first
in-troduced inYang et al. (2016) as a way of
learn-ing document-level representations. We apply at-tention over records and subsequently over entity memories.
Several models have been proposed in the last
few years for data-to-text generation (Mei et al.
2016; Lebret et al. 2016; Wiseman et al. 2017, inter alia) based on the very successful
encoder-decoder architecture (Bahdanau et al.,2015).
Vari-ous attempts have also been made to improve these
models, e.g., by adding content selection (
Perez-Beltrachini and Lapata, 2018) and content
plan-ning (Puduppully et al.,2019) mechanisms.
How-ever, we are not aware of any prior work in this area which explicitly handles entities and their generation in discourse context.
3 Background: Encoder-Decoder with Conditional Copy
The input to our model is a table of records (see
Figure 1). Records in turn have features,
repre-sented as{rj,l}Ll=1 whereLis the number of
fea-tures in each record. Examples of feafea-tures are
values (rj,1; e.g., 8.0, Baltimore) or entities (rj,2;
e.g.,Orioles, C. Mullins). The model output y is a
document containing wordsy =y1· · ·y|y|where
|y| is the document length. Following previous
work (Wiseman et al., 2017; Puduppully et al.,
2019), we embed features into vectors, and then
use a multilayer perceptron to obtain a vector
rep-resentationrjfor each record:
rj = ReLU(Wr[rj,1;rj,2;...;rj,L] +br) (1)
where [; ] indicates vector concatenation, Wr ∈
Rn×nL,br ∈Rnare parameters, andReLUis the
rectifier activation function.
Let {ej}|jr=1| denote the output of the encoder.
We use an LSTM decoder to compute the proba-bility of each target word, conditioned on
previ-ously generated words, and onej. In the case of
ROTOWIRE, we follow previous work (Wiseman
et al.,2017;Puduppully et al.,2019) and consider
ej = rj. The first hidden state of the decoder
is initialized by the average of the record vectors,
avg({ej}|jr=1| ).
In the case of MLB, information encoded in
play-by-play is sequential. Recall, that it
doc-uments the most important events in a game in chronological order. To account for this, we
en-code MLB records into {ej}|jr=1| with a
bidirec-tional LSTM. We impose an ordering on records in the box score (i.e., home team followed by away team) which is in turn followed by play-by-play where records are naturally ordered by time. The decoder is initialized with the concatenation of the hidden states of the final step of the encoder.
At time step t, the input to the decoder LSTM
is the embedding of the previously predicted
word yt−1. Letdtdenote the hidden state of the
t-th LSTM unit. We compute attention scoresαt,j
over the encoder output ej and obtain dynamic
context vectorqtas the weighted sum of the
hid-den states of the input:
αt,j ∝exp(d|tWaej)
qt= X
j
αt,jej
dattt = tanh(Wc[dt;qt]) (2)
whereWa ∈ Rn×n,P
jαt,j = 1,Wc ∈Rn
×2n,
anddattt is the attention vector.
The probability of output textyconditioned on
the input tableris modeled as:
pgen(yt|y<t, r)=softmaxyt(Wyd att
Gate
𝑔2,1 𝑔2,2 𝑔2,𝑍 𝑠𝑡,2
𝑑𝑡 𝛼𝑡,2,1 𝛼𝑡,2,2 𝛼𝑡,2,𝑍
𝑠𝑡,1 𝑠𝑡,𝐾
𝑞𝑡
u𝑡,1 u𝑡,2 u𝑡,𝐾 𝑑𝑡
ψ𝑡1
ψ𝑡2
ψ𝑡𝐾
𝑓ϴ
δ𝑡,1
ũ𝑡,1
Entity Memory
u𝑡−1,1
𝑓ϴ
δ𝑡,𝐾
ũ𝑡,𝐾
Gate
u𝑡−1,𝐾
A
B
C
…
…
…
…
[image:4.595.72.527.62.263.2]…
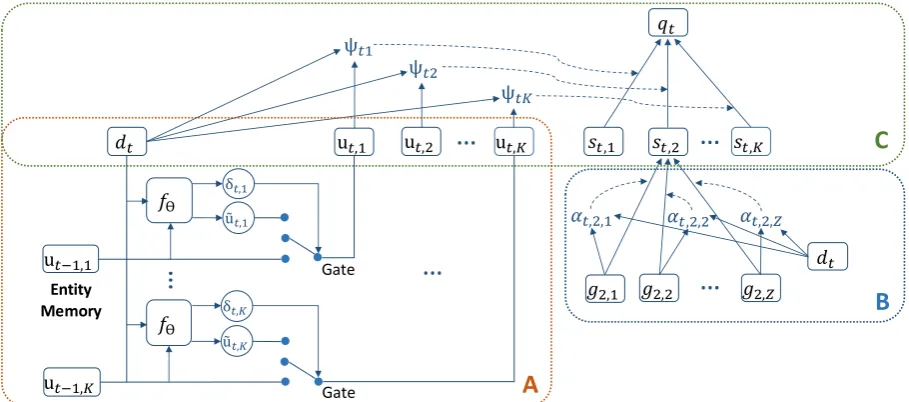
Figure 2: Diagram of entity memory network (block A) and hierarchical attention (blocks B and C). Modulefθ
represents update equations (6)–(8) where θ is the set of trainable parameters. The gate represents the entity memory update (Equation (9)). Block B covers Equations (10) and (11), and block C Equations (12) and (13).
whereWy ∈R|Vy|×n,by ∈R|Vy|are parameters
and|Vy|is the output vocabulary size.
We further augment the decoder with a copy
mechanism i.e., the ability to copyvaluesfrom the
input; copy implies yt = rj,1 for some t and j
(e.g.,Royals, Orioles, 9, 2 in the summary in
Fig-ure1are copied fromr). We use the conditional
copy method proposed in Gulcehre et al. (2016)
where a binary variable is introduced as a switch
gate to indicate whetherytis copied or not.
4 Entity Memory and Hierarchical Attention
We extend the basic model from Section 3 with
entity memory and hierarchical attention. Figure2
provides a schematic overview of our architecture.
4.1 Entity Memory
In order to render the model entity-aware, we
com-putexk as an average of record representation for
each unique entityk(i.e., one ofrj,2values):
xk = X
j
(1[rj,2 =k]rj)/ X
j
1[rj,2 =k] (4)
where1[x]= 1 ifxis true, and 0 otherwise.
We initialize ut=−1,k, the memory
representa-tion of an entity at timet=−1, as:
ut=−1,k=Wixk (5)
whereut=−1,k ∈RpandWi∈Rp×n.
To capture the fact that discourse in descrip-tive texts may shift from one entity to the next, e.g., some entities may be salient in the beginning of the game summary (see Brad Kelly in the text in
Figure1), others only towards the end (see Dozier
in Figure1), and a few throughout (e.g., references
to teams), we update entity representations at each
time step during decoding. We use gateγtto
in-dicate whether there should be an update in the entity representation:
γt=σ(Wddt+bd) (6)
wheret >= 0,σ is the sigmoid function,Wd ∈
Rp×p, andbd∈Rp.
We also compute δt,k, the extent to which the
entity representation should change, and˜ut,k, the
memory of the candidate entity:
δt,k=γtσ(Wedt+be+Wfut−1,k+bf) (7)
˜
ut,k=Wgdt (8)
where denotes element-wise multiplication,
We,∈ Rp×n, Wf ∈ Rp×p, be,bf ∈ Rp, and
γt,δt,k ∈[0,1]p(see block A in Figure2).
An element in gateγtwill have value
approach-ing1if an update in any ut−1,k is required. The
value of an element in gateδt,kwill approach1if
the corresponding value of the element in ut−1,k
changes. Equation (9) computes the update in
memory and the candidate entity memory:
ut,k= (1−δt,k)ut−1,k+δt,k˜ut,k (9)
whereut,krepresents entitykat timet.
Previous work (Henaff et al., 2017; Ji et al.,
2017;Clark et al.,2018) employs a normalization
term overut,k. We empirically found that
normal-ization hurts performance and hence did not in-clude it in our model.
4.2 Hierarchical Attention
We hypothesize that our generator should first fo-cus on entities (e.g., the main players and their teams) and then on the records corresponding to theses entities (e.g, player performance in the game). Our model implements this view of text generation via a hierarchical attention mechanism which we explain below. We also expect that fo-cusing on entities first should improve the preci-sion of the texts we generate as the entity distribu-tion will constrain the probability distribudistribu-tion of records corresponding to each entity.
To better understand the hierarchical attention
mechanism, we can view the encoder outputej as
a 2-dimensional arraygk,z wherek∈[1, K]
rep-resents entities andz ∈ [1, Z]represents records
of entities and there is a one-to-one
correspon-dence between positionsjand k, z. We compute
attention overgk,z, the encoder output, as:
αt,k,z ∝exp(d|tWagk,z) (10)
whereWa ∈ Rn×n,P
zαt,k,z = 1(see block B
in Figure2). We compute the entity context as:
st,k= X
z
αt,k,zgk,z (11)
while attention over entity vectorsut,kis:
Ψt,k∝exp(d|tWhut,k) (12)
withWh ∈Rn×p,PkΨt,k = 1. And the encoder
contextqt(see block C in Figure2) is computed
as follows:
qt=X k
Ψt,kst,k (13)
We feed qt into Equation (2) and
com-putepgen(yt|y<t, r), the probability of generating
output text y conditioned on records r, as shown
in Equation (3).
ROTOWIRE MLB Vocab Size 11.3K 38.9K
# Tokens 1.5M 14.3M
[image:5.595.336.498.61.136.2]# Instances 4.9K 26.3K Avg Length 337.1 542.05 # Record Types 39 53 Avg Records 628 565
Table 1: Vocabulary size, number of tokens, number of instances (i.e., record-summary pairs), average sum-mary length, number of record types and average num-ber of records in ROTOWIREand MLB datasets.
We experimented with feeding P
kΨt,kut,k as
input context along the lines ofClark et al.(2018);
however, results on the development dataset de-graded performance, and we did not pursue this approach further.
5 Training and Inference
Our training objective maximizes the log likeli-hood of output text given an input table of records:
max X
(r,y)∈D
logp(y|r)
whereD is the training set consisting of pairs of
record tables and output game summaries. During inference, we make use of beam search to
approx-imately obtain the best outputyˆamong candidate
outputsy0:
ˆ
y= arg max y0
p(y0|r)
6 Experimental Setup
Data We performed experiments on two
datasets. The first one is ROTOWIRE (Wiseman
et al., 2017) which contains NBA basketball game statistics matched with human-written
summaries. In addition, we created MLB, a
new dataset which contains baseball statistics and corresponding human-authored summaries
obtained from the ESPN website.2Basic statistics
on the two datasets are given in Table 1. As
can be seen, MLB is approximately five times
larger than ROTOWIRE, with richer vocabulary
and longer summaries. For ROTOWIRE, we used
the official training, development, and test splits
of 3,398/727/728 instances. Analogously, for
MLB we created a split of 22,821/1,739/1,744 in-stances. Game summaries in MLB were tokenized
using nltk and hyphenated words were separated. Sentences containing quotes were removed as they included opinions and non-factual statements unrelated to the input tables. Sometimes MLB summaries contain a “Game notes” section with incidental information which was also removed.
For MLB, the value of Lin Equation (1) is 6,
and for ROTOWIRE it is 4. The first four
fea-tures are similar in both datasets and include value (rj,1; e.g.,8.0,Baltimore), entity (rj,2; e.g.,Orioles,
C. Mullins), record type (rj,3; e.g., RBI, R,H) and whether a player is on the home- or away- team
(rj,4). MLB has two additional features which
in-clude the inning of play (rj,5; e.g.,9,7, and-1for
records in the box score), and play index, a unique
play identifier for a set of records in a play (rj,6;
e.g.,0,10, and -1for records in the box score).
Information Extraction For automatic evalua-tion, we make use of the Information Extraction
(IE) approach proposed inWiseman et al.(2017).
The idea is to use a fairly accurate IE tool to extract relations from gold summaries and model sum-maries and then quantify the extent to which the
extracted relations align or diverge (see Section7
for the specific metrics we use).
The IE system first identifies candidate entities (i.e., players, teams) and values (i.e., numbers), and given an “entity, value” pair it predicts the type
of relation. For example, in ROTOWIRE, the
rela-tion for the pair “Kobe Bryant, 40” isPTS.
Train-ing data for the IE system is obtained automat-ically by matching entity-value pairs from sum-mary sentences against record types. The IE sys-tem has an ensemble architecture which combines convolutional and bidirectional LSTM models.
We reused the updated IE models from
Pudup-pully et al. (2019) for ROTOWIRE3 and trained our own IE system for MLB. Box and line scores
in MLB are identical in format to ROTOWIRE
and pose no particular problems to the IE system. However, it is difficult to extract information from play-by-play and match it against the input tables.
Consider the sentencesRyan O’Hearn homered or
Keller gave up a home runfrom Figure1where we can identify entities (Ryan O’Hearn, Keller) and record types (home-run-batter, home-run-pitcher) but no specific values. We created a dummy value of -1 for such cases and the IE system was trained to predict the record type of entity value pairs such as (Ryan O’Hearn, -1) or (Keller, -1). Moreover,
3https://github.com/ratishsp/data2text-1/
the IE system does not capture attributes such as inning and team scores in play-by-play as it is difficult to deterministically match these against corresponding spans in text. The IE system thus would not be able to identify any records in the
snippettied 1–1 in the fourth. On MLB, the
sys-tem achieved 83.4% precision and 66.7% recall (on held out data). We note that designing a highly accurate IE module for MLB is in itself a research challenge and outside the scope of this paper.
In order to compare our model against
Pudup-pully et al.(2019), we must have access to content
plans which we extracted from ROTOWIRE and
MLB by running the IE tool on gold summaries (training set). We expect the relatively low IE re-call on MLB to disadvantage their model which relies on accurate content plans.
Training Configuration Model hyperparame-ters were tuned on the development set. We used
the Adagrad optimizer (Duchi et al., 2011) with
an initial learning rate of 0.15, decayed by 0.97
for every epoch after the 4th epoch. We used
truncated BPTT (Williams and Peng, 1990) of
length 100 and made use of input feeding (Luong
et al.,2015). We summarize the hyperparameters
of the ROTOWIRE and MLB models in the
Ap-pendix. All models were implemented on a fork
of OpenNMT-py (Klein et al.,2017).
System Comparison We compared our entity model against the following systems:
TEMPL is a template-based generator; we reused
TEMPL fromWiseman et al.(2017) for RO
-TOWIREand created a new system for MLB.
The latter consists of an opening sentence about the two teams playing the game. It then describes statistics of pitchers (innings pitched, runs and hits given etc.) followed by a description of play-by-play (home run, sin-gle, double, triple etc.).
ED+CC is the encoder-decoder model with
con-ditional copy from Section3and the best
per-forming system inWiseman et al.(2017).
NCP+CC is the best performing system in
Puduppully et al. (2019); it generates con-tent plans by making use of pointer networks (Vinyals et al.,2015) to point to the inputej;
RW RG CS CO BLEU
# P% P% R% DLD%
TEMPL 54.23 99.94 26.99 58.16 14.92 8.46 WS-2017 23.72 74.80 29.49 36.18 15.42 14.19 NCP+CC 34.28 87.47 34.18 51.22 18.58 16.50
ENT 30.11 92.69 38.64 48.51 20.17 16.12
MLB RG CS CO BLEU
# P% P% R% DLD%
TEMPL 59.93 97.96 22.82 68.46 10.64 3.81 ED+CC 18.69 92.19 62.01 50.12 25.44 9.69 NCP+CC 17.93 88.11 60.48 55.13 26.71 9.68 ENT 21.35 88.29 58.35 61.14 24.51 11.51
Table 2: Evaluation on ROTOWIRE(RW) and MLB test sets using relation generation (RG) count (#) and precision (P%), content selection (CS) precision (P%) and recall (R%), content ordering (CO) in normalized Damerau-Levenshtein distance (DLD%), and BLEU.
7 Results
Automatic Evaluation We first discuss the re-sults of automatic evaluation using the metrics
de-fined inWiseman et al.(2017). Letyˆbe the gold
output and y the model output. Relation
Gen-eration measures how factual y is compared to
input r. Specifically, it measures the precision
and number of relations extracted from y which
are also found in r. Content Selection measures
the precision and recall of relations between yˆ
andy. Content Orderingmeasures the
Damerau-Levenshtein distance between relations in y and
relations in yˆ. In addition, we also report BLEU
(Papineni et al.,2002) with the gold summaries as reference.
Table2(top) summarizes our results on the RO
-TOWIRE test set (results on the development set
are available in the Appendix). We report results for our dynamic entity memory model (ENT),
the best system of Wiseman et al. (2017)
(WS-2017) which is an encoder-decoder model with
conditional copy, and NCP+CC (Puduppully et al.,
2019). We see that ENT achieves scores
compara-ble to NCP+CC, but performs better on the met-rics of RG precision, CS precision, and CO. ENT achieves substantially higher scores in CS preci-sion compared to WS-2017 and NCP+CC, with-out any planning component; CS recall is worse for ENT compared to NCP+CC mainly because the latter model is trained to first create a content plan with good coverage of what to say.
Table 2 (bottom) also presents our results on
MLB (test set). Note that ED+CC is a
reim-plementation of Wiseman et al.’s (2017)
encoder-RW RG CS CO BLEU
# P% P% R% DLD%
ED+CC 22.68 79.40 29.96 34.11 16.00 14.00 +Hier 30.76 93.02 33.99 44.79 19.03 14.19 +Dyn 27.93 90.85 34.19 42.27 18.47 15.40 +Gate 31.84 91.97 36.65 48.18 19.68 15.97
MLB RG CS CO BLEU
# P% P% R% DLD%
[image:7.595.74.291.63.196.2]ED+CC 18.69 92.65 62.29 51.36 25.93 9.55 +Hier 19.02 93.71 62.84 52.12 25.72 10.38 +Dyn 20.28 89.19 58.19 58.94 24.49 10.85 +Gate 21.32 88.16 57.36 61.50 24.87 11.13
Table 3: Ablation results on ROTOWIRE (RW) and MLB development set using relation generation (RG) count (#) and precision (P%), content selection (CS) precision (P%) and recall (R%), content ordering (CO) in normalized Damerau-Levenshtein distance (DLD%), and BLEU.
decoder model (with conditional copy) on MLB. We see that ENT achieves highest BLEU amongst all models and highest CS recall and RG count amongst neural models. The RG precision of ENT is lower than ED+CC. Inspection of model out-put revealed that on MLB, ED+CC tends to fo-cus on one or two players getting most of the facts about them right, whereas ENT sometimes gets the coreference wrong, and thus lower RG precision. The TEMPL system scores highest on RG precision and count, and CS recall on both datasets. This is because TEMPL can make use of domain knowledge which is not available to the neural models. TEMPL performs poorly on MLB in terms of BLEU, in fact it is considerably worse
compared to the similar template system on RO
-TOWIRE(see Table2). This suggests that the task
of creating MLB game summaries is hard, even for a template system which does not perform any sophisticated generation.
Ablation Experiments We further examined how individual model components contribute to the quality of the generated summaries. To as-sess the impact of hierarchical attention
(Sec-tion4.2) over ED+CC, we report the performance
of a stripped-down variant of our model without dynamic entity memory. Specifically, the entity
memory was kept static and set to ut=−1,k (see
Equation (5)). In this model, attention over entity
vectors is:
Ψt,k ∝exp(d|tWhut=−1,k) (14)
[image:7.595.310.524.63.197.2]gate γt (i.e., we set γt to one) and Equation (7) then becomes:
δt,k=σ(Wedt+be+Wfut−1,k+bf) (15)
Finally, we obtain our final ENT model, by incor-porating the update gate mechanism.
The results of the ablation study are shown
in Table 3. We compare ED+CC against
vari-ants “+Hier”, “+Dyn” and “+Gate” corresponding to successively adding hierarchical attention, dy-namic memory, and the update gate mechanism. On both datasets, hierarchical attention, improves relation generation, content selection, and BLEU. Dynamic memory and the update gate brings fur-ther improvements to content selection and BLEU. Because it conditions on entities, ENT is able to produce text displaying nominal coreference which is absent from the outputs of ED+CC and
WS-2017. We present an example in Table4(and
in the Appendix) where entities Dwight Howard
andJames Hardenare introduced and then later
re-ferred to asHoward andHarden. We also see that
while generating the last sentence about the next game, ENT is able to switch the focus of attention
from one team (Rockets) to the other (Nuggets),
while NCP+CC verbalisesNuggetstwice.
Human-Based Evaluation Following earlier
work (Wiseman et al., 2017; Puduppully et al.,
2019), we also evaluated our model by asking
hu-mans to rate its output in terms of relation gen-eration, coherence, grammaticality, and concise-ness. Our studies were conducted on the
Ama-zon Mechanical Turk platform. For ROTOWIRE,
we compared ENT against NCP+CC, Gold, and TEMPL. We did not compare against WS-2017
or ED+CC, since prior work (Puduppully et al.,
2019) has shown that NCP+CC is superior to these
models in terms of automatic and human-based evaluation. For MLB, we compared ENT against NCP+CC, ED+CC, Gold, and TEMPL.
In the first study, participants were presented with sentences randomly selected from the game summary (test set) together with corresponding box and line score tables and were asked to count supporting and contradicting facts in these tences. We evaluated 30 summaries and 4
sen-tences per summary for each of ROTOWIRE and
MLB. We elicited 5 responses per summary.
As shown in Table 5, on ROTOWIRE ENT
yields a comparable number of supporting and contradicting facts to NCP+CC (the difference is
TheHouston Rockets(18–5) defeated theDenver Nuggets (10–13) 108–96 on Tuesday at the Toyota Center in Hous-ton. The Rocketshad a strong first half where they out– scored. . . TheRocketswere led byDonatas Motiejunas, who scored a game–high of 25 points. . . James Harden
also played a factor in the win, as he went 7–for. . . Coming off the bench,Donatas Motiejunashad a big game and fin-ished with 25 points. . . The only other player to reach dou-ble figures in points wasArron Afflalo, who came off the bench for 12 points. . . Coming off the bench,Arron Af-flalochipped in with 12 points. . .TheNuggets’ next game will be on the road against the Boston Celtics on Friday, while theNuggetswill travel to Boston to play the Celtics on Wednesday.
TheHouston Rockets(18–5) defeated theDenver Nuggets
(10–13) 108–96 on Monday at the Toyota Center in Hous-ton. TheRocketswere the superior shooters in this game, going . . . The Rockets were led by the duo ofDwight HowardandJames Harden. Howardshot 9–for–11 from the field and. . . Harden on the other hand recorded 24 points (7–20 FG, 2–5 3Pt, 8–9 FT), 10 rebounds and 10 assists, The only other Nugget to reach double figures in points wasArron Afflalo, who finished with 12 points (4– 17 FG,. . . The Rockets’ next game will be on the road against the New Orleans Pelicans on Wednesday, while the
Nuggetswill travel to Los Angeles to play the Clippers on
Friday.
Table 4: Examples of model output for NCP+CC (top) and ENT (bottom) on ROTOWIRE. Recurring entities in the summaries are boldfaced and colorcoded, single-tons are shown in black.
not statistically significant). TEMPL has the high-est number of supporting facts, even relative to gold summaries, and very few contradicting facts. This is expected as TEMPL output is mostly fac-tual, it essentially parrots statistics from the tables. On MLB, ENT yields a number of supporting facts comparable to Gold and NCP+CC, but signifi-cantly lower than ED+CC and TEMPL. Contra-dicting facts are significantly lower for ENT com-pared to NCP+CC, but comparable to ED+CC and higher than TEMPL and Gold.
We also evaluated the quality of the generated
summaries. Following earlier work (Puduppully
et al., 2019), we presented participants with two summaries at a time and asked them to choose
which one is better in terms of Grammaticality
(is the summary written in well-formed English?),
Coherence (do the sentences in summary follow
a coherent discourse?), andConciseness(does the
summary tend to repeat the same content?) We di-vided the four competing systems (Gold, TEMPL, NCP+CC, and ENT) into six pairs of summaries
for ROTOWIRE and the five competing systems
(Gold, TEMPL, ED+CC, NCP+CC, and ENT) into ten pairs for MLB. We used Best-Worst
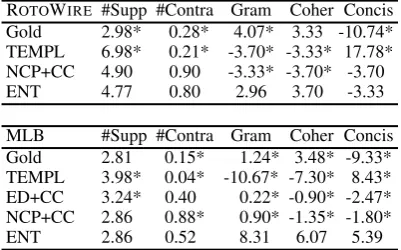
ROTOWIRE #Supp #Contra Gram Coher Concis Gold 2.98* 0.28* 4.07* 3.33 -10.74* TEMPL 6.98* 0.21* -3.70* -3.33* 17.78* NCP+CC 4.90 0.90 -3.33* -3.70* -3.70 ENT 4.77 0.80 2.96 3.70 -3.33
[image:9.595.81.282.63.188.2]MLB #Supp #Contra Gram Coher Concis Gold 2.81 0.15* 1.24* 3.48* -9.33* TEMPL 3.98* 0.04* -10.67* -7.30* 8.43* ED+CC 3.24* 0.40 0.22* -0.90* -2.47* NCP+CC 2.86 0.88* 0.90* -1.35* -1.80* ENT 2.86 0.52 8.31 6.07 5.39
Table 5: Average number of supporting and contra-dicting facts in game summaries andbest-worst scaling
evaluation (higher is better) on ROTOWIREand MLB datasets. Systems significantly different from ENT are marked with an asterisk * (using a one-way ANOVA with posthoc Tukey HSD tests;p≤0.05).
.
et al., 2015), a more reliable alternative to rating scales. The score of a system is computed as the number of times it was rated best minus the
num-ber of times is rated worst (Orme,2009). Scores
range from −100 (absolutely worst) to 100
(ab-solutely best). We elicited judgments for 30 test
summaries for ROTOWIREand MLB; each
sum-mary was rated by 3 participants.
As shown in Table 5, on ROTOWIRE Gold
receives highest scores in terms of
Grammati-cality, which is not unexpected. ENT comes
close, achieving better scores than NCP+CC and TEMPL, even though our model only enhances the coherence of the output. Participants find ENT on par with Gold on Coherence and better than NCP+CC and TEMPL whose output is stilted and exhibits no variability. In terms of Conciseness, TEMPL is rated best, which is expected since it does not contain any duplication, the presented facts are mutually exclusive; ENT is comparable to NCP+CC and better than Gold.
As far as MLB is concerned, ENT achieves highest scores on Grammaticality and Coherence. It is rated high on Conciseness also, second only to TEMPL whose scores are lowest on Grammatical-ity and Coherence. Perhaps surprisingly, Gold is rated lower than ENT on all three metrics; we hy-pothesize that participants find Gold’s output too verbose compared to the other systems. Recall that MLB gold summaries are relative long, the
aver-age length is 542 tokens compared to ROTOWIRE
whose summaries are almost half as long (see
Ta-ble 1). The average length of output summaries
for ENT is 327 tokens.
Taken together, our results show that ENT
per-forms better than comparison systems on both RO
-TOWIREand MLB. Compared to NCP+CC, it is
conceptually simpler and more portable, as it does not rely on content plans which have to be ex-tracted via an IE system which must be reconfig-ured for new datasets and domains.
8 Conclusions
In this work we presented a neural model for data-to-text generation which creates entity-specific representations (that are dynamically updated) and generates text using hierarchical attention over the input table and entity memory. Extensive auto-matic and human evaluation on two benchmarks,
ROTOWIRE and the newly created MLB, show
that our model outperforms competitive baselines and manages to generate plausible output which humans find coherent, concise, and factually cor-rect. However, we have only scratched the sur-face; future improvements involve integrating con-tent planning with entity modeling, placing more emphasis on play-by-play, and exploiting depen-dencies across input tables.
Acknowledgments
We would like to thank Adam Lopez for helpful discussions. We acknowledge the financial sup-port of the European Research Council (Lapata; award number 681760).
References
Dzmitry Bahdanau, Kyunghyun Cho, and Yoshua Ben-gio. 2015. Neural machine translation by jointly learning to align and translate. In Proceedings of the 3rd International Conference on Learning Rep-resentations, ICLR 2015, San Diego, California.
Antoine Bosselut, Omer Levy, Ari Holtzman, Corin Ennis, Dieter Fox, and Yejin Choi. 2018. Simulat-ing action dynamics with neural process networks. InProceedings of the 6th International Conference on Learning Representations, ICLR 2018, Vancou-ver, Canada.
Marc Cavazza and Fred Charles. 2005. Dialogue gen-eration in character-based interactive storytelling. In
Proceedings of the 1st Artificial Intelligence and In-teractive Digital Entertainment Conference, pages 21–26, Marina del Rey, California.
Wallace L. Chafe. 1976. Givenness, contrastiveness, definiteness, subjects, topics, a nd point of view. In Charles N. Li, editor,Subject and topic, pages 25– 55. Academic Press, New York.
Elizabeth Clark, Yangfeng Ji, and Noah A. Smith. 2018. Neural text generation in stories using en-tity representations as context. In Proceedings of the 2018 Conference of the North American Chap-ter of the Association for Computational Linguistics: Human Language Technologies, Volume 1 (Long Pa-pers), pages 2250–2260, New Orleans, Louisiana.
Herbert H. Clark and Susan E. Haviland. 1977. Com-prehension and the given- new conract. In Roy O. Freedle, editor, Discourse production and compre-hension, pages 1–39. Ablex, Norwood, NewJersey.
John C. Duchi, Elad Hazan, and Yoram Singer. 2011.
Adaptive subgradient methods for online learning and stochastic optimization. Journal of Machine Learning Research, 12:2121–2159.
Albert Gatt and Emiel Krahmer. 2018. Survey of the state of the art in natural language generation: Core tasks, applications and evaluation. J. Artif. Intell. Res., 61:65–170.
Barbara J. Grosz, Aravind K. Joshi, and Scott Wein-stein. 1995. Centering: A framework for model-ing the local coherence of discourse. Computational Linguistics, 21(2):203–225.
Caglar Gulcehre, Sungjin Ahn, Ramesh Nallapati, Bowen Zhou, and Yoshua Bengio. 2016. Pointing the unknown words. InProceedings of the 54th An-nual Meeting of the Association for Computational Linguistics (Volume 1: Long Papers), pages 140– 149, Berlin, Germany.
M. A. K. Halliday and Ruqaiya Hasan. 1976. Cohesion in English. Longman, London.
Mikael Henaff, Jason Weston, Arthur Szlam, Antoine Bordes, and Yann LeCun. 2017.Tracking the world state with recurrent entity networks. In Proceed-ings of the 5th International Conference on Learning Representations, ICLR 2017, Toulon, France. Open-Review.net.
Yangfeng Ji, Chenhao Tan, Sebastian Martschat, Yejin Choi, and Noah A. Smith. 2017. Dynamic entity representations in neural language models. In Pro-ceedings of the 2017 Conference on Empirical Meth-ods in Natural Language Processing, pages 1831– 1840, Copenhagen, Denmark.
Nikiforos Karamanis, Massimo Poesio, Chris Mellish, and Jon Oberlander. 2004. Evaluating centering-based metrics of coherence. InProceedings of the 42nd Annual Meeting of the Association for Compu-tational Linguistics (ACL-04).
Lauri Karttunen. 1976. Discourse referents. In James D. McCawley, editor,Syntax and Semantics: Notes from the Linguistic Underground, volume 7, pages 363–86. Academic Press, New York.
Rodger Kibble and Richard Power. 2004. Optimizing referential coherence in text generation. Computa-tional Linguistics, 30(4):401–416.
Chlo´e Kiddon, Luke Zettlemoyer, and Yejin Choi. 2016.Globally coherent text generation with neural checklist models. InProceedings of the 2016 Con-ference on Empirical Methods in Natural Language Processing, pages 329–339, Austin, Texas.
Guillaume Klein, Yoon Kim, Yuntian Deng, Jean Senellart, and Alexander Rush. 2017. Opennmt: Open-source toolkit for neural machine translation. In Proceedings of ACL 2017, System Demonstra-tions, pages 67–72, Vancouver, Canada.
Susumu Kuno. 1972. Functional sentence perspective.
Linguistic Inquiry, 3:269–320.
R´emi Lebret, David Grangier, and Michael Auli. 2016.
Neural text generation from structured data with ap-plication to the biography domain. In Proceed-ings of the 2016 Conference on Empirical Methods in Natural Language Processing, pages 1203–1213, Austin, Texas.
Jordan J Louviere, Terry N Flynn, and Anthony Al-fred John Marley. 2015. Best-worst scaling: The-ory, methods and applications. Cambridge Univer-sity Press.
Jordan J Louviere and George G Woodworth. 1991. Best-worst scaling: A model for the largest differ-ence judgments. University of Alberta: Working Pa-per.
Thang Luong, Hieu Pham, and Christopher D. Man-ning. 2015. Effective approaches to attention-based neural machine translation. InProceedings of the 2015 Conference on Empirical Methods in Natu-ral Language Processing, pages 1412–1421, Lisbon, Portugal.
William C. Mann and Sandra A. Thomson. 1988. Rhetorical structure theory. Text, 8(3):243–281.
Hongyuan Mei, Mohit Bansal, and Matthew R. Walter. 2016. What to talk about and how? selective gener-ation using lstms with coarse-to-fine alignment. In
Proceedings of the 2016 Conference of the North American Chapter of the Association for Computa-tional Linguistics: Human Language Technologies, pages 720–730, San Diego, California.
Bryan Orme. 2009. Maxdiff analysis: Simple count-ing, individual-level logit, and hb. Sawtooth Soft-ware.
Laura Perez-Beltrachini and Mirella Lapata. 2018.
Bootstrapping generators from noisy data. In Pro-ceedings of the 2018 Conference of the North Amer-ican Chapter of the Association for Computational Linguistics: Human Language Technologies, Vol-ume 1 (Long Papers), pages 1516–1527, New Or-leans, Louisiana.
Ellen Prince. 1981. Toward a taxonomy of given-new information. In Peter Cole, editor, Radical Pragmatics, pages 223–255. Academic Press, New York/London.
Ratish Puduppully, Li Dong, and Mirella Lapata. 2019.
Data-to-text generation with content selection and planning. InProceedings of the 33rd AAAI Confer-ence on Artificial IntelligConfer-ence, Honolulu, Hawaii.
Ehud Reiter and Robert Dale. 1997. Building applied natural language generation systems. Natural Lan-guage Engineering, 3(1):57–87.
Ehud Reiter and Robert Dale. 2000. Building natural language generation systems. Cambridge Univer-sity Press, New York, NY.
Jacques Robin. 1994. Revision-based generation of Natural Language Summaries providing historical Background. Ph.D. thesis, Ph. D. thesis, Columbia University.
Donia Scott and Clarisse Sieckenius de Souza. 1990. Getting the message across in RST-based text gen-eration. In Robert Dale, Chris Mellish, and Michael Zock, editors, Current Research in Natural Lan-guage Generation, pages 47–73. Academic Press, New York.
Kumiko Tanaka-Ishii, Koiti Hasida, and Itsuki Noda. 1998. Reactive content selection in the generation of real-time soccer commentary. InProceedings of the 36th Annual Meeting of the Association for Compu-tational Linguistics and 17th International Confer-ence on Computational Linguistics, Volume 2, pages 1282–1288, Montreal, Quebec, Canada.
Oriol Vinyals, Meire Fortunato, and Navdeep Jaitly. 2015. Pointer networks. In C. Cortes, N. D. Lawrence, D. D. Lee, M. Sugiyama, and R. Garnett, editors,Advances in Neural Information Processing Systems 28, pages 2692–2700. Curran Associates, Inc.
Marilyn A Walker, Ricky Grant, Jennifer Sawyer, Grace I Lin, Noah Wardrip-Fruin, and Michael Buell. 2011. Perceived or not perceived: Film character models for expressive NLG. In Inter-national Conference on Interactive Digital Story-telling, pages 109–121. Springer.
Ronald J. Williams and Jing Peng. 1990. An efficient gradient-based algorithm for on-line training of re-current network trajectories. Neural Computation, 2(4):490–501.
Sam Wiseman, Stuart Shieber, and Alexander Rush. 2017. Challenges in data-to-document generation. In Proceedings of the 2017 Conference on Empiri-cal Methods in Natural Language Processing, pages 2253–2263, Copenhagen, Denmark.
Zichao Yang, Diyi Yang, Chris Dyer, Xiaodong He, Alex Smola, and Eduard Hovy. 2016. Hierarchi-cal attention networks for document classification. InProceedings of the 2016 Conference of the North American Chapter of the Association for Computa-tional Linguistics: Human Language Technologies, pages 1480–1489, San Diego, California.
A Appendix
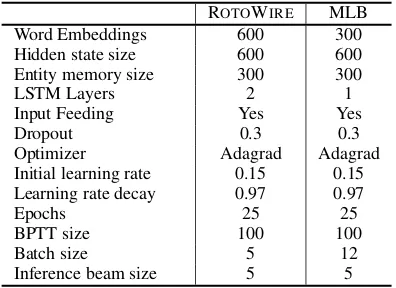
Hyperparameters Table 6 contains the
hyper-parameters used for our ENT model on the RO
-TOWIREand MLB datasets.
Results on the Development Set Table7 (top)
shows results on the ROTOWIREdevelopment set
for our dynamic entity memory model (ENT), the
best system ofWiseman et al.(2017) (WS-2017)
which is an encoder-decoder model with con-ditional copy, the template generator (TEMPL), our implementation of encoder-decoder model with conditional copy (ED+CC), and NCP+CC (Puduppully et al., 2019). We see that ENT achieves scores comparable to NCP+CC, but per-forms better on the metrics of RG precision, CS
precision, and CO. Table7(bottom) also presents
our results on MLB. ENT achieves highest BLEU amongst all models and highest CS recall and RG count amongst neural models.
Qualitative Examples Tables 8 and 9 contain
examples of model output for ROTOWIRE and
ROTOWIRE MLB
Word Embeddings 600 300
Hidden state size 600 600 Entity memory size 300 300
LSTM Layers 2 1
Input Feeding Yes Yes
Dropout 0.3 0.3
Optimizer Adagrad Adagrad Initial learning rate 0.15 0.15 Learning rate decay 0.97 0.97
Epochs 25 25
BPTT size 100 100
Batch size 5 12
[image:12.595.299.516.95.242.2]Inference beam size 5 5
Table 6: Hyperparameters for ROTOWIREand MLB.
RW RG CS CO BLEU
# P% P% R% DLD%
TEMPL 54.29 99.92 26.61 59.16 14.42 8.51 WS-2017 23.95 75.10 28.11 35.86 15.33 14.57 ED+CC 22.68 79.40 29.96 34.11 16.00 14.00 NCP+CC 33.88 87.51 33.52 51.21 18.57 16.19 ENT 31.84 91.97 36.65 48.18 19.68 15.97
MLB RG CS CO BLEU
# P% P% R% DLD%
TEMPL 59.93 97.96 22.82 68.46 10.64 3.81 ED+CC 18.69 92.65 62.29 51.36 25.93 9.55 NCP+CC 17.70 88.01 59.76 55.23 26.87 9.43 ENT 21.32 88.16 57.36 61.50 24.87 11.13
Table 7: Results on ROTOWIRE(RW) and MLB de-velopment sets using relation generation (RG) count (#) and precision (P%), content selection (CS) preci-sion (P%) and recall (R%), content ordering (CO) in normalized Damerau-Levenshtein distance (DLD%), and BLEU.
System Summary
Template TheAtlanta Hawks(44–30) defeated theDetroit Pistons(39–35) 112–95.Paul Millsapscored 23 points (8–13 FG, 3–4 3PT, 4–5 FT) to go with 9 rebounds.Tobias Harrisscored 21 points (10–20 FG, 1–3 3PT, 0–0 FT) to go with 10 rebounds. Andre Drummondscored 19 points (7–11 FG, 0–0 3PT, 5–9 FT) to go with 17 rebounds. Kent Bazemorescored 17 points (7–9 FG, 3–5 3PT, 0–0 FT) to go with 4 rebounds.
Aron Baynesscored 15 points (5–6 FG, 0–0 3PT, 5–6 FT) to go with 7 rebounds. Al Horfordscored 13 points (6–15 FG, 1–5 3PT, 0–0 FT) to go with 5 rebounds. TheAtlanta Hawks’ next game will be at home against the Dallas Mavericks, while theDetroit Pistonswill travel to play the Bulls.
NCP+CC TheAtlanta Hawks(44–30) defeated theDetroit Pistons(39–35) 112–95 on Wednesday at the Palace of Auburn Hills. TheHawkscame into this game riding a three–game losing streak and it was clear they did n’t have it all on the floor.Paul Millsapled the way for theHawkswith 23 points (8–13 FG, 3–4 3Pt, 4–5 FT), along with nine rebounds, five assists and four steals, in 33 minutes.Al Horfordchipped in 13 points (6–15 FG, 1–5 3Pt), andKent Bazemorechipped in 17 points on 7–9 shooting, including 3–5 from deep.
Kyle Korverchipped in 12 points (5–10 FG, 1–5 3Pt, 1–1 FT) and three rebounds in 29 minutes, while
Tobias Harrischipped in 21 points (10–20 FG, 1–3 3Pt), 10 rebounds and five assists.Tobias Drummond
had a double–double of his own with 19 points (7–11 FG, 5–9 FT) and 17 rebounds, along with two blocked shots, in 33 minutes.Andre Drummondhad a double–double of his own, with 19 points (7–11 FG, 5–9 FT) and 17 rebounds, along with two blocked shots. The only other player to score in double digits for
DetroitwasAndre Drummond, who finished with 19 points (7–11 FG, 5–9 FT) and 17 rebounds, along with two blocked shots. ThePistons’ next game will be on the road against the Cleveland Cavaliers on Friday, while thePistonswill travel to Minnesota to play the Timberwolves on Wednesday.
[image:12.595.84.282.98.242.2]ENT TheAtlanta Hawks(44–30) defeated theDetroit Pistons(39–35) 112–95 on Monday at the Palace of Auburn Hills. TheHawksgot off to a quick start in this one, out–scoring thePistons27–15 in the first quarter alone. TheHawkswere the superior shooters in this game, going 45 percent from the field and 38 percent from the three–point line, while thePistonswent 39 percent from the floor and just 24 percent from beyond the arc. TheHawkswere led by the duo ofPaul MillsapandAndre Drummond.Millsapfinished with 23 points (8–13 FG, 3–4 3Pt, 4–5 FT), nine rebounds and four blocked shots, whileDrummondhad 19 points (7–11 FG, 5–9 FT), 17 rebounds and two blocked shots. It was his second double–double in a row, as he’s combined for 45 points and 19 rebounds over his last two games. He’s now averaging 15 points and 7 rebounds on the season. Jeff Teaguewas the other starter to reach double figures in points, as he finished with 12 points (3–13 FG, 2–3 3Pt, 4–4 FT) and 12 assists. TheHawks’ next game will be at home against the Cleveland Cavaliers on Friday, while thePistonswill travel to Los Angeles to play the Clippers on Friday.
[image:12.595.81.516.346.680.2]System Summary
Template TheTampa Bay Raysdefeated theOakland Athletics13–4. Jason Isringhausen(0–0) allowed 0 runs, 1 hits and 0 walks in 1 innings.Jeff Niemann(4–3) allowed 4 runs, 8 hits and 0 walks in 8 innings.Sean Gallagher(1–2) allowed 9 runs, 3 hits and 5 walks in 2 1/3 innings.Kevin Cameron(0–0) allowed 0 runs, 0 hits and 1 walks in 2 innings. Gio Gonzalez(0–0) allowed 4 runs, 6 hits and 3 walks in 3 2/3 innings.
Jason Bartletthit 2 RBI single in the first. Orlando Cabrerahit 1 RBI homer in the third Athletics.
Akinori Iwamurahit 2 RBI single in the third. Jason Bartlett hit 1 RBI triple in the fifth. Akinori Iwamurahit 1 RBI single in the fifth. Jason Bartletthit 2 RBI single in the sixth. Jack Custhit 2 RBI homer in the eighth Athletics.
ED+CC ST. PETERSBURG, Fla.—Jason Bartletthad three hits and drove in five runs, and theTampa Bay Raysbeat theOakland Athletics13–4 on Tuesday night. Bartletthit a two–run single during a six–run first inning offGio Gonzalez(1–2), who gave up nine runs, three hits and three walks in 2 1/3 innings.
Orlando Cabrerahit a solo homer in the third for theA’s, who have lost four of five.Orlando Cabrera
hit a solo homer for theA’s, who have lost four of five. Orlando Cabrerahit a solo homer for theA’s, who have lost four of five.Jack Custhit a two–run homer in the eighth for theA’s, who have lost four of five. Orlando Cabrerahit a solo homer for theA’s, who have lost four of five. Orlando Cabrerahit a solo homer for theA’s, who have lost three of four.Orlando Cabrerahit a solo homer in the third for the
A’s, who have lost four of five. Orlando Cabrerahit a solo homer in the third for theA’s, who have lost three straight and five of six.Gallagher(1–2) gave up nine runs, four earned, and six hits in 2 1/3 innings. He walked three and struck out six.Gallagher(1–2) gave up nine runs, four earned, and six hits in 2 1/3 innings. He walked three and struck out six.Custhit a two–run homer in the eighth.
NCP+CC ST. PETERSBURG, Fla.— TheTampa Bay Rays got a big boost fromJason Bartlett’s grand slam.
Bartlettdrove in five runs,Jason Bartletthad five RBIs,Jason Bartletthad five RBIs and theRaysbeat
theOakland Athletics13–4 on Friday night. Jeff Niemann(4–3) allowed four runs, three earned, and
eight hits in eight innings. Sean Gallagher(1–2) gave up a career–high nine runs in 2 1/3 innings. Jack Custhit a two–run homer in the seventh andJack Custadded a two–run homer for the A’s, who have lost four of five.Tampa Bayhas lost four of five. TheRayshave lost four of five.Tampa Bayhas lost four of five. TheRayshave lost four of five.Oaklandhas lost four of five. TheRayshave lost four of five.Tampa Bayhas lost four of five. TheRayshave lost four of five.Tampa Bayhas lost five of six. TheRayshave lost four of five.Tampa Bayhas lost five of six. TheRayshave lost four of five.Tampa Bayhas lost five of six overall.Oaklandhas lost five of six. TheRayshave lost four of five. Tampa Bayhas lost four of five.Oaklandhas lost four of five.Oaklandhas lost five of six. TheRayshave lost four of five.Tampa Bayhas lost four of five.Oaklandhas lost four of five.Oaklandhas lost five of six.Oaklandhas lost five of six.
ENT ST. PETERSBURG, Fla.—Jason Bartlettand the Tampa Bay Rays finally found a way to beat the
Oakland Athletics.Bartletthad a career–high five RBIs,Jeff Niemannpitched eight strong innings and theRaysbeat theOakland Athletics13–4 on Tuesday night.Bartletthad a two–run single in the first and added a two–run single in the third to help theRaystake a 6–1 lead. Bartletthad a two–run single in the third and a two–run single in the sixth.Jack Custhit a two–run homer in the eighth for theA’s, who have won five of six. TheA’sscored six runs offSean Gallagher(1–2), who gave up a career–high nine runs— seven earned— and three hits in 2 1/3 innings.Niemann(4–3) gave up four runs, three earned, and eight hits in eight innings. The right–hander struck out three and did not walk a batter for the second time this season. The right–hander is 4–0 in six career starts against theA’s. Orlando Cabrerahit a solo homer in the third for theA’s, who have lost four of five. Oakland starterGio Gonzalezgave up four runs and six hits in 3 2/3 innings. The right–hander struck out six and walked three. The right–hander was coming off a 1–0 loss to theA’sin his previous start, when he gave up six runs in 4 1/3 innings of a 10–0 loss to the
[image:13.595.80.517.143.641.2]A’s. TheA’stook a 1–0 lead in the first whenBen Zobristdrew a bases–loaded walk andBartletthad a two–run single.