1
The many dimensions of algorithmic fairness in educational applications
Anastassia Loukina, Nitin Madnani, Klaus Zechner Educational Testing Service
Princeton, NJ, USA
aloukina,nmadnani,[email protected]
Abstract
The issues of algorithmic fairness and bias have recently featured prominently in many publica-tions highlighting the fact that training the algo-rithms for maximum performance may often re-sult in predictions that are biased against vari-ous groups. Educational applications based on NLP and speech processing technologies often combine multiple complex machine learning algo-rithms and are thus vulnerable to the same sources of bias as other machine learning systems. Yet such systems can have high impact on people’s lives especially when deployed as part of high-stakes tests. In this paper we discuss different defi-nitions of fairness and possible ways to apply them to educational applications. We then use simulated and real data to consider how test-takers’ native language backgrounds can affect their automated scores on an English language proficiency assess-ment. We illustrate that total fairness may not be achievable and that different definitions of fairness may require different solutions.
1 Introduction
The issues of algorithmic fairness and bias have recently featured prominently in many publica-tions highlighting the fact that training the algo-rithms for maximum performance may often re-sult in predictions that are biased against various groups (Kamiran and Calders, 2009; Kamishima et al.,2012;Luong et al.,2011;Zemel et al.,2013;
Feldman et al., 2015;Friedler et al., 2016). Like any algorithm, NLP systems are not immune to such bias (Hovy and Spruit,2016;Caliskan et al.,
2017). These days it is hardly necessary to justify the importance of ensuring algorithmic fairness, especially in applications that can have a substan-tial impact on users’ lives.
Automated test scoring is one such application, and the educational measurement community has been concerned with the fairness of automated scoring since long before this topic gained wide popularity. There exist a variety of standard mea-sures generally recommended for evaluating fair-ness of the automated scoring systems (Clauser et al.,2002;Williamson et al.,2012;Ramineni and Williamson,2013) as well as open-source tools for computing such measures (Madnani et al.,2017).
In this paper we use the data from an operational spoken language proficiency assessment and an automated speech scoring engine to show that the application of these measures may sometimes lead to seemingly contradictory results. We apply the insight from the machine learning community that there are different ways to formally define algo-rithmic fairness, and propose a framework which leverages work from both educational measure-ment and machine learning to formalize these def-initions in the context of automated scoring.
2 Fairness in educational applications and beyond
2.1 Fairness metrics for automated scoring
“construct-irrelevant” factors include not only protected at-tributes often considered in studies on algorithmic bias but also other factors that can affect prede-fined groups of test-takers, such as screen resolu-tion on the computers used to administer an as-sessment (Bridgeman et al.,2001). It follows that a fair automated scoring system should not intro-duce additional construct-irrelevant group-related variance or disadvantage any group of test-takers in comparison to human scores (Penfield,2016).
Several standard measures have been used to evaluate the fairness of the automated scoring sys-tems across different groups, for example speak-ers of different languages or test-takspeak-ers with dis-abilities (Burstein and Chodorow, 1999; Bridge-man et al., 2012; Wang and von Davier, 2014;
Wang et al., 2016; An et al., 2016;Loukina and Buzick, 2017). The two most common analy-ses are standardized mean score differences and overall model performance for different groups with human scores (predictive ability) (Ramineni and Williamson, 2013; Williamson et al., 2012). More recently other measures have been used such as differential feature functioning (Zhang et al.,
2017) to analyze the performance of individual features or variance in mean model residual across groups (Yao et al., 2019). The approach taken in many previous studies on the fairness of auto-mated scores has been that substantial between-groups differences in human and automated scores in any of the measures indicate that the system might not be fair.
2.2 Algorithmic fairness
There are two key conclusions that emerged from general research on algorithmic fairness that are most relevant for this paper. First, there are many different ways to formally define algorithmic ness. Second, it may be impossible to achieve fair-ness according to each and every one of these defi-nitions at the same time (Friedler et al.,2016;Berk et al.,2018).
In their review of algorithmic bias in the con-text of criminal justice risk assessment,Berk et al.
(2018) offer five definitions of fairness: (1) Over-all accuracy equality: overOver-all classification accu-racy is the same for all groups; (2) Statistical par-ity: the marginal distribution of predicted classes is the same for all groups; (3) Conditional proce-dure accuracy equality: the prediction is equally accurate for all groups when conditioned on a
known outcome; (4) Conditional use accuracy equality: the prediction is equally accurate for all groups when conditioned on a predicted outcome; (5) Treatment equality: the ratio of false negatives and false positives is the same for both groups. To-tal fairness is achieved when all five definitions are met. As Berk et al. (2018) show, in practice to-tal fairness cannot be achieved, except for trivial cases.
3 Data
The analyses in this paper are based on actual re-sponses collected during a large-scale assessment of English language speaking proficiency. For this assessment all test-takers answered 6 questions that elicited spontaneous speech. Depending on the question, the speakers were given 45 seconds or 1 minute to record their responses.
We will focus on whether automated scoring might disadvantage test-takers depending on their native language (L1), a common concern in au-tomated scoring contexts. Learners with differ-ent L1 might have differdiffer-ent linguistic profile and it has been shown that it is possible to identify learner L1 from their written or spoken response (Malmasi et al.,2017). Therefore there is a danger that the scoring engine might inadvertently assign different scores to speakers of different L1 even when there is no difference in English proficiency, the actual construct measured by the test. In other words the system would introduce group-related construct-irrelevant differences.
In an actual operational scenario there are many additional factors that can introduce bias to the performance of an automated scoring system: some L1s might be over- or under-represented in the data used for model training and evaluation; sometimes different versions of the test are admin-istered in different countries for security reasons, introducing further scope for conflation between native language and prompt.
For this study we constructed a corpus of re-sponses designed to control for these factors. Us-ing the information about the native language re-ported by test-takers when taking the test, we selected responses from native speakers of the 6 most frequently languages among the test-taker population1: Chinese (CHI), Korean (KOR), Japanese (JPN), Spanish (SPA), Arabic (ARA) and
1The metadata does not differentiate between different
German (GER). All test-takers responded to one of the two versions of the test that were administered across all these regions.
We then created a corpus with uniform distri-bution of native languages by randomly sampling a similar number of test-takers for each version of the test. The final corpus included 26,710 re-sponses from 4,452 test-takers (742 for each lan-guage, about 370 test-takers per version). The corpus was split into a training set (75%) and a test set (25%), with 19,942 responses from 3,324 test-takers (554 from each group) allocated to the former, and the remaining 6,768 responses from 1,128 test-takers (188 from each group) allocated to the latter.
All responses had been scored by trained human raters on a scale from 1-4. The raters assigned a single holistic score to each response using a scoring rubric that covered different aspects of lan-guage proficiency including delivery, lanlan-guage use and content. Most responses were scored by a sin-gle rater. About 6% of responses were double-scored. Human-human agreement for responses in the test set is Pearson’sr= 0.66. The scoring pro-cess was set up following best practices in order to minimize any possible bias (Wang and von Davier,
2014;Penfield,2016). Multiple raters took part in this process and in no instance did a given rater score multiple responses from the same test-taker. All raters were monitored throughout the process using both exemplar responses with known scores and random back-scoring. Despite all these mea-sures, there is still some possibility that the human scores contained bias which would then be learnt by the model. For the sake of simplicity, however, in this paper we will ignore such a possibility and treat the human scores as a gold standard measure.
3.1 Simulated models
When looking at algorithmic fairness, it is often helpful to look at extreme simulated cases. In all four models discussed in this section, the ‘system’ scores were produced by training a linear regres-sion on the training set and using the regresregres-sion parameters to generate predictions for the test set. All evaluations were done on the test set. The models were trained using the human score as the dependent variable and four different types of fea-tures described below.
Random model: The RANDOM model was
based on a single feature: a random sample drawn
from a normal distribution with mean and stan-dard deviation equal to those of human scores on the training set. This feature by definition is blind to a test-taker’s L1 and any properties of their re-sponse. This model is not valid as it does not differentiate test-takers on any construct-relevant dimension but it is not expected to consistently differentiate based on any construct-irrelevant fac-tors. To further make sure that no bias is intro-duced by chance, we repeated the whole procedure from feature generation to analysis 10 times with different random states. All reported results are average values of the corresponding metrics across these 10 repetitions. As expected, the model failed to predict human scores on the test set with no cor-relation between the predicted and observed scores (averager= -0.004)
A perfect model: The PERFECT model also contained a single feature, but this time the feature was equal to the human score with the addition of random noise. Random noise was also sampled from a normal distribution with mean = 0 andσ= 0.2. Like theRANDOMmodel, this procedure was applied to the whole data set without using any in-formation about a test-taker’s L1 or any properties of their response beyond the human score. We ex-pect this model to be fair because it distinguishes test-takers primarily based on their human scores which are implicitly taken as proxies for language proficiency. As in case of theRANDOMmodel, we repeated the whole procedure 10 times to ensure no bias had been introduced accidentally during random sampling. Unsurprisingly, these models achieved an almost perfect performance on the test set with averager= 0.97.
An almost perfect model: The
∼PERFECT model was identical to the PER
-FECT model, except that the random noise added to the human score when generating the “feature” was sampled from a normal distribution with σ
= 0.5, that is the model was less accurate. Like thePERFECTmodel, this model also distinguishes test-takers primarily based on their language pro-ficiency. This model achieved a good performance on the test set with averager= 0.83.
Metadata-based model: WhileRANDOM and
PERFECTmodels were designed to be blind to any L1-effects, theMETA model only relied on
not directly make use of L1, it used two closely related features (in our data, L1 was closely re-lated to the native country and test country). The model achieved a moderate performance of r = 0.44. Since this model differentiates test-takers based on their geographic location and not on their language proficiency, we expect that this model should not be deemed fair.
4 Fairness evaluations
4.1 Standardized mean differences
We first computed standardized mean difference (SMD) a standard measure used to evaluate the fairness of automated scoring engines (Williamson et al., 2012). To do so, both human and system scores were converted to z-scores using their re-spective means and standard deviations. SMD for each group is the average difference between such standardized human and system scores within this group (System score - human score). Absolute values above 0.1 are considered an issue of con-cern and require further evaluation (Williamson et al.,2012).
RANDOM PERFECT ∼PERFECT META ARA 0.02 -0.00 0.00 0.14
CHI 0.22 0.01 0.03 -0.40
GER -0.78 -0.02 -0.13 0.93
JPN 0.63 0.02 0.11 -0.70
KOR 0.17 0.00 0.03 -0.30
SPA -0.20 -0.01 -0.02 0.27
Table 1: Standardized mean difference (system-human) for 6 languages in our corpus for scores gen-erated by different models. Absolute values above 0.1 threshold are highlighted in bold
Table1shows SMDs for the four models. As we predicted, the speakers of all languages would be disadvantaged by using theMETAmodel. Yet sur-prisingly, even in the case of the∼PERFECTmodel two of the languages,GERandJPN, show absolute
SMDs slightly above the recommended 0.1 thresh-old. In other words, the evaluation suggests that speakers of these two languages are not treated fairly by the model:GERspeakers are underscored whileJPNspeakers are over-scored.
Yet we know that the∼PERFECTmodel by
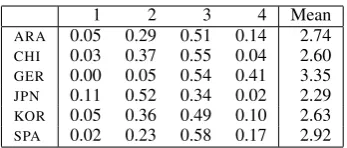
de-sign is blind to test-taker’s L1. Why then do we see relatively large SMDs? The reason is the un-usual score distribution for these two groups of test-takers and consequently the large difference in their mean scores. As shown in Table 2, the scores are not distributed uniformly: the
propor-1 2 3 4 Mean
ARA 0.05 0.29 0.51 0.14 2.74
CHI 0.03 0.37 0.55 0.04 2.60
GER 0.00 0.05 0.54 0.41 3.35
JPN 0.11 0.52 0.34 0.02 2.29
KOR 0.05 0.36 0.49 0.10 2.63
[image:4.595.330.504.60.134.2]SPA 0.02 0.23 0.58 0.17 2.92
Table 2: Proportion of responses assigned each of the four possible human scores for test-takers with each L1 and mean human score for each group
tion of ‘2’ and ‘3’ is much higher (80% of all scores) than the proportion of ‘1’ and ‘4’. Fur-thermore, proficiency levels as measured by hu-man scores vary greatly across the 6 groups in our study: GERspeakers have a very high proportion of score 4 responses (40.9%) and a mean score of 3.35, while JPN speakers have a high number of responses scored as ‘1’ or ‘2’ (63%) and a mean score of 2.286. The very uneven score distribu-tion in the training set, in combinadistribu-tion with the noise we introduced to the ‘feature’, resulted in greater prediction error at the edges of the scale: mean standardized score differences is 0.35 for re-sponses scored 1 and -0.29 for rere-sponses scored 4 vs. 0.17 for responses scored 2 and -0.05 for re-sponses scored 3. This in combination with the unusual score distribution lead to higher absolute SMDs forGER andJPNspeakers.
To confirm that the observed differences are due to score distribution and are not an artefact of the model-training process, we sampled from the test set a subset of 2,700 responses (450 responses per group) with identical (but not uniform) distribu-tions of human scores in each group: the sample sizes for each score level were determined by the maximum number of responses available for this score level from all L1s. As a result, 80% in this sample received a score of ‘3’, 13% received a score of ‘2’, 5% received a score of ‘4’ and 1% received a score of ‘1’. The mean human score for all subgroups was 2.9. We then recomputed SMDs using only this subset. While SMDs for the
META model remained high, the absolute SMDs for the other three models were all below 0.02.
4.2 Measuring different dimensions of fairness
in assessment: thus we do not expect statistical paritythat is the same marginal score distribution for all groups. The unequal distribution of social, economic, and educational resources means that some differences in performance across groups are to be expected (AERA,1999).
The three definitions that we will consider in this paper are: (1) Overall score accuracy; (2) Overall score difference; (3) Conditional score dif-ference.2
The overall score accuracy (OSA) measures whether automated scores are equally accurate for each group by looking at differences in squared er-ror(S −H)2 (whereH is the human score for a given response and S is the system score). This measure is essentially the same as predictive ac-curacy for different groups considered in previ-ous studies on automated scoring (Ramineni and Williamson, 2013; Yao et al., 2019). To get a numeric estimate we fit a linear regression with squared error as a dependent variable and test-taker L1 as an independent variable, used theR2
from this model as a measure of model fairness: largerR2indicates high impact of L1 on score ac-curacy.3
The overall score difference (OSD) considers
whether automated scores are consistently differ-ent from human scores for members of a certain group. Since we are interested in the sign of dif-ference we are using actual errorS−H for each response rather than squared error. This measure is generally similar to what is evaluated by SMDs and similar in spirit to the ‘Treatment equality’ in
Berk et al.(2018). To get a numeric estimate we fit a linear regression with error as a dependent vari-able and test-taker L1 as an independent varivari-able, and used theR2 from this model as a measure of model fairness: largerR2 values indicate high im-pact of L1 on score differences.
The conditional score difference (CSD) shows whether automated scoring engines assign differ-ent scores to speakers from differdiffer-ent groups de-spite their having the same language proficiency.
2For the sake of simplicity we will not consider the fifth
definition of fairness: conditional use equality, that is do the same automated scores assigned to different group members correspond to the same proficiency level? This is another im-portant dimension of fairness that affects score use and inter-pretation and we will return to it in future work.
3We treat all responses as independent since mixed linear
model analysis showed no clustering by speaker in our data. This assumption may not hold for all data sets in which case mixed models might be necessary.
This is similar to conditional procedure equality in
Berk et al.(2018). In educational measurement, a similar approach has been applied to feature anal-ysis and is known as “differential feature function-ing” (Zhang et al.,2017). Using human scores as a proxy for language proficiency, we can estimate this metric by fitting a linear regression with er-rorS−H as a dependent variable, and both test-taker L1 and human score as independent vari-ables. To evaluate the impact of L1 beyond human scores, we first fit the model with human scores only and then compared the difference inR2 val-ues between the two models. We use analysis of variance to establish whether the difference is sig-nificant. As with overall score difference, larger
R2 values indicate higher impact of L1 on auto-matic scores4.
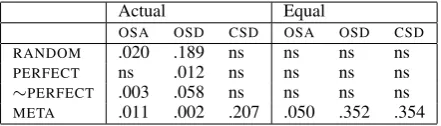
Actual Equal
OSA OSD CSD OSA OSD CSD
RANDOM .020 .189 ns ns ns ns
PERFECT ns .012 ns ns ns ns
∼PERFECT .003 .058 ns ns ns ns
META .011 .002 .207 .050 .352 .354
Table 3: AdjustedR2showing the percentage of
vari-ance in scoring error attributed to L1 for different mod-els and score distributions (equal and actual score dis-tribution). Larger values correspond to the greater im-pact of L1 on scoring error. Cells marked ‘ns’ mean that the effect of L1 was not significant atα=0.01. See section4.2for further explanation.
4.3 Evaluation on simulated models
Table3shows the results of these evaluations for the four models considered in this section. Since based on the results in previous section we expect the overall difference to be dependent on score dis-tribution, we conducted all analyses twice: once using the whole test set (“actual score distribu-tion”) and once using the subset with identical score distribution across all groups described in
4.1.
As expected, Table 3 shows a striking differ-ence in results between the two samples. When the score distribution is held constant across the groups, we see the results we expect from the de-sign of the model: L1 was observed to have a sig-nificant effect on only the META model. For all
4The code used to compute these
[image:5.595.307.528.304.367.2]Figure 1: Average system score conditioned on human score for different models and native languages
other models, there was no significant impact of L1 on scores.
A different picture emerges when we consider results on the actual score distribution. As we already observed for SMDs, we saw a signifi-cant impact of L1 on the OSD. It was particu-larly large for theRANDOM and∼PERFECT
mod-els, but we also saw a consistent, albeit small, ef-fect for the PERFECT model. In addition, there was a difference in OSA for both RANDOM and
∼PERFECTmodels. As expected, noCSD was ob-served for any of the models other thanMETA. We will return to this finding in the discussion.
5 Application to automated speech scoring
5.1 Automated scoring engine
We will now now apply these evaluations to the ac-tual scores produced by an automated speech scor-ing engine similar to the one described in Chen et al.(2018). The ASR system was trained using the Kaldi toolkit (Povey et al.,2011) on a propri-etary corpus consisting of 800 hours of non-native speech from 8,700 speakers of more than 100 na-tive languages. There was no overlap of speakers or questions between the ASR training corpus and the corpus used in this paper. We did not addition-ally adapt the ASR to the speakers or responses in this study.
For each response, we extracted 77 non-sparse continuous features which covered two of the three aspects of language proficiency considered by the human raters: delivery (i.e., prosody, pronuncia-tion, fluency) and language use (i.e., grammar, vo-cabulary). The correlation between different fea-tures and human scores varied betweenr=0.05 and
r=0.63. For this study we did not use any features
that cover the content of the response.
5.2 Scoring models
Baseline model: As a baseline (BASE) we used a model which included all 77 features. The model was fitted using Ridge regression available via RSMTool, an open-source tool for training auto-mated scoring models (Madnani et al.,2017). The model coefficients were estimated using all re-sponses in the training set with human score as the dependent variable and features as indepen-dent variables. The model parameters were used to generate predictions on the test set. The corre-lation between automated and human scores wasr
= 0.71.
L1-specific model: We also trained a separate
L1 model for each native language using only re-sponses from test-takers from this group and the same general procedure as for the BASE model and then pooled together predictions from these six models for evaluation. The overall correlation for all pooled predictions wasr= 0.72, similar to theBASEmodel. We expect that this model might reduce the score error for each L1 but will likely increaseCSDas it makes use of speaker L1 in the scoring process.
thresh-old and excluded features where more than 3% of feature variance could be attributed to native lan-guage. This left us with 34 out of 77 features. These analyses were done using the training set. We then used this subset of 34 features to re-fit the Ridge regression to the training set and to generate predictions for the test set. ThisFAIR(ER) model
achieved r = 0.67, a small loss in performance considering that we removed more than half of all features. This model was optimized to reduce
CSD but it might do so at the cost of other mea-sures.
5.3 Model fairness
The fairness evaluations for these three models are summarized in Table4. For theBASEmodel,
test-taker L1 explained 1.7% of variance in OSD and 6.2% of variance in CSD. There also was a small difference in OSA. In other words, these evalua-tions pointed towards a small but significant bias in model performance.
Actual Equal
OSA OSD CSD OSA OSD CSD
BASE .002 .017 .062 .008 .112 .112
L1 .003 ns .135 .014 .222 .223
[image:7.595.311.521.203.276.2]FAIR(ER) .004 .045 .030 .004 .054 .055
Table 4: AdjustedR2showing percentage of variance
in scoring error attributed to L1 for different models and score distributions. See caption to Table3and sec-tion4.2for further explanation
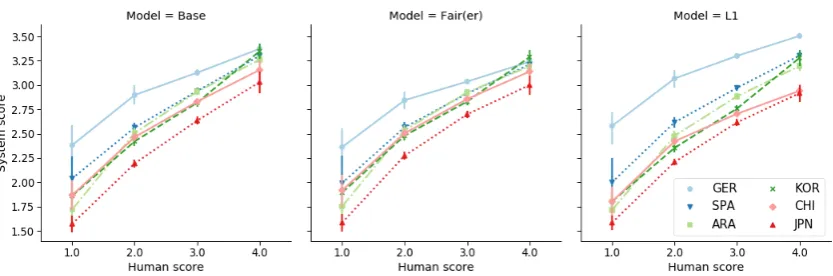
To further understand the nature of these differ-ences, we can look at the estimates for each group produced by the model in Table5. For estimates computed on the actual score distribution we see that not only the size but also the direction of dif-ferences differs depending on whether we look at the overall or conditional difference. Thus, for example, the overall difference for GERspeakers suggests lower overall automated scores relative to human scores than for the reference group (SPA), while the conditional difference implies that the automated scores are higher relative to human rat-ings than for the reference group when speaker language proficiency is held constant.
Since we already saw that overall differences may be affected by the score distributions, Table
5 also shows the estimates for the model fitted to the subset of responses where the score dis-tribution is held constant across all groups. In this case, OSA and OSD estimates are identi-cal and show that given the same level of
profi-ciency the model in fact assigns higher scores to
GER speakers relative to human scores and lower scores toJPNspeakers relative to human scores. In other words, in the actual data this difference for
GER speakers is compensated by the score distri-bution effects. Conditional score differences for the three models are illustrated in Figure 2. For comparison, Figure 1 shows the same plots for simulated models.
Actual Equal
OSA OSD CSD OSA OSD CSD
ARA ns 0.06 ns ns ns ns
CHI ns 0.09 -0.10 ns -0.12 -0.12
GER ns -0.11 0.16 0.06 0.20 0.20
JPN ns ns -0.33 0.08 -0.31 -0.31
[image:7.595.74.289.358.411.2]KOR ns 0.06 -0.11 ns -0.10 -0.10
Table 5: Model estimates for 6 languages in our corpus for scores generated by theBASEmodel.SPAis used as a reference category.
For the other two models the evaluations in Table 4 are consistent with our predictions:
FAIR(ER) model has the lowestCSD (0.03) while for the L1 model CSD more than doubled and
reached 0.135. At the same time OSDshows the reverse pattern with theL1 model outperforming bothBASE andFAIR(ER) model. All three
mod-els show small but significantOSA.
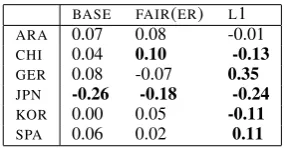
Finally, we compared these results with the standardized mean differences in Table 6. As in the case of simulated models, SMDs allowed us to reach the same general conclusion: L1 model is the least fair and FAIR(ER) model is proba-bly the most fair of the three models. Yet in this case SMDs also obscure the fact that both
BASE andFAIR(ER) model might be over-scoring
GERspeakers: in fact the SMDs for the two
mod-els have the opposite sign.
BASE FAIR(ER) L1
ARA 0.07 0.08 -0.01
CHI 0.04 0.10 -0.13
GER 0.08 -0.07 0.35
JPN -0.26 -0.18 -0.24
KOR 0.00 0.05 -0.11
SPA 0.06 0.02 0.11
[image:7.595.345.489.615.689.2]Figure 2: Average system score conditioned on human score for different models and native languages
6 Discussion
In this paper we considered three definitions of fairness in the context of automated scoring: (1) Overall score accuracy - are automated scores equally accurate for all groups of interest? (2) Overall score difference - are automated scores consistently higher or lower than human scores for members of different groups? (3) Conditional score difference - are automated scores consis-tently higher or lower for members of different groups despite them having the same language proficiency? These three metrics capture different dimensions of fairness and answer different ques-tions.
Ideally, automated scores should be fair along all of these dimensions and as we showed it is possible if the automated scores are a perfect pre-diction of human scores (error = 0 for all scores) or if the human score distributions are the same across all groups. Yet in practice, achieving such total fairness may not be possible. Thus, even scores from the PERFECT model (r=0.97) failed to achieve overall score difference equal-ity. The scores from the∼PERFECT model, with
slightly less accurate automated scores than the
PERFECT model, failed to achieve both overall score accuracy equality and overall score differ-ence equality when evaluated on the data with ac-tual score distribution.
Notably when the score distributions differ across groups, the three different dimensions of fairness are not necessarily aligned with each other. Thus the META model based on metadata only was better than thePERFECTmodel in terms
of the overall score difference equality: there was almost no variation between the groups. Yet as expected, it failed the conditional score difference
equality test since the scores were assigned based on test-taker geographic location rather than lan-guage proficiency.
Similarly for actual models, the model trained separately for each native language is most fair in terms of overall score differences since the predic-tions for each group are centered around the group mean. Yet this model is the worst of the three we considered in terms of conditional score difference which is unsurprising given that test-taker native language is considered when assigning the score.
None of these definitions of fairness is in prin-ciple more important than another. Overall score accuracy equality might be more desirable if a sys-tem is deployed independently in many countries and the scores are never compared across coun-tries. At the same time a system that achieves high overall score accuracy equality but fails to achieve conditional score difference equality would not be acceptable in a high-stakes international assess-ment context.
In automated scoring model fairness issues have often been interpreted as emerging from particular linguistic patterns exhibited by a group in ques-tion or implicit use of group membership in scor-ing procedure. As we have shown throughout this paper, not all measures of fairness are good indica-tors of such group awareness. Thus overall score accuracy was in fact higher for the META model
than for theRANDOMmodel. It also did not differ-entiate between generic and L1-specific models. It is also not the case that group unaware models will be more fair across all dimensions: theRAN
proficiency is aligned with group membership, this can mean that the model favors certain groups over others.
Finally, the distinction between different as-pects of fairness is crucial for fine-tuning the auto-mated scoring models, especially the ones that do not lend themselves easily to interpretation. Thus for example the model optimized to minimize the overall score differences might in fact learn to “hold the thumb on the scale” by indirectly us-ing group membership as was the case with our
L1 model. On the other hand, the model opti-mized for minimal conditional score differences may not be equally accurate for all groups. Un-like SMDs, that conflate different aspects of fair-ness into the same dimension, different measures discussed in this paper provide different informa-tion that helps better understand subgroup differ-ences in the performance of an automated scor-ing engines. Thus for example in a hypothetical scenario where the∼PERFECTmodel is deployed for scoring, SMDs rightly point out that German speakers as a group would see a reduction in their scores: the mean score for this group would de-crease from 3.35 to 3.16. This could be a problem if old and new scores are ever compared at indi-vidual or group levels. Yet it would be counter-productive to search for solutions by looking for idiosyncrasies in the way the scoring engine han-dles the responses from German speakers. To re-solve this problem the engine developers would need to focus on generally improving model per-formance, especially at scale edges.
7 Conclusion
We considered different definitions of fairness of an automated scoring system and argued that achieving all of them simultaneously may not be possible as long as the automated scores are not in perfect agreement with human scores and the score distributions vary across groups. In this pa-per we considered human scores to be the true ‘gold standard’ measure of language proficiency. Yet in most practical applications human scores are likely to contain a certain amount of error and possibly even bias which brings additional com-plexity to fairness evaluations. At the same time, at least in some contexts, automated scoring can improve overall score reliability and consistency which benefits all takers. Ultimately, both the magnitude and the nature of the impact of
auto-mated scores on score differences between groups needs to be weighed against other benefits of us-ing automated scorus-ing in a particular educational application and the consequences for the final user.
Acknowledgements
Mo Zhang was instrumental in creating the corpus for this study. Matt Mulholland extracted the fea-tures used in this study. We thank Keelan Evanini, Aoife Cahill, Dan McCaffrey and three anony-mous BEA reviewers for their comments and sug-gestions.
References
AERA. 1999. Standards for Educational and Psy-chological Testing. American Educational Research Association.
Ji An, Vincent Kieftenbeld, and Raghuveer Kan-neganti. 2016. Fairness in automated scoring: Screening features for subgroup differences. Pre-sented at the Annual Meeting of the National Coun-cil on Measurement in Education, Washington DC.
Richard Berk, Hoda Heidari, Shahin Jabbari, Michael Kearns, and Aaron Roth. 2018. Fairness in criminal justice risk assessments. Sociological Methods & Research, page 004912411878253.
Brent Bridgeman, Mary Louise Lennon, and Altamese Jackenthal. 2001. Effects of screen size, screen res-olution, and display rate on computer-based test per-formance. Technical Report October 2001, Educa-tional Testing Service.
Brent Bridgeman, Catherine Trapani, and Yigal Attali. 2012.Comparison of human and machine scoring of essays: Differences by gender, ethnicity, and coun-try. Applied Measurement in Education, 25(1):27– 40.
Jill Burstein and Martin Chodorow. 1999. Automated essay scoring for nonnative English speakers. In Proceedings of a Symposium on Computer Medi-ated Language Assessment and Evaluation in Nat-ural Language Processing, pages 68–75, Strouds-burg, PA, USA.
Aylin Caliskan, Joanna J. Bryson, and Arvind Narayanan. 2017. Semantics derived automatically from language corpora contain human-like biases. Science, 356(6334):183–186.
Brian E. Clauser, Michael T. Kane, and David B. Swanson. 2002. Validity issues for performance-based tests scored with computer-automated scor-ing systems. Applied Measurement in Education, 15(4):413–432.
Michael Feldman, Sorelle A. Friedler, John Moeller, Carlos Scheidegger, and Suresh Venkatasubrama-nian. 2015. Certifying and removing disparate im-pact. Proceedings of the 21th ACM SIGKDD Inter-national Conference on Knowledge Discovery and Data Mining, pages 259–268.
Sorelle A. Friedler, Carlos Scheidegger, and Suresh Venkatasubramanian. 2016. On the (im)possibility of fairness.Arxiv preprint, (609.07236):1–16.
Dirk Hovy and L Shannon Spruit. 2016. The social impact of natural language processing.Proceedings of ACL, pages 591–598.
Faisal Kamiran and Toon Calders. 2009. Classifying without discriminating. InProceedings of the IEEE International Conference on Computer, Control and Communication, pages 1–6.
Toshihiro Kamishima, Shotaro Akaho, Hideki Asoh, and Jun Sakuma. 2012. Fairness-aware classifier with prejudice remover regularizer. In Proceed-ings of the Joint European Conference on Machine Learning and Knowledge Discovery in Databases, pages 35–50.
Anastassia Loukina and Heather Buzick. 2017. Use of automated scoring in spoken language assessments for test takers with speech impairments. ETS Re-search Report Series, RR-17-42.
Binh Thanh Luong, Salvatore Ruggieri, and Franco Turini. 2011. k-NN as an implementation of situa-tion testing for discriminasitua-tion discovery and preven-tion. InProceedings of the 17th ACM SIGKDD in-ternational conference on Knowledge discovery and data mining, pages 502–510.
Nitin Madnani, Anastassia Loukina, Alina Von Davier, Jill Burstein, and Aoife Cahill. 2017. Building bet-ter open-source tools to support fairness in auto-mated scoring. InProceedings of the First Workshop on ethics in Natural Language Processing, Valen-cia, Spain, April 4th, 2017, pages 41–52, Valencia, Spain. Association for Computational Linguistics.
Shervin Malmasi, Keelan Evanini, Aoife Cahill, Joel Tetreault, Robert Pugh, Christopher Hamill, Diane Napolitano, and Yao Qian. 2017. A report on the 2017 Native Language Identification shared task. In Proceedings of the 12th Workshop on Innovative Use of NLP for Building Educational Applications, pages 62–75, Copenhagen, Denmark. Association for Computational Linguistics.
Randall D. Penfield. 2016. Fairness in test scoring. In Neil J. Dorans and Linda L. Cook, editors,Fairness in Educational Assessment and Measurement, pages 55–76. Routledge.
D. Povey, A. Ghoshal, G. Boulianne, L. Burget, O. Glembek, N. Goel, M. Hannemann, P. Motlicek, Y. Qian, P. Schwarz, J. Silovsky, G. Stemmer, and K. Vesely. 2011. The Kaldi speech recogni-tion toolkit. IEEE Workshop on Automatic Speech Recognition and Understanding, pages 1–4.
Chaitanya Ramineni and David M. Williamson. 2013. Automated essay scoring: Psychometric guidelines and practices. Assessing Writing, 18(1):25–39.
Zhen Wang and Alina von Davier. 2014. Monitoring of scoring using the e-rater automated scoring system and human raters on a writing test. ETS Research Report Series, 2014(1):1–21.
Zhen Wang, Klaus Zechner, and Yu Sun. 2016. Mon-itoring the performance of human and automated scores for spoken responses. Language Testing, pages 1–20.
David M. Williamson, Xiaoming Xi, and F. Jay Breyer. 2012. A framework for evaluation and use of au-tomated scoring. Educational Measurement: Issues and Practice, 31(1):2–13.
Xiaoming Xi. 2010.How do we go about investigating test fairness? Language Testing, 27(2):147–170.
Lili Yao, Shelby J. Haberman, and Mo Zhang. 2019. Penalized best linear prediction of true test scores. Psychometrika, 84(1):186–211.
Richard S Zemel, Yu Wu, Kevin Swersky, Toniann Pitassi, and Cynthia Dwork. 2013. Learning fair representations. In Proceedings of ICML, pages 325–333.
Mo Zhang, Neil J. Dorans, Chen Li, and Andre A. Rupp. 2017. Differential feature functioning in au-tomated essay scoring. In H. Jiao and R.W. Lissitz, editors,Test fairness in the new generation of large-scale assessment.