(esR1J
THE ECONOMIC AND SOCIAL RESEARCH INSTITUTE
Low PAY: THElRISH EXPERIENCE
John Blackwell
Department of Environmental Studies, UCD
and
Brian Nolan
The Economic and Social Research Institute
December 1989
Working Paper No. 15
Paper presented at Combat Poverty Agency/Irish Congress of Trade Unions Conference 13 December 1989
Introduction
The aim of this paper is to summarise the state of knowledge about the \
extent of low pay in Ireland. At the outset, some of the underlying elements which influence low pay are outlined. In relation to this, some of the changes in the labour market in recent years, which have a bearing on the incidence of low pay, are briefly discussed. There follows an outline of the current knowledge about the main features of low pay. The emphasis here is on presenting some initial findings from an analysis of the 1987 ESRI survey of income distribution, poverty and usage of State services. At the same time, some reference back to earlier work is made. At the end of the paper, some policy questions which arise from the paper are raised.
Low pay and the labour market
One can begin with the labour market - for it is the labour market which· generates low pay - and specifically with the distribution of gross earnings across individual employees who are at work. One can think of this distribution as being captured roughly by the proportion of all earnings which, say, the top tenth of individuals (or the top fifth) by comparison with the next tenth (or fifth) and so on down to the bottom tenth (or fifth). The existence of low pay is linked to this distribution of earnings in the following way. First, the extent of inequality in the structure of earnings will define the position of those who are at the bottom of the wage structure. Specifically, for any level of average gross earnings, the more equal the distribution of earnings, the higher will be the earnings of those at the bottom of the distribution by comparison with average earnings.
What are the elements which explain the existing distribution of earnings and its changes (if any) over time? There are four different types of element which can explain the distribution, as follows.
1. The changes over time in aggregate employment and unemployment rates. These changes can influence the pay distribution in ways which are difficult to establish a priori. However, in an economy with a strong growth in labour demand, inequalities at the top of the pay distribution can be expected to increase, at least in the short term. By contrast, in cases where aggregate unemployment increases - the case in
Ireland over most of the period since 1980 - it could be expected that young and unorganised workers, women and those at ~he bottom of the pay distribution would fare worst in earning power by contrast with others.
2. The rise and fall of individual sectors in the economy. Those sectors where demand is growing fast can be expected to be more profitable, with a capacity to pay increases in wage rates to an extent which may not exist in slow-growing sectors. In addition, expanding sectors may have to pay higher wages if they are to get the labour which they need.
3. Institutional and social forces. The institutional forces take the form primarily of the changes over time in the degree of unionisation within individual sectors. The social forces comprise the public intervention which influence wage-setting. It should be noted that this intervention does not simply consist of elements such as Joint Labour Committees and minimum wage setting. It may be the case that some social welfare payments act as an effective minimum wage, with some people being unprepared to work for less than the equivalent of the (typically untaxed) social welfare payment. Moreover, the Family Income Supplement, paid to families where someone is in (full-time) employment at less than a certain level of weekly gross earnings, may drive down some wage levels, with the supplement effectively subsidising low pay.
4. Individual factors such as differences in education, training, ability, motivation and luck across people.
The fourth set of elements above raises some of the most difficult areas of interpretation of low pay data. The main ones can be mentioned briefly. Firstly, low pay can exist as a constant structural feature of the labour market - say, in particular industries or in particular forms of work - but the type of indivudual who is in low pay could change from one period to another.
advancement over time. The other may be in a "dead-end" job with no skills, little or no prospects of advancement and with a high· turnover of
'
people through the particular job. The longer-run experience of these workers will be markedly different. In general, the more work experience a person has, the higher the pay, but the strength of this relationship differs across sectors and across different groups of workers - in general being very weak, for instance in low-skilled manual jobs and for many women.
Third, not everyone has equal access to education and training, for instance because of differences in attitudes to education and training across families, because of differences in the short-run "opportunity cost" of education for low income families (and hence with an incentive to leave education and enter employment at an early stage in these families), and because of lack of access to capital.
One aspect of the low pay problem can be stressed. It has considerable implications for policy. This is the extent to which low pay is associated with certain characteristics of individuals. These personal characteristics would include education, health, socio-economic background, skill level and age. For instance, one may find that low pay is associated with a disadvantaged social background or with a relative lack of skills. There is evidence for other countries that low pay is partly concentrated in both relatively young and relatively older workers. If low pay is "caused by" the absence of certain personal qualities, there are some marked implications for policy. The desired policy measures would emphasise the provision of education and of health care and the acquisition of training. In a number of countries in recent years, there has been a certain amount of disillusionment with this approach. It seems as if a reliance on education and training, by itself in the absence of other policy measures, would not be sufficient to eliminate low pay.
There is a competing explanation to the "personal characteristics" school, which emphasises the structure of jobs and segmentation in the labour market. According to this approach, there is a "secondary" sector in the economy which is characterised by dead-end jobs which have a number of distinctive features. These would typically include higher than average turnover rates and rates of job vacancy, little opportunities for on-the-job
training, a lack of fringe benefits such as occupational pensions, poor promotion prospects and relatively little incre'\se over time in real earnings.
Now, one is not forced to accept one or other of these rival explanations, to the utter exclusion of the other. At the same time, the latter explanation would imply that a different set of policy measures would be needed: more emphasis on direct intervention in wage-setting and in conditions of employment, and policies to increase the demand for labour - rather than policies to influence the supply of labour such as would be suggested by the first explanation.
This all points up the need to try to distinguish between elements which are
associated
with low pay and elements whichcause
low pay: not an easy task. There are some pointers which can help. One needs to look at the pay of particular grades or levels of skill across the different industrial sectors. If the first explanation - the low productivity which is associated with certain personal qualities - were valid, one would expect the pay of unskilled workers to be similar across industries. By contrast, if the pay of unskilled workers is related to average pay in the particular industries where people are working, the case for the first explanation is weakened. In other words, holding personal characteristics constant, to what extent are there systematic variations in pay across industry?Changes in the Labour Market since around 1980
Taking as a starting point the above a priori expectations about links between the labour market and the pay distribution, what are the main changes in the labour market which have occurred since the early 1980s. They can be summarised as follows.
First, there has been a rise in the total unemployment rate from 6.9 per cent of the labour force in April 1979 to 16.7 per cent in April 1988 (Labour Force Survey data). The proportion of unemployment which is long duration (a year or more) has increased markedly, from 35 per cent in April 1980 to 4~ per cent in April 1988 (Live Register data). This means that much of the increase in measured unemployment has affected older workers. This point must be tempered in two ways:
(a) For young workers, it is inadequate to look at their unemployment rate. The relatively large numbers of people seeking work in relation to employment opportunities has meant that rates of emigration as much as rates of unemployment are affected. Young people have the highest propensity to emigrate among all people, with highest propensities among those aged 20-24 and the third highest among those aged 15-19.
(b) Some people, especially women, are in the "hidden" labour force
-they have stopped actively seeking work due to discouragement at finding jobs.
Second, there have been differences across sectors in employment, with declines occurring in certain segments of manufacturing and by contrast a growth in employment in private services.
Third, there has been a rise in the amount of temporary working and in part-time work. The growth of part-time work has been particularly notable in the case of women. Between 1977 and 1988, the number of full-time regular jobs held by males declined from 772.1 thousand to 716.4 thousand. The number of part-time regular jobs held by men increased from 12.4 thousand to 21.9 thousand. There was an increase in the number of full-time regular jobs for women from 271.8 thousand to 302.8
thousand. In the same period the number of part-time regular jobs for women increased from 27.0 thousand to SO.I thousaz:td.
What is meant by low pay
There is no widely accepted definition of low pay. In general, the approaches used to define low pay are of two types, as follows.
First, there is a relation to a poverty standard. Some poverty standard is supposed to capture the level of poverty which is set by the State. In the absence of an official "poverty line", one approach is to take the gross
earnings equivalent to the net (after tax) earnings to which a person on Supplementary Welfare Allowance (SWA) would receive. The latter is the closest there is to a means-tested "safety net" for those who have no sources of income and no resources. This would take account of the payment by the worker of income tax and Pay Related Social Insurance. The household is assumed to consist of a man, wife, and two children. One problem which arises is that such a prototype household is now a minority, with all households with children amounting to 44 per cent of all households. Another problem is the implicit assumption that only one member of the family is at work and that there are no sources of income other than wages. An allowance could be made for work expenses which people in employment have to meet (e.g., journey to work).
An alternative standard is provided by the gross earnings which are the
eligibility level for the Family Income Supplement for this family of four.
The assumption here is that the family which depends on earnings from work should not be worse off than one which is dependent on State benefits due, say, to unemployment. It may be noted that this definition implicitly brings in Government policies about taxation, social insurance, family income support and social welfare payments in general.
This approach defines a cut-off point by taking the. bottom ten per cent of
'
the earnings distribution, that is the lowest decline. In this case the low pay figure would be that pay level, below which 10 per cent of workers fell.
Second, there is a relation to the "average". This approach would relate a low pay figure to median or to average earnings. The median earnings is the earnings figure which splits the distribution of earnings in two; half of workers earn less than the median and half of them earn more than the median. The median has the advantage here that it is less subject to distortion than is the mean by extreme values of earnings. The choice of the ratio of the median is somewhat arbitrary. One could take two third of the median or one half of the median.
In this case, however, there is one standard which has already been set. This is the European Social Charter, set by the Council of Europe, whereby the signatory Governments commit themselves to securing rights "by all appropriate means". In 1977 the Committee of Experts proposed taking a level of 68 per cent or two third of the national average wage as a "decency threshold". Workers which received less than this would not be regarded as receiving a fair or decent remuneration (Council of Europe, 1977). The Committee of Experts appear to be concerned with earnings rather than wage rates, with all workers and with the average rather than the median (Winyard, 1982). However, some interpretations are 68 per cent of the
adult average wage. It may be noted that the use of a ratio of the median
or of the average level of earnings implies some compression of pay relativities if low pay is to be reduced.
Low · pay in the ESRI Survey
The ESRI Survey 9f Income Distribution, Poverty and Usage of State Services was a large-scale household survey carried out in 1987. It was based on a randomly-selected national sample, drawn from the Electoral Register. Data from above 3,300 households was obtained. Where possible, each adult (not in full-time education) was interviewed, and data on about 8,000 adults were obtained. A detailed description of the survey and the information gathered is given in Callan, Nolan, et al (1989).
About 2,000 individuals in the sample were employees - that is, they worked for at least one hour per week "for pay or profit" and described their status as "employee". Detailed information on earnings, deductions, hours worked, and any unusual features of current pay was obtained for those individuals. This data set enables an update of earlier findings on low pay to be made. The earlier findings relate to 1979 (using the CSO structure of earnings survey) and 1980 (using the Household Budget Survey).
Of the employees in the survey, 88 per cent were working full-time, defined as 30 hours or more per week. While 37 per cent of the total were women, women made up over three quarters of the part-timers. Average current weekly gross earnings for all employees in the sample was £183, and the corresponding average for those in Transportable Goods Industries (TGI) only was the same figure. The latter may be compared with average gross earnings for all employees in TGI as shown by the CSO's quarterly Industrial Earnings statistics, which was £191 per week for March 1987 (about the mid-point of the survey period). Since the CSO sample comprises only establishments with 10 or more persons engaged, and smaller establishments will often tend to have lower than average wage levels, this is broadly consistent with expectations.
The detailed data on earnings gathered in the ESRI survey refer not only to current (i.e., last) gross pay and a range of identified deductions, but also
The extent of low pay
Among the traditional low pay thresholds discuss~d above, we can look first at the lowest decline for adult full-time males in Transportable Goods Industries. In the ESRI sample, this cut-off for usual gross pay was £120 per week. This is similar to the FIS eligibility ceiling in 1987, and to the 1.4 times SWA rate for a couple with two children, mentioned above. About 3; per cent of all employees in the sample were below this threshold. This is in fact close to the percentage below the corresponding threshold applied to direct income in an analysis of the 1980 Household Budget Survey.
The percentage below the low pay threshold is however quite sensitive to the precise cut-off chosen. Table 1 shows, for example, that a reduction in the threshold to £110 leads to a fall in the percentage below it to 27 per cent. An increase of £10, on the other hand, leads to almost 38 per cent of employees being beneath the threshold.
The principal cut-off used in the analysis of the 1980 HBS was the lowest
deciAe for all male employees. This is well below the figure for adult
full-time males in TGI, and in the ESRI sample was close to £90 (usual pay). As Table 1 shows, about 19 per cent of the sample was below £90 per week. In what follows, to examine the sensitivity of the results to the threshold chosen, we will employ two low pay cut-offs: £120 per week as "higher" and £90 per week as a "lower" one.
Table 1: Employees in ESRI Sample with usual Gross Pay Below
Various Thresholds
Low Pay Threshold
(£ per week)
% in Sample with Usual Gross
Pay Below Threshold
---80 14.6
90 19.1
100 22.2
110 26.7
120 32.5
130 37.7
---Characteristics of the low paid
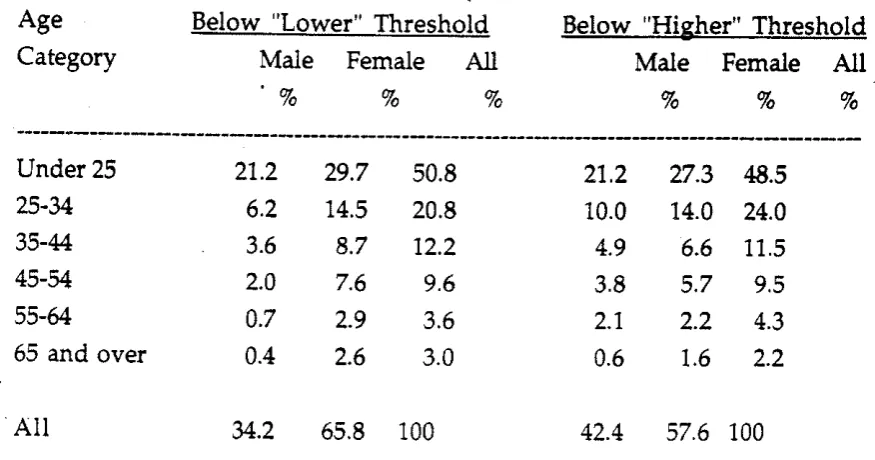
In either case, the low-paid are often young and/or female. Table 2 shows those below both thresholds categorised by sex and age group. About half of those below each of the thresholds are under 25 years of age. Two-thirds of those below the lower threshold, and 58 per cent of those below the higher one, are female. Only 6 per cent of those below the lower threshold are males aged between 35 and 64, but there is a significant number of low-paid women in that age range.
Table 2: Employees Below Pay Thresholds by Age and Sex
Age Below "Lower" Threshold Below "Higher" Threshold
Category Male Female All Male Female All
'% % % % % %
---Under25 21.2 29.7 50.8 21.2 27.3 48.5
25-34 6.2 14.S 20.8 10.0 14.0 24.0
35-44 3.6 8.7 12.2 4.9 6.6 11.5
45-54 2.0 7.6 9.6 3.8 5.7 9.5
55-64 0.7 2.9 3.6 2.1 2.2 4.3
65 and over 0.4 2.6 3.0 0.6 1.6 2.2
All 34.2 65.8 100 42.4 57.6 100
---We look next at the distribution of the low paid by broad occupational group. Table 3 shows that the dominant groupings are women working in clerical occupations, retailing; and services areas, and men working as producers. These account for two-thirds of all those below the lower threshold, and 60 per cent with the higher one.
[image:12.599.74.512.311.541.2]Table3
Employees Below Low Pay Thresholds by OccupaUonal Group and Sex
\
Lower Threshold Higher Threshold
Male Female All Male Female All
---Farmers and
agricultural workers 2.2
Producers, etc. 13.7
Labourers and unskilled workers
Transport and
3.2
communication 5. 0
Clerical 1.8
Commerce, insurance
and finance workers 4.2
Service workers 3 .3
Professional and Technical Others All 0.3 0.5 34.2 0.2 7.0 0.4 1.5 12.9 16.2 22.4 2.4 20.7 3.5 6:5 14.6 20.4 25.7
4.5 4.8
0.6 1.2
65.8 100
1.9 17.4 4.5 0.2 7.5 0.6
5.6 1.4
2.3 13.9
4.6 11.4
3.5 16.5
2.1 24.8 5.1 7.0 16.1 16.0 20.0
1.5 5.8 7.3
1.1 0.4 1.5
42.4 57.6 100
---Classifying by industry rather than by occupational group, women are predominantly in retail distribution, production industries, personal services and professional services, as seen in Table 4. Low-paid men are
for the most part in production and commence.
Table 4: Employees Below Low Pay Thresholds by Industry and Sex
Lower Threshold Higher Threshold
Male Female All Male Female All
---Agriculture 1.7 0.4 2.2 1.8 0.3 2.2
Building 3.3 0.4 3.7 3.4 0.3 3.7
Other production 10.6 9.6 20.2 15.6 10.8 26.5
Wholesale 1.0 0.9 1.9 1.6 0.7 2.3
Retail 6.8 16.5 23.4 6.8 12.3 19.1
Insurance etc. 0.2 1.5 1.7 0.8 1.8 2.6
Transport 1.4 1.3 2.7 2.5 1.5 4.1
Professional 0.6 2.7 3.3 0.4 2.2 2.6
Teaching etc. 1.6 4.1 5.7 1.5 3.7 5.2
Health etc. 0.2 5.7 5.9 0.4 7.6 8.0
Public Admin. 1.3 2.6 4.0 3.5 2.8 6.3
Personal Services 3.7 16.4 20.2 2.8 11.0 13.8
Others 1.6 3.5 5.1 1.2 2.5 3.7
All 34.2 65.8 100 42.4 57.6 100
---Part-time versus full-time workers
The part-time/ full-time distinction is a crucial one in assessing the causes and implications of low pay. It may be noted that the earlier data cited on part-time working come from the Labour Force Survey and rely on self-description. For the ESRI survey, one must use an hours cut-off point. We here adopt a cut-off point which is sometimes used, considering those who usually work 30 hours a week or more to be full-time, others to be part-time. About 36 per cent of those below the lower threshold, and 23 per cent for the higher threshold, are part-timers in that sense. There is a clear divergence here between men and women. Almost half the full-time workers below the thresholds are men, as Table 5 shows, but the low-paid part-timers are predominantly women.
[image:14.599.78.475.188.470.2]Table 5
Employees Below Low Pay Thresholds by Full-time/Part-time and Sex
Full-time Part-time All
% of those below Lower Threshold
Male Female
44.6 13.5 34.2 55.4 86.5 65.8 49.8 16.6 42.4 \
% Below Higher Threshold
Male Female
50.2 83.4 57.6
_____________________________________________ ...., ______________________________________________________ __
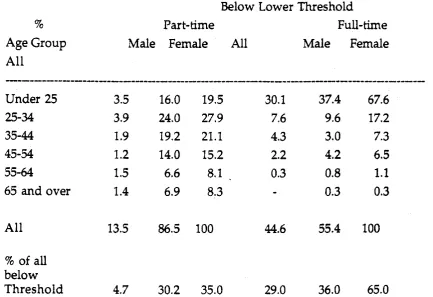
This part-time/full-time distinction is also important in the age profile of the low paid, as Table 6 illustrates for the lower threshold (a similar pattern is seen with the higher one). Over two-thirds of the full-time employees below the threshold are aged under 25, and this is true of both men and women. For the full-time low paid, in fact, there is not very much difference between men and women in the age distribution. For part-timers, though, not only are they mostly women, but there is also a difference in age profile between the sexes, with a higher proportion of women in the older age groups. Over 70 per cent of low-paid part-timers are women aged 25 or over. This is consistent with data from the Labour Force Survey which show that women part-time workers are spread across the age distribution more evenly than are men part-time workers, who are concentrated more among young male workers.
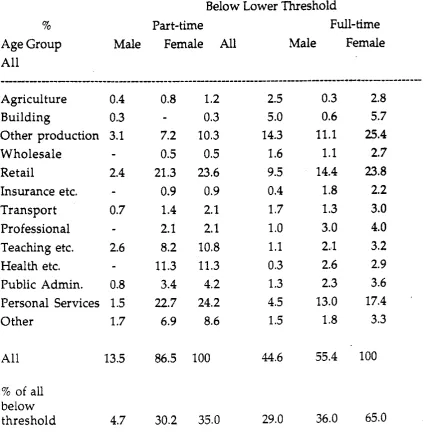
Some interesting differences between part- and full-timers are also apparent in the industry and occupational grouping of the low paid. Concentrating first on the industrial sectors in which employees work, Table 7 shows that for full-time workers, men are more heavily concentrated in building and production, and women in commerce and professional and other services. Part-time low-paid workers, of either sex, tend to be even more heavily concentrated in commerce, professional and "other" sectors.
Looking at occupation rather than industry, Table 8 shows that 44 per cent of the part-time low-paid workers are service workers, compared to only 15 per cent of those in full-time low-paid work. A much higher
proportion of the latter are employed in production or as labourers. Unsurprisingly, low-paid employees in professional/ technical' occupations are more likely to be working part-time.
It is also relevant to look at the education level attained by the low paid, and compare it with other employees. The low paid - below either the £90 or £120 threshold - do not have a higher proportion with only the Primary Cert. or some secondary education without having obtained a certificate. They do have a relatively high proportion with Inter or Group Cert only, however, and less than 40% of the low paid (compared with about 47% of all employees) have a higher level than this. Only about 5-7% of the low paid have a post-Leaving Certificate qualification.
What is more striking, though, is the relatively low educational level attained by certain sub-groups of the low paid. Low-paid males working part-time are particularly noteworthy: about 60% of such individuals below the £90 threshold do not have a Group or Inter Cert. For part-time females the situation is not quite so extreme, the corresponding figure being 40%, but this is still considerably above the percentage of the full-Otime low paid without such a qualification. With the higher threshold this pattern still holds, though it is interesting that the distribution of part-time males now has a peak at both relatively low and relatively high education levels - about 53% have not attained a Group or Inter Cert., but 20% have some post-Leaving Certificate qualification.
14-Table 6
Employees Below Lower Threshold by Full-time/Part-time, Age and Sex
%
Age Group All
\
Below Lower Threshold
Part-time Full-time
Male Female All Male Female
_.,._
...__________________
,..________________________________________
.,.______
Under 25 3.5 16.0 19.5 30.1 37.4 67.6
25-34
3.9 24.0 27.9 7.6 9.6 17.235-44 1.9 19.2 21.1 4.3 3.0 7.3
45-54 1.2 14.0 15.2 2.2 4.2 6.5
55-64 1.5 6.6 8.1 0.3 0.8 1.1
65 and over 1.4 6.9 8.3 0.3 0.3
All 13.5 86.5 100 44.6 55.4 100
% of all below
Threshold 4.7 30.2 35.0 29.0 36.0 65.0
Table 7
\
Employees Below Lower Threshold by Part-time/Full-time, Industrial Sector and Sex
Below Lower Threshold
% Part-time Full-time
Age Group Male Female All Male Female
All
---Agriculture 0.4 0.8 1.2 2.5 0.3 2.8
Building 0.3 0.3 5.0 0.6 5.7
Other production 3.1 7.2 10.3 14.3 11.1 25.4
Wholesale 0.5 0.5 1.6 1.1 2.7
Retail 2.4 21.3 23.6 9.5 14.4 23.8
Insurance etc. 0.9 0.9 0.4 1.8 2.2
Transport 0.7 1.4 2.1 1.7 1.3 3.0
Professional 2.1 2.1 1.0 3.0 4.0
Teaching etc. 2.6 8.2 10.8 1.1 2.1 3.2
Health etc. 11.3 11.3 0.3 2.6 2.9
Public Admin. 0.8 3.4 4.2 1.3 2.3 3.6
Personal Services 1.5 22.7 24.2 4.5 13.0 17.4
Other 1.7 6.9 8.6 1.5 1.8 3.3
All 13.5 86.5 100 44.6 55.4 100
% of all below
threshold 4.7 30.2 35.0 29.0 36.0 65.0
Tables
Employees Below Lower Threshold by Part-time/Full-time, Occupation Group and Sex \
Below Lower Threshold
Part-time Full-time
Male Female All Male Female All
---Agric. workers . 1.1 0.8 1.9 2.8 2.8
Producers, etc. 2.7 3.8 6.6 19.2 8.9 28.1
Labourers 0.2 0.2 4.8 0.6 5.4
Transport &
Commerce 4.3 2.1 6.3 5.6 1.2 6.8
Commercial etc. 1.1 18.8 20.0 5.9 15.1 21.0
Service workers 3.6 40.1 43.7 2.8 12.4 15.2
Professional and
Technical 0.4 8.5 8.9 0.3 2.5 2.8
Others 0.6 0.6 0.8 0.7 1.6
All 13.5 86.5 100 44.6 55.4 100
---Distribution of earnings
For a number of reasons, any study of low pay must take account of the distribution of earnings. First, as indicated above, the relationship between the numbers in the lowest decile and the number on average or on two thirds earnings will depend on the distribution of earnings across all employees. An implication is that the criterion of the lowest decile will tend to pick up relatively less workers (by comparison with say two thirds of median earnings) than in countries with a. more equal distribution of earnings.
Second, the ratio of the lowest decile to both median and average earnings, as an approach to the measurement of low pay, will reflect the distribution of earnings across individuals. Third, one of the main concerns in a study of low pay is the link between low pay and poverty. In turn, the approach to poverty as relative deprivation puts a particular focus on the inequality
of incomes from work as a determinant of poverty. Fourth, we have emphasised the need to try to ascertain the ext~nt to which personal qualities or the structural features of the labour market are at work in determining low pay. If there is a rigidity over tii:ne in the structure of earnings from work, this suggests that deeply rooted structural elements are at work. That is, individuals may climb out of low pay, only to be replaced by others.
Earlier data over time on the distribution of earnings in industry in Ireland came from a series published by the Central Statistics Office up to 1968 on the annual distribution of industrial earnings by sex, taken from the Census of Industrial Production. That series was then dropped. Using this series, the ratio of lowest decile to median earnings for males aged 18 or over was as follows, for transportable goods industries:
Year 1960 1968
Ratio (%) 62.1 60.7
Thus, the distribution became somewhat more unequal in the 1960s. While the definitions of industry in the 1979 structure of earnings survey is somewhat wider, and the following data relate to all males and not just those aged 18 and over, the survey gives a useful comparison. The corresponding ratios are 58.3 per cent. for full-time males paid in full and 53.6 per cent for all males. This indicates a further increase in the degree of earnings inequality. From the 1987 survey the ratio is 54 per cent for all males in TGI and 55 per cent for full-time males in TGI.
Low pay and poverty
We now wish to focus attention on an area where the ESRI data are particularly revealing, that is on the overlap between low pay and poverty. A particular strength of the data set is that it allows not only the position of individual earners, but also that of the household to which they belong, to be analysed.
One issue which should be emphasised is the link between low pay and poverty. Again here, it is vital to distinguish between an association
between two elements and a cause-effect relation. This issue also has implications for the design of appropriate strategies, in this case in order to combat poverty. There is need to distinguish betwe'en the direct effects of low pay on the incidence of poverty and the indirect effects. The direct effects are simply the inability to sustain an adequate standard of living at the going rate of pay. The indirect effects are at least twofold. Low pay how has an impact on living standards in later life. For example, poverty among the elderly is dependent, among other things, on the extent to which the household has forms of income other than social welfare pensions - for example, through an adequate occupational pension. Those in low pay will almost certainly have no occupational pension or one which pays poor benefits and is unprotected against inflation. There will be little opportunity to accumulate savii:tgs.
The other indirect effect is related to the viewing of low pay as but one element among many which mark out disadvantage in the labour market - which would include the inter-relations between low pay, unemployment (and indeed, multiple spells of unemployment), absence from work due to sickness. Viewed in this way, there is a strong relation between this indirect effect and the second explanation for low pay which is mentioned above. For example, job instability may be associated with interrupted earnings and with inability to borrow except on onerous terms.
In order to examine the links between poverty and low pay, one would like to know something about changes in pay over the lifetime of the worker. Many estimates of earnings or of poverty have the drawback that they refer to a point in time rather than to the changes over the life cycle. If the low paid are defined to be those, say, in the bottom ten per cent of the earnings distribution, to what extent do the people in that bottom tenth change their position over time and possibly move across the boundary?
Measuring poverty
In studying the extent and nature of poverty in Ireland, ESRI research has applied a variety of poverty lines and approaches. One method of deriving such lines to which a good deal of attention has been paid is the
purely relative approach. This involves calculating poverty lines based on average income in the sample, taking differences in needs between households of different sizes and compositions into account. Three such lines - 40 per cent, 50 per cent and 60 per cent of average income - have been used, and the sensitivity of particular results to the line chosen examined. Here we employ these relative poverty lines to assess the extent of overlap between low pay and poverty, and consider the implications.
In calculating the relative poverty lines, a set of equivalence scales must be chosen, to permit the incomes of households of different compositions to be brought to a comparable basis. Here we use the broad set of scales or relativities implicit in the rates of payment of the Unemployment Assistance/Supplementary Welfare Allowance schemes. Taking the household head to be 1, this means that other adults count as 0.66, and children as 0.33, in calculating the total number of "adult equivalent units" in the household. Equivalent income is then calculated by dividing the household's income by the number of adult equivalent units. This then serves as the basis for the calculation of average equivalent income and the poverty lines, set at 40 per cent, 50 per cent and 60 per cent of this mean .
. The poverty lines this produces, in 1987 prices, are at levels of about £34, £40 and £48 per week for a single adult. These are well below the low pay
thresholds used above. It must be recalled though that,
(i) low pay is being assessed on the basis of gross income, but household
disposable income is used in calculating the poverty lines and the
household's situation vis-a-vis those lines;
(ii) low pay is purely based on the individual's own earnings; the situation of the household is being assessed on the basis of income of all household members, from all sources;
In the recently published ESRI study (Callan, Nolan, et al., .1989) it was seen that about 7.5 per cent, 17.5 per cent and 30 pei' cent of households in the sample were below the 40 per cent, 50 per cent and 60 per cent relative poverty lines respectively. It was also found that about 10 per cent of the households below the 50 per cent line, and 14 per cent of those below the 60 per cent line, were headed by someone currently working as an employee. This cannot, however, be taken as an indication of the importance of low pay as a determinant of household poverty, because of the complexities just described. Most obviously, those household heads could well have gross earnings above the low pay thresholds but have large families, and/ or they could be paying sufficient tax and PRSI to bring diposable income significantly below gross income (see Nolan and Callan, 1989 on the latter topic). Conversely, employees with earnings well below the low pay thresholds may not be in households below even the highest of the three poverty lines, because, for example, they are in households with other earners or other income sources.
Low pay and poverty in the Survey
In order to assess the extent of overlap between low pay and poverty, we begin by focusing on the lower of the two low pay thresholds • i.e., £90 per week usual pay · and the 50 per cent relative poverty line. We have seen that about 19 per cent of all employees in the sample had usual weekly pay below this cut-off. About 20 per cent of all households were below the 50 per cent relative poverty line. Only about 3 per cent of all the employees
in the sample were in such households though. Thus only about 9 per cent of the employees with earnings below the lower threshold were in households below the 50 per cent line. This did mean though that half the small number of employees in these households were themselves low paid.
A similar, though somewhat less striking, picture is given when we look
at the lower pay threshold together with the highest of the poverty lines, the 60 per cent one. About 30 per cent of households are below this poverty line, and 8.5 per cent of all employees are in such a household. About 20 per cent of the low paid employees are in a household below this line, accounting for 44 per cent of the employees in these households.
The higher of the low pay thresholds, £120 per week, can also be employed together with the 60 per cent relative poverty line. ,Now, about one-third of all employees are below the low pay threshold. Only 15 per cent of individuals below this threshold are in households below the 60 per cent relative poverty line. This does, however, account for over half the employees in these households. Taking the highest relative poverty line together with the higher of the low pay thresholds, 5 per cent of all employees are both themselves low paid and members of a 'poor' household.
In sum, then, the results show that
(i) most low paid individuals are not to be found in "poor" households; but
(ii) the majority of employees in "poor" households are themselves low paid.
The apparently paradoxical nature of these joint conclusions arises simply because most employees are not in poor households - most poor households do not contain an employee.
Even if only a relatively small proportion of low paid employees are in poor households, though, perhaps they are a distinctive group among the low paid, on whom policy could be targeted? Unfortunately, this does not seem to be the case: the low paid in poor households look rather like the low paid as a whole. Of those both below the lower threshold and in households below the 60 per cent line, for example, 66 per cent are female, 47 per cent are under 25, and a higher proportion in service occupations, than found for the low paid as a whole (for whom the figures were 66 per cent, 51 per cent and 26 per cent respectively, as shown in Tables 2 - 4). There is little difference between the industrial sectors in which the low paid in poor households and the low paid as a whole are found. So while there are some differences, they are not so marked that the low paid in poor households could be easily singled out for particular attention on the basis of their individual characteristics or industry/ occupation.
obvious importance is whether there are other household members with an income, and if so how many. For those below the lower threshold and
\
in households below the 60 per cent poverty line, about one-third of their households have no other person with an income - whether from work or social welfare. This contrasts with the low-paid who are in households above this poverty line, where almost all the households have another member in receipt of income.
A related factor is whether the low-paid person is the household head or not. Of the low-paid in households below the 60 per cent line, 25 per cent are household heads. Of those in households above this line, though, only 13 per cent are the head of the household. The position of the low-paid individual in the household, and the extent to which the household is dependent on that person's earnings, is critical to the relationship between low pay and poverty.
Another important factor, of course, is the size and composition of the household itself - which will determine the way in which total household income converts into equivalent income. The households below the poverty lines containing low-paid persons are, on average, larger than those above the lines and containing such an individual. More marked, though, is the difference in the number of children. About 63 per cent of the households below the 60 per cent relative poverty line and with a low-paid member (using the lower threshold) have one or more children. This compares with only 42 per cent of those with a low-paid member but above the 60 per cent line. Clearly, in-depth investigation of the households containing low-paid individuals, as well as further analysis of the characteristics of the individuals themselves, is required if the relationship between low pay and poverty is to be properly understood.
Broad conclusions
What may be even more striking is the relative stability of the wage structure over time - going back to the early 1960s\ Since 1960, the pay structure has, if anything, become more unequal, that is with those at the bottom of the distribution faring worse in terms of pay than those on average earnings. This relative stability has occurred despite the rise and fall of centralised pay bargaining over the period, attempts to change the wage structure by introducing a certain flat-rate element into wage increases, and changes in the social welfare code such as the introduction of Family Income Supplement. It has also occurred in the face of many changes in the labour market: including the changes in employment across sectors, the entry of more qualified cohorts of young workers onto the labour market, and a rise in what has been called "atypical" forms of work: part-time, temporary and contract. or own account working.
Two sets of policy issues are often mooted in order to address low pay. One is intervention in pay bargaining - such as through flat-rate wage increases - but the above experience suggests that past efforts have seen the restoration of previous differentials after attempts have been made to change the wage structure.
Another is a measure such as the Family Income Supplement, designed to supplement the income of low-paid workers. The problem here, apart from the fact that this could operate as a subsidy for low pay, is that there
has been a low take-up of this means-tested benefit.
It would seem to date that labour market measures designed to improve
the lot of those at the bottom end of the labour market - those in insecure, low skilled jobs with little or no career enhancement - have had little or no impact on the pay distribution. And the concentration of incomes in low skilled and low status jobs, with a "flat" age-earnings profile over their life cycle does not seem to have changed much over the past decade. it is in these areas that some of the biggest problems still reside with regard
References
Callan, T., Nolan, B. et al, 1989. Poverty. Income and Welfare in Ireland.
Paper No. 146, Dublin: The Economic and Social ~esearch !nstitute.
Council of Europe, 1977. Biennial Report on the Implementation of the European Social Charter.