Abstract— Increasing global energy demands have generated an exponential growth of world biofuel production, among which ethanol can be found. This growth has been accompanied by rising accidental rates. Given the difficulty of modelling the human error in this type of facilities, the objective of the present work is to determine if there is correlation between production and the number of accidents. Additionally, a Multiple Correspondence Analysis and an Association Analysis through Contingency Tables are going to be made in order to determine association between the different analyzed variables. Data for analysis comprises accidents and incidents occurred at ethanol fuel facilities between 1998 and January, 2014.
Index Terms— accidents, biofuel, ethanol facilities, human error, risk.
I. INTRODUCTION
S in the case of biodiesel, the use of fuel ethanol is not new; its history can be traced back to the beginnings of the nineteen century. The first prototypes of internal combustion engines developed by Samuel Morey and Nicholas Otto in the 1826 and 1876 respectively, could work using ethanol as fuel. In 1896, Henry Ford built a car that could run using pure ethanol. Ten years later, his company developed the first series-produced car that had a flexible- fuel engine able to work using ethanol, gasoil or a mixture of both. The use of this biofuel spread to Europe and United States until the World War II when manufacturing and using of fossil-based diesel became more profitable due to its lower cost, availability and an easier process to obtain it [1], [2]. In Brazil, the first experience using ethanol from sugar cane as fuel took place in 1925, but it was in 1931 when bioethanol started to be produced and used as a fuel-vehicle.
Manuscript received March 23, 2015; revised April 10, 2015. This work was supported in part by the Secretaría de Ciencia, Técnica y Posgrado, Eng. Faculty, Cuyo National University.
R. D. Calvo Olivares is with the CONICET/CEDIAC Institute, Eng. Faculty, Cuyo National University, Centro Universitario, CO M5502JMA, Ciudad, Mendoza, Argentina (e-mail:[email protected]).
S. S. Rivera is with the CEDIAC Institute, Eng. Faculty, Cuyo National University, Centro Universitario, CO M5502JMA, Ciudad, Mendoza, Argentina (e-mail:[email protected]).
P. A. Baziuk is with the CONICET/CEDIAC Institute, Eng. Faculty, Cuyo National University, Centro Universitario, CO M5502JMA, Ciudad, Mendoza, Argentina (e-mail:[email protected]).
J. E. Núñez Mc Leod is with the CONICET/CEDIAC Institute, Eng. Faculty, Cuyo National University, Centro Universitario, CO M5502JMA, Ciudad, Mendoza, Argentina (e-mail:[email protected]).
The Brazilian ethanol industry faced difficulties through the years but it finally reached maturity [3]. Today Brazil is the second ethanol producer in the world.
Almost half century later, concern about the depletion of the world petroleum reserves and the environmental problems caused by the use of fossil fuels encouraged the research, promotion and development of alternative energy sources.
In this context, there was a revival in interest about ethanol as a possible substitute of fossil fuel. In fact, today ethanol is the most used liquid biofuel either as fuel or as a gasoline enhancer [2], [4].
In the last years, productions of biofuels such as ethanol and biodiesel have increased exponentially as shown in Figure 1.
Data have been obtained from the Statistical Review of World Energy, June 2014 [5].
Rising prices of crude due to geopolitical instability and armed conflicts, increasing global energy demand, and implementing of public policies and legal frameworks that limit carbon dioxide emissions and regulate the percentage of ethanol to be blended with gasoil, are factors that have contributed to this growth [2], [6].
Fig 1 World Biofuel (Ethanol and Biodiesel) Production. Period 1990-2013.
United States is the first ethanol producer in the world. According to the Renewable Fuels Association [7], the production levels reached about 50.6 million m3 in the year 2013 whereas install capacity was 211 plants. In the same year, Brazil produced 23.8 million m3 and Europe 5.2 m3.
As occurs with biodiesel [8], rising of production has been accompanied by increasing accident rates (Fig. 2), except during years 2012 and 2013 in which there was a diminish of accidents.
Data about world ethanol production in 2014 are not available yet.
Relationships between Main Accidental
Variables at Ethanol Fuel Industry
Romina D. Calvo Olivares, Selva S. Rivera, Pedro A. Baziuk and Jorge E. Núñez Mc Leod,
Members,
IAENG
[image:1.595.315.543.452.584.2]Fig 2 World Ethanol Production and Nº of accidents vs. year. Period 1998-2015.
In previous work [6], [8], [9] it was found that about 20% of the accidents (for a total of 39) occurred in the period from 2003 to January 2014 at biodiesel plants, was due to human error. However, in the case of fuel ethanol facilities, for the period 1998-2014 only 7.5% of the accidents (over a total of 64) were caused by human error. It is important to take into account that accidents under investigation or with no information about causes were excluded from the analysis. In this case, modelling of human error is not appropriate due to the results will not be significant. Therefore, relationships between the different variables involved will be studied in the present paper in order to establish tendencies or any correlation among them.
II. ETHANOL PRODUCTION
A. Process to obtain ethanol
The U.S. Department of Energy [10] has defined ethanol as an alternative fuel based on alcohol, obtained by the fermentation and distillation of feedstock with high content of sugars (e.g. sugarcane, sugar beetroot or sorghum) and starch (e.g. wheat, barley, corn). It can also be produced from lignocellulosic biomass such as wood, agricultural waste (e.g. corn stover and wheat straw) and energy crops [11], [12].
Fermentation of sugars is the most common process to produce ethanol but depending on the raw material used, previous steps to obtain the fermentable solution differs. When sugar cane or sugar beet are used as feedstock, hydrolysis is not required and sugar is extracted through pressure or diffusion [13]. Sugar cane or beet juice is extracted and mixed with molasses obtained in the previous sugar extraction step [14]. When using corn, the process to obtain the fermentable solution can be performed in two ways: wet and dry milling. The first one allows obtaining starch and the other, a mixture of milled corn and water (mash). In both cases, an enzymatic hydrolysis is needed to obtain simple sugars [13]. Lignocellulosic biomass, due to its complex structure, generally requires mechanical (e.g. crushing) and chemical (e.g. diluted acid, alkaline, solvent extraction) pretreatments of the cellulose and hemicellulose to make them more digestible. Then, simple sugars are obtained through acid or enzymatic hydrolysis [13].
Once the fermentable solution has been obtained, the alcohol is produced by the addition of yeast. Carbon dioxide
and minor quantities of other organic compounds are also generated in this stage. Next step involves distillation of the fermented mash in order to separate the alcohol from solids and water. Residual water is removed by dehydration. Finally, pure ethanol is denatured adding some substances such as gasoline or methanol to make it toxic and prevent from human consumption. In addition to CO2, distiller’s dried grains with solubles (DDGS) are also co-products from dry milling [11], [15]–[17].
B. Main process risks
Currently, more than half of fuel ethanol (67%) is produced from corn through the dry milling process [2] since it implies less costs of investment [14]. The risks of this process are mainly linked to flammability of the substances involved such as ethanol, ammonia and grain dust. Ethanol has a flash point between 12◦C and 13◦C that means it is very likely to cause fire during handling and storing if safety measures are not taken into account. Additionally, it is a polar solvent so it requires special firefighting procedures to extinguish important fires [18]. Ammonia is used to control pH and provide nitrogen for yeast during the fermentation step; it is also flammable and may form explosive mixtures with air. Grain dust is often generated during the corn milling and drying step to obtain DDGS and it can create explosions in presence of oxygen [19]. According to an article published in
[20], other potentially hazardous situations are related to grain engulfment and subcontracted works, that often imply beginning work without previous safety training and orientation at the plant.
To date, some accidents occurring during ethanol life cycle have been studied [17], [18].Recently, a database of accidents and incidents at fuel ethanol facilities has been obtained [19]. The database comprises general information about the event, its occurrence sequence, mitigation measures, type of accident, probable causes and consequences (injured people, fatalities and material damage). The record comprises 130 accidents and incidents that have taken place at fuel ethanol facilities between 1998 and January 2015.
The objective of the present work is to determine if there is correlation between production and the number of accidents. Additionally, a Multiple Correspondence Analysis and an Association Analysis through Contingency Tables are going to be made in order to determine association between the different analyzed variables.
III. CORRELATION ANALYSIS
The correlation analysis is used to study the relationship between two variables, X e Y, obtaining a measure that considers the deviation of data respect to the mean of each variable, simultaneously.
for the correlation coefficient “r” between random variables X e Y.
)
(
).
(
)
,
(
Y
Var
X
Var
Y
X
Cov
r
(1)Where:
n
Y
X
Y
X
Y
X
Cov
n i n i i i n i i i
1 11
)
,
(
(2)n
X
X
X
Var
n i i n i i 2 1 1 2)
(
(3)n
Y
Y
X
Var
n i i n i i 2 1 1 2)
(
(4)n
=number of (X,Y) pairsThe correlation coefficient “r” was obtained between the variables “Ethanol production” and “Number of accidents”.
It was calculated not only for world ethanol production but also for US ethanol production since the 86% of the registered accidents in [19] have occurred in the US. Information about world annual production was obtained from a compilation done by the Earth Policy Institute [21] and from USDA-FAS [22]. Data for United States Ethanol Production were obtained from the Renewable Fuels Association [7] and the EIA Monthly Energy Review [23].
Data are shown in Table I and results in Table II.
Results in Table II show that there is a positive correlation between production and the number of accidents. This means that a growth of production could imply an increase of the number of accidents. Therefore, it is crucial to adopt necessary safety practices and procedures in order to revert this situation. According to [19] special attention should be
paid to ethanol and ammonia storing, to maintenance tasks in order to avoid equipment-mechanical failures, and to the equipment used to obtain DDGs.
IV. SIZE OF PLANTS
Next step, involved the study of the size of plants to establish if there is any relationship with the number of accidents occurred. Clustering of ethanol facilities have been made according to the described ranges in [24]. The resulting classification of facilities and the corresponding number of accidents and incidents for each cluster are shown in Table III.
Results show that accidents are more frequent at Medium size plants. In fact, 38% of the adverse events have occurred at Medium size plants. More common causes are equipment-mechanical failures (18%) and ignition of corn grain or corn dust (18%). Human Error is involved in only 4% of the cases.
V. CORRESPONDENCE ANALYSIS
The Correspondence Analysis (CA) is an exploratory technique that allows representing rows and columns of a Contingency Table [25]–[28]. It also permits to explore graphically the association or correspondence between categorized variables. The CA is used for variables that are qualitative in nature.
When the CA is made over a two-way single table (with two variables) is denominated Simple Correspondence Analysis (SCA). On the other side, Multiple Correspondence Analysis (MCA) allows exploring multidimensional tables (more than two variables). Multivariate observations are plot in two-dimension graphics to identify the higher weight associations between modalities of several qualitative variables.
The CA operates on the Chi square deviations matrix. The method measures which are the combinations of modalities that have more inertia (that contribute most to reject the independence hypothesis between variables).
Results can be displayed in a graphic known as Biplot [29]. In a Biplot, those points that are visualized in the same direction respect to the origin are correlated positively whereas those that are in opposite directions are negatively correlated.
TABLEI
DATASET FOR CORRELATION ANALYSIS
Year
World Ethanol Production in
thousand m3
Nº accidents in the world U.S. Ethanol Production in thousand m3 Nº accidents in the U.S.
1998 19278 1 5339 1
1999 18893 1 5567 0
2000 17173 4 6165 3
2001 18520 5 6708 4
2002 20597 4 8133 4
2003 24297 4 10657 3
2004 28566 5 12937 3
2005 31263 3 14837 3
2006 39343 5 18559 4
2007 49868 6 24780 5
2008 67047 16 35375 13
2009 77152 22 41565 18
2010 88582 10 50533 9
2011 85136 14 52931 14
2012 82886 6 50229 5
2013 89031 5 50586 4
2014a Not available 15 49533 15 2015b Not available 4 Not available 4
aData about production in 2014 are available till November. bData about number of accidents are registered till January 2015.
TABLEII CORRELATION COEFFICIENT
Variables r
U.S. Ethanol Production - Nº of Accidents 0,71
World Ethanol Production - Nº of Accidents 0,66
TABLEIII
CLUSTERING OF PLANTS ACCORDING TO SIZE
Size Nº of accidents
Small (<190 thousand m3) 27
Medium (190<s<380 thousand m3) 50
Large (>380 thousand m3) 34
A. CA on data about ethanol accidents and incidents
Almost all variables registered in the database for accidents and incidents occurring at fuel ethanol facilities [19] are qualitative in nature. For this reason, the MCA can be applied to establish if there is any association between those variables.
At first place, SCA analysis between segmentation according to plant size and type of accident, and between size and causes of accident were performed in order to identify if there is any kind of association. At second place, a MCA between size, human and material damage was also made.
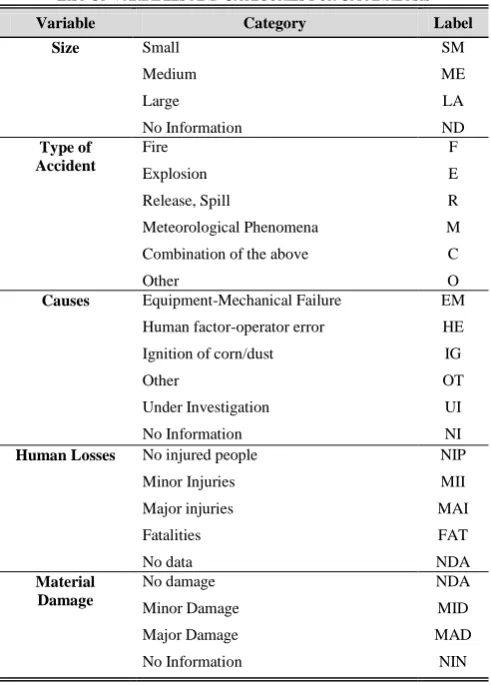
The implementation of the AC technique requires the definition of categories for each of analyzed variables. Five variables have been selected to make the analysis: Size, Type
of accident, Causes, Human Losses and Material Damage. For each of them, different categories (between 4 and 6) have been designated and its corresponding label. Label is assigned to simplify the register of data in the statistical software used to perform the analysis. The rest of the variables of the accident database [19] have not taken into account in the current study. Table IV shows the different categories for each variable analyzed in the present work.
The analysis was performed using the software Infostat, version 2014. Biplots obtained are shown in Fig.3, Fig. 4 and Fig.5.
Fig.3 shows in Axis 1 (with an inertia of 73.22%) that in Large-Scale plants (LA) releases or spills (R) are the most common type of accident. Small (SM) and medium (ME) scale plants are mainly associated to explosions (E) and to a
combination of fire, explosion, spill and/or meteorological phenomena (C).
Fig.4 shows in Axis 1 (with an inertia of 57.13%) an association between small (SM) and medium (ME) size plants and other causes (OT) such as for example spontaneous combustion or external events, as the common cause of accidents.
Fig 3 Biplot corresponding to the crossing between plant segmentation and type of accident.
Fig 4 Biplot corresponding to the crossing between plant segmentation and causes of accident.
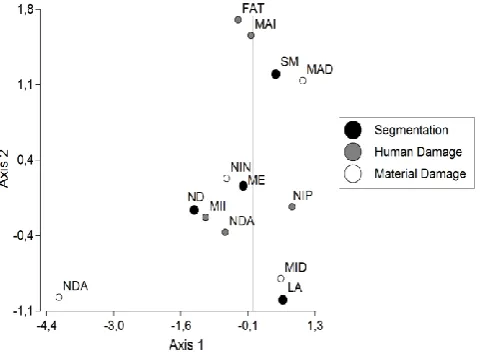
According to the MCA showed in Fig.5 (inertia 15.47%), fatalities (FAT) and major injuries (MAI) occur with more frequency at medium size plants (ME) but there is not enough information about material damages (NIN). Major damages (MAD) are more common at small size plants (SM) and minor damages (MID) at large size plants (LA).
VI. CONTINGENCY TABLES
Finally, contingency tables were used to determine if the observed associations between variables in figures 3, 4 and 5 are significant or at random.
This kind of tables are useful to analyze simultaneously TABLEIV
LIST OF VARIABLES AND CATEGORIES FOR CAANALYSIS
Variable Category Label
Size Small SM
Medium ME
Large LA
No Information ND
Type of Accident
Fire F
Explosion E
Release, Spill R
Meteorological Phenomena M
Combination of the above C
Other O
Causes Equipment-Mechanical Failure EM
Human factor-operator error HE
Ignition of corn/dust IG
Other OT
Under Investigation UI
No Information NI
Human Losses No injured people NIP
Minor Injuries MII
Major injuries MAI
Fatalities FAT
No data NDA
Material Damage
No damage NDA
Minor Damage MID
Major Damage MAD
[image:4.595.307.548.149.311.2] [image:4.595.44.290.245.588.2] [image:4.595.304.545.369.567.2]two or more categorized variables. It is a dual-entry table that contains the modalities of two categorical variables in the header of rows and columns. Table body contains observed frequencies for the combination of modalities corresponding to rows and columns. From these data, expected frequencies are obtained and the Chi-Square statistic is applied to test the null hypothesis [30]. It is considered as null hypothesis that there is no association between the variables. If the p value obtained through the test is less than 0.0001 (p<0.0001), then the null hypothesis is accepted. A more detail and complete explanation about construction of contingency tables has been made by Agresti [31].
Fig 5 Biplot corresponding to the crossing between plant segmentation, human and material damage.
Contingency tables for the crossing of variables previously studied were performed using Infostat. It was obtained that p values were significantly higher than 0.0001 for the three cases (see Table V). Therefore, the observed associations in Fig. 3, 4 and 5 are at random and it is not possible to affirm that variables are correlated.
VII. DISCUSSION
Analysis of exposed results shows that production is correlated positively with the number of accidents. According to the Agricultural Outlook 2011-2020 [32], world ethanol production is projected to continue their rapid growth over the projection period and to reach 155 million m3 by the year 2020. This growth is promoted by public policies (e.g. normative that limit carbon dioxide emissions, regulations about the percentage of biofuel to be blended with fuel) and goals about renewable energy. Therefore, due to the positive correlation between production and number of accidents, it could be expected an increment of accident rates if safety measures are not taken into account.
On the other side, type of accident, causes and consequences are not determined by the size of plants. The information studied shows that associations are not significant and they are at random. That means that there are other factors such as for example human error, which introduces randomness in the system.
To date, knowledge about accidents caused by human error is restricted due to the lack of complete information. This
hampers the application of tools like modelling and, therefore understanding of human behaviour is limited. For an important part of events registered, data about accidental sequence, mitigation measures and causes is not available. Similar to what occurs with biodiesel, it has been found that there is not information for 30% of the accidents at ethanol facilities, and for 21%, causes are ‘under investigation’.
The present work is an attempt to contribute to general knowledge of accident and incident causation in biofuel industry. It is also a continuation and a complement to previous work [6], [8], [9], [19]. However, scarcity of complete data has been identified as a key problem that does not allow a deeper study about causes of acccidents. The organization’s managerial level is responsible for providing adequate tools and procedures to do it. Information gathered will be useful during accident research to identify more probable causes and type of accidents, tendencies and accident recurrence, between others. Decision about preventive measures to apply in order to diminish accident rates will depend on these data.
VIII. CONCLUSION
The present work studied the relationships between main variables registered for each accidental event to determine if there is correlation. The Correspondence Analysis was the applied technique to do this. Contingency Tables were used to verify through the Square- Chi Test if the relationships observed in the Biplots were significant.
It was found that there is no correlation between the size of the plant and the type of accidents, the causes and the consequences (human and material damage).
Production and number of accidents are positively correlated. This implies that a growth of production brings about an increment of accidents. It is recommended to implement preventive maintenance programs to avoid or diminish equipment- mechanical failures. Respect to the production of DDGS, safer procedures should be incorporated to reduce risk of fire and explosions in dryers such as, for instance, periodic cleaning of the fan, inspection of safety devices such as thermostats, high temperature limit switches and flame detectors, etc. Finally, the storing of ethanol and ammonia requires containers of suitable material, adequate ventilation and avoiding proximity to ignition sources.
For subcontracted works, it is suggested safety training and orientation at the plant, before beginning the work.
Respect to grain engulfment; operators should adopt safer practices like the use of harnesses and a strict control of the opening and closing of silo valves that allow the entrance of grain.
TABLEV
P VALUES FOR CHI SQUARE TEST
Analyzed Variables p
Segmentation-Type of accidents 0.6316
Segmentation-Causes 0.2205
[image:5.595.48.289.206.382.2]Finally, it is important to take into account that in the last years, research trends on fuel ethanol production focus on the use of alternative technology and feedstock (e.g. lignocellulosic biomass) in order to obtain ethanol at lower cost. The use of new technologies and productive procedures imply new human- machine interfaces and, consequently, the possible emergence of new incidental or accidental events for which human error can be involved.
ACKNOWLEDGMENT
Authors thank to Agrarian Sciences Faculty of National University of Cuyo that provided the license to use the software Infostat.
REFERENCES
[1] B. D. Solomon, J. R. Barnes, and K. E. Halvorsen, “Grain and cellulosic ethanol: History, economics, and energy policy,” Biomass Bioenergy, vol. 31, no. 6, pp. 416–425, Jun. 2007.
[2] S. I. Mussatto, G. Dragone, P. M. R. Guimarães, J. P. A. Silva, L. M. Carneiro, I. C. Roberto, A. Vicente, L. Domingues, and J. A. Teixeira, “Technological trends, global market, and challenges of bio-ethanol production,” Biotechnol. Adv., vol. 28, no. 6, pp. 817–830, Nov. 2010. [3] Rogério Cerqueira Leite and Luís Augusto Barbosa Cortez, “O Etanol
Combustível No Brasil,” Revista Biocombustíveis no Brasil: Realidades e Perspectivas, Ministério das Relações Exteriores., 2008.
[4] Ó. J. Sánchez and C. A. Cardona, “Trends in biotechnological production of fuel ethanol from different feedstocks,” Bioresour. Technol., vol. 99, no. 13, pp. 5270–5295, Sep. 2008.
[5] “BP Statistical Review of World Energy June 2014,” 2014. [Online]. Available: http://www.bp.com/statisticalreview. [Accessed: 25-Feb-2015].
[6] Calvo Olivares R., Rivera, S., and Núñez Mc Leod, J., “An Approach to Modelate Human Error on Biodiesel Plants: Analysis of Active Failures and Latent Conditions,” in Transactions on Engineering Technologies, Springer Science+Business Media Dordrecht G.-C. Yang et al. (eds.), 2015.
[7] RFA, Renewable Fuel Assossiation, 2013. Available: http://ethanolrfa.org/. Accessed: 31-Jul-2014.
[8] Calvo Olivares R., Rivera, S., and Núñez Mc Leod, J., “Analysis of Active Failures and Latent Conditions on Biodiesel Production Facilities. International Association of Engineering; Lecture Notes in Engineering and Computer Science, London, UK, 2014.”
[9] R. D. Calvo Olivares, S. S. Rivera, and J. E. Núñez Mc Leod, “Database for accidents and incidents in the biodiesel industry,” J. Loss Prev. Process Ind., vol. 29, pp. 245–261, May 2014.
[10] US Department of Energy—US DOE, Alternative fuels—ethanol. Available: http://www.eere.energy.gov/afdc/altfuel/ethanol.html. Accessed: 25-May-2007.
[11] J. C. Escobar, E. S. Lora, O. J. Venturini, E. E. Yáñez, E. F. Castillo, and O. Almazan, “Biofuels: Environment, technology and food security,” Renew. Sustain. Energy Rev., vol. 13, no. 6–7, pp. 1275–1287, Aug. 2009.
[12] M. Balat, H. Balat, and C. Öz, “Progress in bioethanol processing,”
Prog. Energy Combust. Sci., vol. 34, no. 5, pp. 551–573, Oct. 2008. [13] C. A. Cardona and Ó. J. Sánchez, “Fuel ethanol production: Process
design trends and integration opportunities,” Bioresour. Technol., vol. 98, no. 12, pp. 2415–2457, Sep. 2007.
[14] E. İçöz, K. Mehmet Tuğrul, A. Saral, and E. İçöz, “Research on ethanol production and use from sugar beet in Turkey,” Biomass Bioenergy, vol. 33, no. 1, pp. 1–7, Jan. 2009.
[15] C. Matthew Rendleman and Hosein Shapouri, “New Technologies in Ethanol Production,” Department of Agriculture, United States, Agricultural Economic Report 842, Feb. 2007.
[16] J. R. Kwiatkowski, A. J. McAloon, F. Taylor, and D. B. Johnston, “Modeling the process and costs of fuel ethanol production by the corn dry-grind process,” Ind. Crops Prod., vol. 23, no. 3, pp. 288–296, May 2006.
[17] C. Riviére and G. Marlair, “The use of multiple correspondence analysis and hierarchical clustering to identify incident typologies pertaining to the biofuel industry,” Biofuels Bioprod. Biorefining, vol. 4, no. 1, pp. 53–65, Jan. 2010.
[18] G. Marlair, P. Rotureau, H. Breulet, and S. Brohez, “Booming development of biofuels for transport: Is fire safety of concern?,” Fire Mater., vol. 33, no. 1, pp. 1–19, 2009.
[19] Calvo Olivares R., Rivera, S., and Núñez Mc Leod, J., “Database for accidents and incidents in the fuel ethanol industry,” Submitted for publication.
[20]Ethanol Producer Magazine Website, 2011. Available: http://www.ethanolproducer.com/. Accessed: 06-Aug-2014.
[21]Earth Policy Institute,“World Fuel Ethanol Production, 1975-2012”, 2012. Available: www.earth-policy.org. Accessed: 31-Jul-2014. [22]United States Department of Agriculture-Foreign Agricultural Service
(USDA-FAS). Available: http://www.fas.usda.gov/data.
[23] U.S. Energy Information Administration (eia)., “Independent Satatistics and Analysis.” Available: www.eia.gov. Accessed: 29-Aug-2014. [24] Biomass Magazine Website,“Comparing Plant Capacities of U.S.
Ethanol & Biodiesel Industries”. Available: www.biomasmagazine.com. Accessed: 17-Mar-2015.
[25] Greenacre, M.J., Theory and Applications of Correspondence Analysis. London: Academic Press, 1984.
[26] Greenacre, M.J., “Correspondence Analysis of Multivariate Categorical Data by Weighted Least-Squares.,” Biometrika, vol. 75, pp. 457–467, 1988.
[27] Greenacre, M.J., “Multiple and Joint Correspondence Analysis”, in
Correspondence Analysis in the Social Sciences, London: Academic Press, 1994.
[28] Lebart, L., Morineau, A., and Warwick, K.M., Multivariate Descriptive Statistical Analysis: Correspondence Analysis and Related Techniques for Large Matrices. New York: John Wiley & Sons, Inc., 1984. [29] Greenacre, M.J. and Hastie, T., “The Geometric Interpretation of
Correspondence Analysis.,” J. Am. Stat. Assoc., vol. 82, pp. 437–447, 1987.
[30] Balzarini M., Di Rienzo, J., Tablada M., Gonzalez, L., Bruno C., Córdoba, M., Robledo W., and Casanoves, F., Estadística y biometría :
ilustraciones del uso de Infostat en problemas de agronomía, 2da ed. Córdoba, Brujas: Editorial Brujas, 2015.
[31] Agresti, A., Categorical Data Analysis. John Wiley & Sons, Inc., New York., 1990.