University of Southampton
Optoelectronics Research Centre
Paper number: 1642
Southampton SO17 1BJ, UK. Telephone: +44 2380 593150 E-mail: [email protected]
Integrated Optical Sensor System for Beverage Analysis
B.J.Luff , K.Kawaguchi , and J.S.Wilkinson a b a
Optoelectronics Research Centre, University of Southampton, Highfield, Southampton, a
Hampshire, UK, SO17 1BJ
Kyoto Electronics Manufacturing Co., Ltd., 68 Ninodan-cho, Shinden, Kisshoin, Minami-ku, b
Kyoto 601, Japan
Abstract
Integrated optical transducers for the detection of chemical and biochemical species and for optical measurements on bulk media are the subject of intense research effort. While many such sensors have been demonstrated in research laboratories worldwide, commercial exploitation of integrated optical sensors has proceeded slowly. Progress towards incorporating multiple-output sensors, based around the use of integrated optical Mach-Zehnder interferometers (MZI's), into a robust and inexpensive instrument is described in this paper. A 1D CCD array is used to acquire the multiple outputs, resulting in ready alignment and a flexible approach to device reconfiguration and offering particular promise for application to multianalyte transducers where several signals must be interrogated simultaneously. The sensitivity and low noise demonstrated by the detection system is expected to allow the use of cheap, stable, LED light sources in practical systems.
1. INTRODUCTION
The objectives of this study were to demonstrate an economical waveguide refractometer instrument for measurements on beer, wine and soft drinks. Conventionally these measurements are made at wavelengths close to 590nm, so that the options of using a laser operating close to 635nm and an LED operating at 590nm have been pursued.
In the first instance the analyte refractive index range of interest is from 1.32 to 1.41, although future work exploiting these sensors may explore analytes having indices as high as 1.6, requiring the use of a substrate glass of commensurately high index. The Mach-Zehnder interferometer has been chosen for this instrument, as it shows high-sensitivity, is straightforward to design and fabricate, and is tolerant of manufacturing error. The interferometer responds to changes in the refractive index of analyte in the waveguide evanescent field in a region of one branch defined by a window in an isolation layer otherwise covering the device. However, sensitive transducer response to small changes in index requires that the device operates in a sensitive region of the response curve; this cannot be satisfied over the complete range of indices for a single-output MZI, which shows maxima and minima in the interference function. The use of a three-waveguide output coupler at the output of the MZI results in three outputs with interference functions which are shifted by nominally 120 with respect to each other. In this way at least one output yields ao sensitive response to small analyte index changes notwithstanding the starting value[5]. While this tightens the constraints on manufacture somewhat, it also allows referencing the individual signals to the sum of the signals emerging from the three outputs, removing the effects of source intensity fluctuations. Alternatively, in conjunction with an independent reference output, it potentially allows measurement of the optical absorption of the analyte as well as its refractive index.
In this paper we present measurements on multiple-output integrated optical sensor devices using fibre input coupling and a cheap, readily available, 1D CCD array detector to simultaneously address all outputs. This approach leads to a low-cost reconfigurable approach to the simultaneous acquisition of multiple outputs. A lens is used to focus the waveguide outputs onto the array, resulting in a compact unit that can be housed in a standard instrument package. A further advantage of this arrangement is that other optical elements such as filters and polarisers can readily be inserted into the beam path. Work is presently in progress to precisely stabilise the temperature of the sensor surface through feedback control and to explore the use of selective polymers in sensor arrays for quantification of chemical species of interest in beverage analysis.
2. TRANSDUCER DESIGN
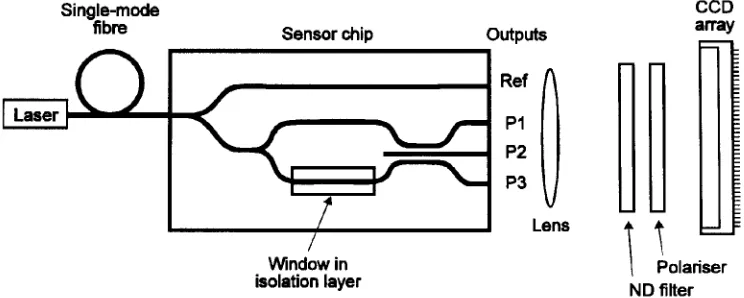
The sensor transducer chip is shown as part of the experimental setup in Figure 1: for this work we used an integrated optical Mach-Zehnder interferometer (MZl) device fabricated in BGG36 glass (Schott) by Ag -Na ion-exchange [5]. This substrate glass has a refractive index of+ + approximately 1.6 at the wavelengths of interest, allowing measurements on analytes of indices up to 1.6. A titanium masking film was deposited on the substrate and windows 2µm wide were opened in it using conventional photolithography, resulting in the optical circuit shown in Figure 1. The minimum bend radius was 20mm, achieving an acceptable compromise between optical loss and circuit compactness. The three-output coupler, designed for a wavelength of 635nm, had a coupling length of 0.5mm and the waveguide centres were separated by 3.5µm, resulting in a strongly-coupled structure. Ion-exchange was carried out by immersing the masked substrate in a 10% AgNO / NaNO melt held at 310 C for 3 minutes; the device was then cleaned and3 3
o
annealed at 250 C for 4h, to reduce waveguide losses and improve coupling to optical fibre. Theo ends of the chip were then polished to allow input and output coupling, resulting in an overall length of approximately 40mm.
Fig. 1 Experimental sensor system
from the analyte. The silica was deposited by RF sputtering from an 8" pure silica target in an atmosphere of 6mT oxygen and 17mT argon, at a power of 400W for 4.5 hours, resulting in a film approximately 600nm thick A window was opened in the silica layer using a photolithographic liftoff technique to define the sensitive region of the waveguide. It was found that a further 1 hour annealing in air at 250 C was required to reduce the waveguide loss belowo 1.5dB/cm which resulted in an acceptable insertion loss for use with a laser source. This additional anneal had the effect of diffusing the ion-exchanged waveguide further into the substrate, which is expected to have reduced its interaction with the analyte and hence the MZI sensitivity.
The reference arm, from which nominally 50% of the power coupled into the chip emerges, is incorporated as a means of diagnosing excess losses in the MZI and coupler and because the sum
of the intensities of the other three outputs then potentially yields further information on analyte absorption as the sum reflects the total power loss through the interferometer. The separation between the output waveguides was 250µm to allow straightforward separation on the CCD array. Comparison of the relative intensities of the three outputs enables unambiguous determination of refractive index over one full period of the output interference function.
3. EXPERIMENTAL SYSTEM
Figure 1 shows the experimental sensor system. In the first experiments, light from a 10 mW 633 nm He-Ne laser was coupled into a single-mode fibre and the fibre was butt-coupled to the sensor chip. In later experiments, the laser was replaced by a Toshiba TLYH180P light-emitting diode (LED), emitting at 590nm The waveguides on the chip were single-moded at both 590nm and 633 nm. A 10X objective lens was used to focus the output signals on a Toshiba ID CCD array (cost around $40US). The distance from the CCD to the objective lens was 18 cm, giving a total magnification of 14 times. The CCD array has 3648 pixels; the pixel width and height were 8 mm and 200 mm, respectively. In the case of experiments using a laser, a 40 dB neutral density filter was placed between the lens and the detector to reduce the signal so that the CCD array was not saturated, and a sheet polariser was used to select the TE polarisation, with modal electric field parallel to the substrate surface.The extremely high sensitivity of the detector system allows less stringent fabrication tolerances as regards waveguide loss when using laser sources; it also opens up the possibility of using other sources that are less intense or which couple poorly to single-mode fibre, such as LEDs.
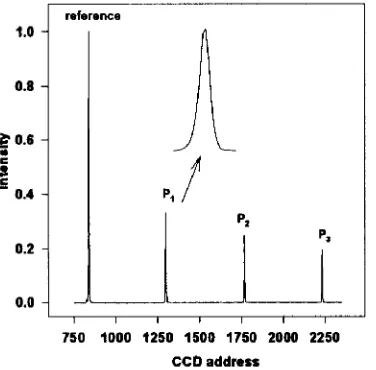
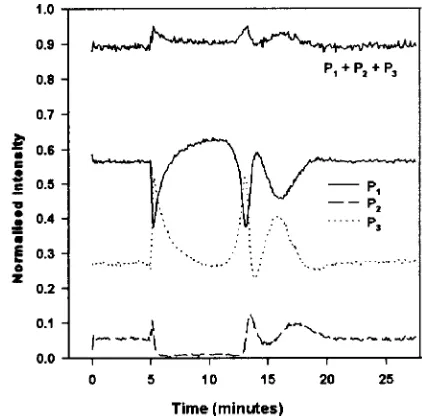
Figure 2 Output distribution on CCD array Figure 3 Sucrose solution test cycle
temperature at the sensor surface, however a temperature sensor was placed near the flow cell to monitor ambient temperature during measurement, and the temperature data were acquired, with the output data, on a PC.
4. RESULTS
[image:4.595.308.527.283.467.2]4.1 Refractive index measurements using a laser source.
Figure 2 shows the spatial distribution of the sensor output intensities when water is applied to the chip surface (n = 1.33299). The half power full width (HPFW) of the intensity profile of the light from a single waveguide output falling on the array is 34 mm. As the vertical dimensions of the mode profiles are of a similar magnitude, all the light from each output is incident on the 200 mm-high array. The measured signal for each output is taken as the sum of the intensities falling on the pixels within a region surrounding each feature. A background signal measured close to each feature was subtracted for each output. The integration time was 40 ms; for each data point in sucrose solution test cycle measurements several integrations were collected and averaged.
Figure 3 shows the temporal response of the sensor to a sucrose solution of refractive index n = 1.41045. Each output P P and P of the three-waveguide coupler is divided by the independent1, 2 3 reference output to compensate fluctuations in the input light intensity. Also shown is the ambient temperature and the sum of the three referenced outputs. The sum does not remain constant throughout the measurement due to the redistribution of power taking place between the waveguides of the coupler, which each exhibit somewhat different loss characteristics due to the presence of bends and fabrication errors. Corrections to the measured data to eliminate this effect will be made following further characterisation of the sensor. The sucrose pulse is injected into the flow stream and pumped at a constant rate through the flow cell during the measurement. Equilibrium levels are reached at around t = 10 minutes as the pure water is displaced completely from the cell and replaced with the sucrose solution; the sucrose solution is then washed out and replaced with water, and the signals return to their original levels.
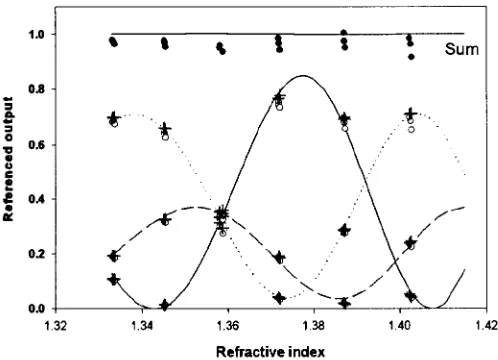
[image:4.595.76.264.286.471.2]Fig. 4 MZI phase against refractice index
Fig. 5 Response of sensor to absorbing solutions
power travelling in the analyte evanescent field as the analyte index increases. The demonstration system shown here is not yet temperature stabilised and therefore there is some drift due to variations in ambient temperatures. However, this setup provides an indication of the limit of detection by calculating the smallest detectable signal change considering the noise in the system. The sensitivity of the MZI close to the index of water is 4500 per unit index change, and theo phase resolution may be calculated from the system noise to be 0.3 , resulting in a minimumo detectable refractive index change of 7x10 .-5 Improvement in device fabrication by reducing total waveguide annealing time is expected to improve sensitivity and work is now in progress to package the transducer and detector in a permanent housing, with temperature control of the active region of the transducer, employing localised temperature sensors, and pigtailed fibre input. A reduction in minimum detectable index change of at least a factor of 10 is expected to result from these developments.
4.2 Effect of sample absorption.
Figure 7 Sucrose solution test cycle for LED source
Figure 6 Output distribution on CCD array for LED source
4.3 Refractive index measurements using an LED source.
The use of more compact and inexpensive light sources is being investigated, particularly 635 nm laser diodes and visible LEDs. Initial experiments indicate that sufficient light is coupled from standard packaged LEDs to single mode fibres to render their use with the current instrumentation a practical possibility.
Figure 6 shows the spatial distribution of the sensor output intensities on the CCD array when the laser light source is replaced with the LED and the 40dB neutral density filter is removed; in this case the background has not been subtracted. While the detected signal is clearly noisier, a readily measurable signal is detected from each of the sensor outputs. Reduction in waveguide loss and improvements in fibre coupling efficiency, combined with the expected availability of LED sources with higher brightness, are expected to result in further improvements in signal to noise ratio. The four output signals were derived from the CCD measurements as before, except that the integration time was increased to 1s. Figure 7 shows the temporal response of the sensor to a pulse of sucrose solution of refractive index n = 1 .41045, repeating the measurement as for the laser source. The change in wavelength has shifted the operating point of the sensor and altered its sensitivity, and the broad bandwidth of the source has reduced the visibility of the interference fringes. However, these preliminary results are encouraging for future work using LED sources.
5. CONCLUSIONS
measurements. The use of an LED source at the industrially important wavelength of 590nm has shown that readily measurable signals may be obtained using CCD array imaging and that interferograms may be generated by altering the sucrose content of the aqueous analyte. However, further work is required on the annealing of the silica isolation layers, to improve device insertion loss, before acceptable signal-to-noise ratios are obtained. Future research will include integration of arrays of sensors on a single chip with selective polymer films for species of interest in beverage analysis, and immunoassays for medical applications. The performance of the demonstrator setup indicates that further development of the method and application of low-cost light sources will lead to the first truly practical integrated optical multisensor instrument.
6. ACKNOWLEDGEMENTS
This work was funded by the Kyoto Electronics Manufacturing Co., Ltd., Japan. The Optoelectronics Research Centre is an Interdisciplinary Research Centre funded by the UK Engineering and Physical Sciences Research Council.
7. REFERENCES
[1] C.Piraud, E.K.Mwarania, G.Wylangowski, J.S.Wilkinson, K.O'Dwyer & D.J.Schiffrin, "Optoelectrochemical Thin-Film Chlorine Sensor Employing Evanescent Fields Planar Waveguides", Analytical Chemistry, v.64, pp.651-5, 1992.
[2] B.Drapp, J.Piehler, A.Brecht, G.Gauglitz, B.J.Luff & J.S.Wilkinson, "Integrated Optical Mach-Zehnder Interferometers as Simazine Imnmunoprobes", Sensors and Actuators B, v.39, pp.277-282, 1997.
[3] Ch. Fattinger, H.Koller, D.Schlatter & P.Wehrli, "The Difference Interferometer - A Highly Sensitive Optical Probe for Quantification of Molecular Surface Concentration", Biosensors & Bioelectronics, v.8, pp.99-107, 1993.
[4] C.Mouvet, R.D.Harris, C.Maciag, J.S.Wilkinson, B.J.Luff, J.Piehler, A.Brecht, G.Gauglitz, R.Abuknesha & G.Ismail, "Determination of Simazine in Water Samples by Waveguide Surface Plasmon Resonance", Analytica Chimica Acta, v.338, pp.109-1 17, 1997.