Original Article
Negative correlation between leptin serum levels and
sarcopenia in hemodialysis patients
Yu-Li Lin1, Chih-Hsien Wang1,2, Yu-Hsien Lai1, Chiu-Huang Kuo1, Ru-Jiang Syu1, Bang-Gee Hsu1,2
1Division of Nephrology, Buddhist Tzu Chi General Hospital, Hualien, Taiwan; 2School of Medicine, Tzu Chi
Univer-sity, Hualien, Taiwan
Received December 23, 2017; Accepted January 17, 2018; Epub March 1, 2018; Published March 15, 2018
Abstract: Leptin is an adipokine secreted from adipocytes that mediate lipid metabolism and inflammation. This
cross-sectional study evaluated association between serum leptin level and sarcopenia in chronic hemodialysis (HD) patients. Blood samples and measurement of muscle mass, handgrip strength, and gait speed were obtained from 76 chronic HD patients. We grouped participants into sarcopenia and non-sarcopenia groups according to the Asian Working Group for Sarcopenia. Eight (10.5%) of the total participants were in the sarcopenia group. Compared to the non-sarcopenia group, patients in the sarcopenia group were lower in height (P = 0.014), weighed less (P < 0.001), had lower waist circumference (P < 0.001), body mass index (BMI, P < 0.001), body fat mass (P = 0.048), serum triglyceride (P = 0.032), creatinine (P = 0.017), phosphorus (P = 0.015), leptin level (P = 0.001), appen-dicular skeletal muscle mass (P < 0.001), and handgrip strength (P = 0.043). However, urea reduction rate (URR,
P < 0.001) and Kt/V (P < 0.001) were higher. After multivariate stepwise linear regression, lower logarithmically
transformed leptin (log-leptin, β: -0.392, adjusted R2 change = 0.130, P < 0.001), lower URR (β: -2.491, adjusted
R2 change = 0.054, P < 0.001)), lower handgrip strength (β: -0.243, adjusted R2 change = 0.030, P = 0.013), lower serum phosphorus level (β: -0.176, adjusted R2 change = 0.023, P = 0.036), and higher Kt/V (β: 2.878, adjusted
R2 change = 0.319, P < 0.001) were the independent predictors of sarcopenia in chronic HD patients. We conclude
that low serum leptin level is independently associated with sarcopenia in chronic HD patients. Further studies are needed to establish the casual relationship between circulating leptin levels and uremic sarcopenia.
Keywords: Sarcopenia, leptin, hemodialysis
Introduction
Sarcopenia, first described by I. H. Rosenberg
in 1988 in geriatric population, is characterized by a progressive decline of muscle mass and strength and leads to increased morbidity and mortality [1, 2]. In addition to aging, sarcopenia is often observed in patients with chronic kid-ney disease (CKD) and end-stage renal disease (ESRD), which is also called uremic sarcopenia [3-5]. Several possible mechanisms for uremic sarcopenia have been described which include
an increase in pro-inflammatory cytokines,
muscle protein imbalance, inactivity, hormone derangement, decline in satellite cells, meta-bolic acidosis, and myostatin overexpression [6].
Adipose tissue has been recognized as an endocrine tissue secreting various adipokines
involved in lipid metabolism, vascular function,
inflammation, and insulin resistance [7].
Moreover, emerging evidence has demonstrat-ed that adipokines also play a role in skeletal muscle homeostasis. As the skeletal muscle mass reduces, intramuscular adipose tissue
infiltration and visceral adipose tissue increas -es, indicating the possible role of adipokines on muscle [8]. Leptin, one of the most well-known adipokines secreted by adipose tissue, is a
16-kDa protein identified as a product of the
obesity gene and has important roles in
regula-tion of appetite, inflammaregula-tion, insulin sensitivi -ty, and fat deposition [7]. Its circulating levels positively correlate with weight, body mass index (BMI), and adipocyte counts in the gener-al population. Moreover, recent studies have shown that leptin is also released from skeletal muscle and that leptin receptors are abundant
muscle may be an important target for leptin. Several animal studies have demonstrated that leptin has a pivotal role on muscle metabolism in aged mice [13-16]. However, human data on leptin and sarcopenia are few and inconclusive. In addition, compared to the general
popula-tion, serum leptin level was significantly
in-creased in patients with ESRD primarily be- cause of decreased renal clearance [17]. Un- fortunately, evidence regarding an association between leptin and uremic sarcopenia is
limit-ed. Thus, the objective of our study was to
examine the association between serum leptin levels and uremic sarcopenia in chronic hemo-dialysis (HD) patients.
Materials and methods
Patients
This was a single-center cross-sectional study
performed from January 2015 until December 2015. A total of 76 patients older than 20 years of age and maintained on HD for at least 3 months at a medical center in Hualien, Eastern
Taiwan, were invited to participate in the study. The study was comprised of 43 males and 33
females and the subjects ranged in age from 31 to 91 years. Data about basic characteris-tics, medical history, and drug usage were col-lected. Blood pressure before HD was record-ed. Blood pressure of all participants was measured by trained staff using standard mer-cury sphygmomanometers with appropriate cuff sizes, after sitting for at least 5 minutes. All participants signed an informed consent approved by the Institutional Review Board of
Tzu-Chi Hospital.
Anthropometric analysis
Height was measured to the nearest half-centi-meter while subjects stood erect, barefoot, and with feet together. Body weight was measured to nearest half-kilogram with subjects wearing light clothing and without shoes, before and after hemodialysis. Waist circumference was measured to the nearest half-centimeter at the shortest point between the lower rib margin and the iliac crest. BMI was calculated as dry weight (kilograms) divided by height squared (meters).
Sarcopenia diagnosis
Sarcopenia, defined as having low muscle
ma-ss combined with low handgrip strength (HGS)
or slow gait speed was diagnosed by applying the Asian Working Group for Sarcopenia (AWGS) criteria [18]. Appendicular skeletal muscle ma- ss (ASMM) was assessed with the patient in the standing position by using a portable
whole-body bioelectrical impedance device (Tinita BC 706DB, Tanita Corporation, Tokyo, Japan). The
bio-impedance device, a non-invasive and high-ly available method to assess muscle mass, has a high correlation with thigh muscle cross-sectional areas, the gold standard for detection of sarcopenia [19, 20]. Low muscle mass was
defined as less than 7.0 kg/m2 and 5.7 kg/m2
in men and women, respectively. Body fat mass was measured using the same device. HGS was measured on the opposite hand of the arm with the arteriovenous shunt using a Jamar Plus Digital Hand Dynamometer (SI Instruments
Pty Ltd, Hilton, Australia). The patients were
instructed to apply as much handgrip pressure as possible while sitting with arms along the
body. Three trials were performed with a rest
period of 1 minute and the average value was
recorded. Low handgrip strength was classified
as HGS less than 26 kg for men and 18 kg for women. Gait speed was measured by walking for 5 meters in the usual speed. Gait speed <
0.8 m/s was defined as slow gait speed, both in
men and women. All three measurements of muscle mass, HGS, and gait speed were per-formed before and after HD and carried out by the same trained operator. Since bioelectrical impedance measurements may be affected by hydration status in chronic HD patients, post-dialysis measurements of muscle mass, HGS, and gait speed were used in further analysis [21].
Biochemical investigation
Blood samples of approximately 5 mL were immediately centrifuged at 3,000 g for 10 min-utes after collection. Serum samples were stored in a 4°C refrigerator and used for bio-chemical analyses within 1 hour of collection. Serum levels of blood urea nitrogen (BUN),
cre-atinine, glucose, total cholesterol (TCH), triglyc
-eride (TG), total calcium, phosphorus, and
C-reactive protein (CRP) were measured using an autoanalyzer (Siemens Advia 1800, Siemens
Healthcare GmbH, Henkestr, Germany). The
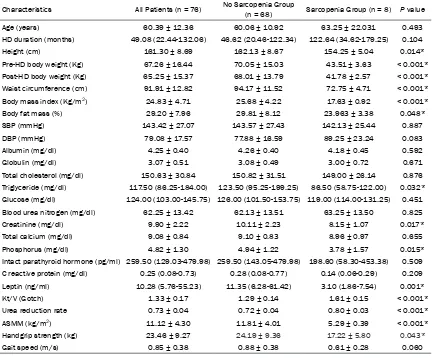
Table 1. Clinical variables of the 76 hemodialysis patients with or without sarcopenia
Characteristics All Patients (n = 76) No Sarcopenia Group (n = 68) Sarcopenia Group (n = 8) P value
Age (years) 60.39 ± 12.36 60.06 ± 10.92 63.25 ± 22.031 0.493
HD duration (months) 49.08 (22.44-132.06) 46.62 (20.46-122.34) 122.64 (34.62-179.25) 0.104
Height (cm) 161.30 ± 8.69 162.13 ± 8.67 154.25 ± 5.04 0.014*
Pre-HD body weight (Kg) 67.26 ± 16.44 70.05 ± 15.03 43.51 ± 3.63 < 0.001* Post-HD body weight (Kg) 65.25 ± 15.37 68.01 ± 13.79 41.78 ± 2.57 < 0.001* Waist circumference (cm) 91.91 ± 12.82 94.17 ± 11.52 72.75 ± 4.71 < 0.001* Body mass index (Kg/m2) 24.83 ± 4.71 25.68 ± 4.22 17.63 ± 0.92 < 0.001*
Body fat mass (%) 29.20 ± 7.96 29.81 ± 8.12 23.963 ± 3.38 0.048*
SBP (mmHg) 143.42 ± 27.07 143.57 ± 27.43 142.13 ± 25.44 0.887
DBP (mmHg) 79.08 ± 17.57 77.88 ± 16.59 89.25 ± 23.24 0.083
Albumin (mg/dl) 4.25 ± 0.40 4.26 ± 0.40 4.18 ± 0.45 0.592
Globulin (mg/dl) 3.07 ± 0.51 3.08 ± 0.49 3.00 ± 0.72 0.671
Total cholesterol (mg/dl) 150.63 ± 30.84 150.82 ± 31.51 149.00 ± 26.14 0.876 Triglyceride (mg/dl) 117.50 (86.25-184.00) 123.50 (95.25-199.25) 86.50 (58.75-122.00) 0.032* Glucose (mg/dl) 124.00 (103.00-145.75) 126.00 (101.50-153.75) 119.00 (114.00-131.25) 0.451 Blood urea nitrogen (mg/dl) 62.25 ± 13.42 62.13 ± 13.51 63.25 ± 13.50 0.825
Creatinine (mg/dl) 9.90 ± 2.22 10.11 ± 2.23 8.15 ± 1.07 0.017*
Total calcium (mg/dl) 9.08 ± 0.84 9.10 ± 0.83 8.96 ± 0.97 0.655
Phosphorus (mg/dl) 4.82 ± 1.30 4.94 ± 1.22 3.78 ± 1.57 0.015*
Intact parathyroid hormone (pg/ml) 259.50 (129.03-479.98) 259.50 (143.05-479.98) 198.60 (58.30-453.38) 0.509 C reactive protein (mg/dl) 0.25 (0.08-0.73) 0.28 (0.08-0.77) 0.14 (0.06-0.29) 0.209 Leptin (ng/ml) 10.28 (5.76-55.23) 11.35 (6.28-61.42) 3.10 (1.86-7.54) 0.001*
Kt/V (Gotch) 1.33 ± 0.17 1.29 ± 0.14 1.61 ± 0.15 < 0.001*
Urea reduction rate 0.73 ± 0.04 0.72 ± 0.04 0.80 ± 0.03 < 0.001*
ASMM (kg/m2) 11.12 ± 4.30 11.81 ± 4.01 5.29 ± 0.39 < 0.001*
Handgrip strength (kg) 23.46 ± 9.27 24.19 ± 9.36 17.22 ± 5.80 0.043*
Gait speed (m/s) 0.85 ± 0.38 0.88 ± 0.38 0.61 ± 0.28 0.060
Values for continuous variables given as means ± standard deviation and test by Student’s t-test; variables not normally distributed given as medians and interquartile range and test by Mann-Whitney U test. HD, hemodialysis; SBP, systolic blood pressure; DBP, diastolic blood pressure; WBC, white blood cell; Kt/V, fractional clearance index for urea; ASMM, appendicular skeletal muscle mass. *P < 0.05 was considered statistically significant.
urea kinetic model. Serum intact parathyroid
hormone levels (iPTH, Diagnostic Systems Laboratories, Webster, Texas, USA) and leptin
(SPI-BIO, Montigny le Bretonneux, France) con-centrations were measured using enzyme-linked immunosorbent assays and enzyme immunoassay, respectively [22-24].
Statistical analysis
Continuous variables were expressed as mean ± standard deviation (SD) and were tested for normal distribution using the Kolmogorov-Smirnov test. Comparisons between patients were made using Student’s independent t test (two-tailed) for normally distributed data or the Mann-Whitney U test for parameters that pre-sented with non-normal distribution (HD
dura-tion, TG, glucose, iPTH, CRP, and leptin).
Categorical data were expressed as the num-ber of patients and analyzed by Chi-square test. Clinical variables that correlated with serum leptin levels in HD patients were evaluated using univariate linear regression analysis.
Variables that were significantly associated
with leptin levels in HD patients were tested for independency in multivariate forward stepwise regression analysis. Because of HD duration,
TG, glucose, iPTH, CRP, and leptin were not nor-mally distributed and underwent base 10 loga-rithmic transformations to achieve normality.
Variables that were significantly associated
Inc., Chicago, IL, USA). A P-value < 0.05 was
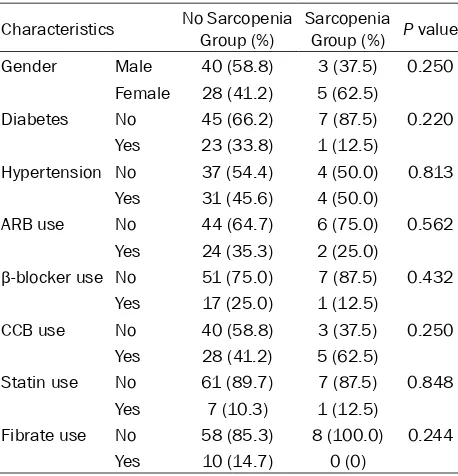
[image:4.612.92.321.95.333.2]considered statistically significant. BMI (0.577; r = 0.440; P < 0.001), globulin (P < 0.001), body fat mass (r = 0.255; Pr = = Table 2. Distribution of hemodialysis patients with or
without sarcopenia in subgroup analysis
Characteristics No Sarcopenia Group (%) Sarcopenia Group (%) P value
Gender Male 40 (58.8) 3 (37.5) 0.250
Female 28 (41.2) 5 (62.5)
Diabetes No 45 (66.2) 7 (87.5) 0.220
Yes 23 (33.8) 1 (12.5)
Hypertension No 37 (54.4) 4 (50.0) 0.813
Yes 31 (45.6) 4 (50.0)
ARB use No 44 (64.7) 6 (75.0) 0.562
Yes 24 (35.3) 2 (25.0)
β-blocker use No 51 (75.0) 7 (87.5) 0.432
Yes 17 (25.0) 1 (12.5)
CCB use No 40 (58.8) 3 (37.5) 0.250
Yes 28 (41.2) 5 (62.5)
Statin use No 61 (89.7) 7 (87.5) 0.848
Yes 7 (10.3) 1 (12.5)
Fibrate use No 58 (85.3) 8 (100.0) 0.244
Yes 10 (14.7) 0 (0)
[image:4.612.91.322.403.636.2]Data are expressed as number of patients and analysis was done using Chi-square test.
Table 3. Clinical characteristics and serum leptin levels of 76 hemodialysis patients
Characteristic Number (%) Log-Leptin (ng/ml) P value
Sex Male 43 (56.6) 1.07 ± 0.56 0.104
Female 33 (43.4) 1.29 ± 0.57
Diabetes No 52 (68.4) 1.14 ± 0.58 0.600
Yes 24 (31.6) 1.22 ± 0.56
Hypertension No 41 (53.9) 1.27 ± 0.62 0.093
Yes 35 (46.1) 1.04 ± 0.49
ARB No 50 (65.8) 1.20 ± 0.60 0.508
Yes 26 (34.2) 1.10 ± 0.51
β-blocker No 58 (76.3) 1.18 ± 0.59 0.625
Yes 18 (23.7) 1.11 ± 0.51
CCB No 43 (56.6) 1.22 ± 0.63 0.352
Yes 33 (43.4) 1.09 ± 0.49
Statin No 68 (89.5) 1.15 ± 0.56 0.527
Yes 8 (10.5) 1.29 ± 0.69
Fibrate No 66 (86.8) 1.14 ± 0.58 0.409
Yes 10 (13.2) 1.30 ± 0.54
Data of leptin levels showed skewed distribution and, therefore, were log-transformed before analysis. Data are expressed as mean ± standard deviation and test by Student’s t-test. ARB, angiotensin-receptor blocker; ACE, angiotensin-converting enzyme; CCB, calcium channel blocker.
Results
The clinical and laboratory characteristics in 76 HD patients with or without sarcope-nia are presented in Table 1. The mean
age of total participants was 60.39 ± 12.36 years, with 34% of patients aged > 65 years. Among these patients, 36 (47.4%) patients had low HGS, 30 (39.5%) patients had slow gait speed, and 8 (10.5%) patients had low muscle mass.
Eight (10.5%) patients were defined as
having sarcopenia according to AWGS cri-teria. Compared to the non-sarcopenia group, patients in the sarcopenia group were lower in height (P = 0.014) and weighed less (P < 0.001), had lower waist circumference (P < 0.001), BMI (P < 0.001), body fat mass (P = 0.048), serum
TG (P = 0.032), serum creatinine (P = 0.017), serum phosphorus (P = 0.015), leptin level (P = 0.001), ASMM (P < 0.001), and HGS (P = 0.043) while the Kt/V (P < 0.001) and URR (P < 0.001) were higher. Table 2 depicts the subgroup distribution of HD patients with or without sarcopenia. Among the 76 total participants, 24 (31.6%) patients had DM and 35 (46.1%) patients had hypertension. In comparing the sarcopenia with the non-sarcopenia
group, there were no statistically signifi -cant differences in distribution by gender, diabetes, hypertension, angiotensin
recep-tor blocker, β-blocker, calcium channel
blocker (CCB), statin, or fibrate drugs used.
Table 3 shows serum leptin levels and clin-ical characteristics among HD patients.
There were no statistical differences on
log-leptin level in comparing sex, diabetes, hypertension, and the drugs used
(angio-tensin receptor blocker, β-blocker, CCB, statin, or fibrate).
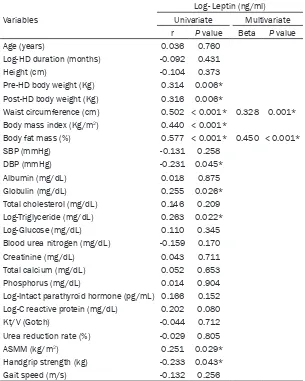
0.026), log-TG (r = 0.263; P = 0.022), and ASMM (r = 0.251; P = 0.029) while negatively correlating with diastolic blood pressure (r = -0.231; P = 0.045) and HGS (r = -0.233; P = 0.043). Multivariate correlation analysis showed log-leptin levels positively correlated with waist circumference (r = 0.328; P = 0.001) and body fat mass (r = 0.450; P < 0.001).
After adjusting the factors significantly associ -ated with sarcopenia (height, pre-HD body weight, post-HD body weight, waist
circumfer-leptin has a pivotal role on muscle metabolism.
The study of Hamrick et al. revealed that leptin
receptor expression in skeletal muscle was declined in aged mice and recombinant leptin
treatment significantly increased hind limb
muscle mass and extensor digitorum longus
[image:5.612.90.395.98.479.2]fiber size [13]. Neira S´ainz et al. observed an improvement of inflammation and muscle loss after leptin administration in obese leptin-defi -cient ob/ob mice [14]. Nguyen et al. showed that muscle regeneration was delayed in ob/ob and db/db mice partly because of the lack of Table 4. Correlation between serum leptin levels and clinical variables
among 76 hemodialysis patients
Variables
Log- Leptin (ng/ml) Univariate Multivariate
r P value Beta P value
Age (years) 0.036 0.760
Log-HD duration (months) -0.092 0.431
Height (cm) -0.104 0.373
Pre-HD body weight (Kg) 0.314 0.006*
Post-HD body weight (Kg) 0.316 0.006*
Waist circumference (cm) 0.502 < 0.001* 0.328 0.001*
Body mass index (Kg/m2) 0.440 < 0.001*
Body fat mass (%) 0.577 < 0.001* 0.450 < 0.001*
SBP (mmHg) -0.131 0.258
DBP (mmHg) -0.231 0.045*
Albumin (mg/dL) 0.018 0.875
Globulin (mg/dL) 0.255 0.026*
Total cholesterol (mg/dL) 0.146 0.209
Log-Triglyceride (mg/dL) 0.263 0.022*
Log-Glucose (mg/dL) 0.110 0.345
Blood urea nitrogen (mg/dL) -0.159 0.170
Creatinine (mg/dL) 0.043 0.711
Total calcium (mg/dL) 0.052 0.653
Phosphorus (mg/dL) 0.014 0.904
Log-Intact parathyroid hormone (pg/mL) 0.166 0.152
Log-C reactive protein (mg/dL) 0.202 0.080
Kt/V (Gotch) -0.044 0.712
Urea reduction rate (%) -0.029 0.805
ASMM (kg/m2) 0.251 0.029*
Handgrip strength (kg) -0.233 0.043*
Gait speed (m/s) -0.132 0.256
Data of HD duration, triglyceride, glucose, iPTH, C reactive prottein, and leptin levels showed skewed distribution and, therefore were log-transformed before analysis. Analysis data was done using the univariate linear regression analyses or multivariate stepwise linear regression analysis (adopted factors: pre-HD body weight, post-HD body weight, waist circumference, body mass index, body fat mass, DBP, globulin, log-triglyc-eride, handgrip strength, and ASMM). HD, hemodialysis; SBP, systolic blood pressure; DBP, diastolic blood pressure; WBC, white blood cell; Kt/V, fractional clearance index for urea; ASMM, appendicular skeletal muscle mass. *P < 0.05 was considered statistically significant.
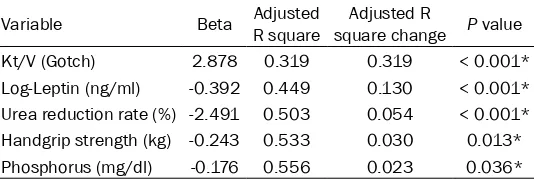
ence, BMI, body fat mass,
log-TG, creatinine,
phosph-orus, ASMM, HGS, URR, Kt/V, and log-leptin), we found that lower log-lep-
tin (β: -0.392, adjusted R2
change = 0.130, P < 0.0-
01), lower URR (β: -2.491,
adjusted R2 change =
0.054, P < 0.001)) , lower
HGS (β: -0.243, adjusted
R2 change = 0.030, P =
0.013), lower serum
phos-phorus level (β: -0.176,
adjusted R2 change =
0.023, P = 0.036) and hi-
gher Kt/V (β: 2.878,
ad-justed R2 change = 0.319, P < 0.001) were the inde-pendent predictors of sar-copenia in chronic HD patients (Table 5).
Discussion
In the current cross-secti- onal study, we investigat-ed the relationship betw- een leptin and sarcopenia in 76 chronic HD patients. Our study shows that se-
rum leptin is significantly
lower in the sarcopenia group. Moreover, the low- er log-leptin level is an in- dependent predictor for the presence of sarcope-nia in our chronic HD patients, after adjusting possible confounding fa- ctors.
leptin signaling [25]. In the mouse model lack-ing all functional leptin receptor isoforms,
skel-etal muscle mass and fiber diameter were
reduced 30-40% in relation to wild-type
con-trols [15]. Taken together, leptin is an important
factor in the regulation of skeletal muscle, likely through regulation of insulin sensitivity, oxida-tive stress, intramuscular fatty acid oxidation, and irisin-induced myogenesis [16, 26, 27]. Despite strong evidence from animal studies, several observational studies of leptin effects on skeletal muscle mass and function in human
subjects have been conflicting. The study of
Waters et al. showed that ASMM was negatively correlated with leptin and sarcopenic partici-pants had elevated leptin concentration in elderly participants [28]. Similarly, in middle-aged to elderly participants with sarcopenic obesity, which is characterized by low skeletal muscle mass and high body fat component, Kohara et al. found that plasma leptin levels were negatively related to thigh muscle cross-sectional area [29]. In patients with CKD stage 3-4, Castaneda-Sceppa et al. showed that high
serum leptin levels were significantly associat -ed with low arm muscle area [30]. However, some studies have shown a paradoxically inverse association between serum leptin and sarcopenia. Gómez et al. observed a positive correlation between leptin and fat-free mass in the general population [31]. Hubbard et al. also noted low leptin levels in frail elderly subjects with reduced mid-arm muscle area [32]. Another study conducted from 1,573
individu-als without diabetes mellitus, aged ≥ 60 years,
showed that higher leptin concentration was
leptin resistance in these patients. Thus, we propose that deficiency of serum leptin, as
well as leptin resistance, is associated with sarcopenia.
Recently, emerging studies have shown that serum leptin concentration seems to be a marker of good nutritional status, rather than an appetite-suppressing uremic toxin in patients with ESRD, and that decreased leptin levels are associated with protein-energy wast-ing [34-37]. Our study shows serum leptin is
significantly lower in the sarcopenia group, indi -cating the poor nutrition status in this group.
Moreover, serum albumin and TCH, two tradi -tional nutri-tional markers in ESRD patients, were not associated with the presence of sar-copenia in our study and previous studies have shown similar results [3]. Kim et al. reported that only subjective global assessment (SGA)
was significantly associated with sarcopenia
among nutritional markers but not albumin. Despite its prognostic value, serum albumin is an insensitive indicator of malnutrition in ESRD patients [38].
In our study, the prevalence of muscle dysfunc-tion, measured by HGS and gait speed, was much higher than the prevalence of low muscle
mass. Therefore, the diagnosis of sarcopenia in
our study was mainly driven by low muscle
[image:6.612.92.359.110.200.2]mass. This finding is similar with the previous study conducted by Bataille et al. which showed that low muscle strength was presented in the large majority of 111 HD patients while a low muscle mass index was present in 33.3% of the population [39]. Prevalence of sarcopenia was Table 5. Multivariate stepwise linear regression analysis of the
factors correlated to sarcopenia among the 76 hemodialysis patients
Variable Beta Adjusted R square square changeAdjusted R P value
Kt/V (Gotch) 2.878 0.319 0.319 < 0.001*
Log-Leptin (ng/ml) -0.392 0.449 0.130 < 0.001*
Urea reduction rate (%) -2.491 0.503 0.054 < 0.001*
Handgrip strength (kg) -0.243 0.533 0.030 0.013*
Phosphorus (mg/dl) -0.176 0.556 0.023 0.036*
*P < 0.05 is considered statistically significant in the multivariate stepwise lin -ear regression analysis (adopted factors: height, pre-HD body weight, post-HD body weight, waist circumference, body mass index, body fat mass, log-triglyc-eride, creatinine, phosphorus, appendicular skeletal muscle mass, handgrip strength, urea reduction rate, Kt/V, and log-leptin). HD, hemodialysis; Kt/V, fractional clearance index for urea.
associated with greater risk of frailty in older adults [33]. Our study showed a similar result in
patients with chronic HD. Two
possible factors may contribute to the discrepancy in these stud-ies. First, leptin may exert differ-ent effects in diverse populations such as HD patients, healthy, el- derly, and obese subjects. Se- cond, few clinical studies have concerned leptin receptor func-tion or the number which may be important determinants to the
31.5% in that study and the diagnosis of sarco-penia was mainly driven by muscle mass measurement.
Our study had some additional findings. Pre-HD
serum creatinine, a surrogate marker of muscle mass in chronic HD patient [40], was lower in the sarcopenia group compared to non-sarco-penia group. Our study showed that patients in
sarcopenia group had significantly lower serum
phosphorus and serum phosphorus was a neg-ative predictor for sarcopenia. Serum phospho-rus level is positively correlated with protein intake in HD patients, therefore lower serum phosphorus level in the sarcopenia group indi-cated low protein intake. Moreover, Kt/V was higher in the sarcopenia group and was a posi-tive predictor for sarcopenia, which was possi-bly due to the small body size in the sarcopenia group.
The negative impact of diabetes on muscle
mass and strength had been demonstrated in many of the previous studies, both in older pop-ulation and ESRD poppop-ulation [3, 41]. In addition to insulin resistance, an increase in circulating
inflammatory cytokines and elevation of plas -ma fatty acid concentration, is commonly observed in patients with diabetes, leading to impairment of muscle protein anabolism and accelerated loss of muscle mass and strength [42, 43]. However, our study did not show a
sig-nificant association between diabetes and sar -copenia in chronic HD patients, which may have been concealed due to the small number of study subjects.
Ours is the first study to explore the possible
association between serum leptin level and uremic sarcopenia in chronic HD patients, using the AWGS criteria. However, the study has several limitations. First, the sample size is small and only a small proportion of patients
were classified as sarcopenia. Second, the
cross-sectional nature of the study did not prove a causative relationship between serum
leptin level and uremic sarcopenia. Third, mis
-classification bias may be likely in our study by
using AWGS criteria, which was developed or- iginally for Asian geriatric population. Unfor- tunately, in ESRD population, the consensus on the diagnosis of uremic sarcopenia is lacking and the best cut-offs to predict clinical
out-comes are yet to be defined. Fourth, SGA or malnutrition inflammation score, two reliable
scores for nutritional evaluation in chronic HD patients, were not assessed.
In conclusion, our study shows that low serum leptin is an independent predictor of
sarcope-nia in chronic HD patients. The findings suggest
that leptin may play an important role in the development of sarcopenia in chronic HD patients. Further larger scale prospective
stud-ies are needed to confirm the association and
to establish the causative relationship between leptin and uremic sarcopenia.
Acknowledgements
This study was supported by a grant from the Buddhist Tzu Chi General Hospital, Hualien, Taiwan (TCRD105-04).
Disclosure of conflict of interest
None.
Address correspondence to: Dr. Bang-Gee Hsu,
Division of Nephrology, Buddhist Tzu Chi General
Hospital, No. 707, Section 3, Chung-Yang Road,
Hualien, Taiwan. Tel: 3-8561825; Fax:
+886-3-8577161; E-mail: gee.lily@msa.hinet.net
References
[1] Rosenberg IH. Sarcopenia: origins and clinical relevance. J Nutr 1997; 127 Suppl: 990S-1S. [2] Landi F, Cruz-Jentoft AJ, Liperoti R, Russo A,
Giovannini S, Tosato M, Capoluongo E, Berna -bei R, Onder G. Sarcopenia and mortality risk in frail older persons aged 80 years and older:
results from ilSIRENTE study. Age Ageing
2013; 42: 203-9.
[3] Kim JK, Choi SR, Choi MJ, Kim SG, Lee YK, Noh JW, Kim HJ, Song YR. Prevalence of and factors associated with sarcopenia in elderly patients with end-stage renal disease. Clin Nutr 2014; 33: 64-8.
[4] Lamarca F, Carrero JJ, Rodrigues JC, Bigogno FG, Fetter RL, Avesani CM. Prevalence of sar-copenia in elderly maintenance hemodialysis patients: the impact of different diagnostic cri-teria. J Nutr Health Aging 2014; 18: 710-7. [5] Pereira RA, Cordeiro AC, Avesani CM, Carrero
JJ, Lindholm B, Amparo FC, Amodeo C, Cuppari L, Kamimura MA. Sarcopenia in chronic kidney disease on conservative therapy: prevalence and association with mortality. Nephrol Dial
Transplant 2015; 30: 1718-25.
[6] Fahal IH. Uraemic sarcopenia: aetiology and
implications. Nephrol Dial Transplant 2014;
[7] Kwon H, Pessin JE. Adipokines mediate inflam -mation and insulin resistance. Front Endocri-nol 2013; 4: 71.
[8] Song MY, Ruts E, Kim J, Janumala I,
Heyms-field S, Gallagher D. Sarcopenia and increased adipose tissue infiltration of muscle in elderly
African American women. Am J Clin Nutr 2004; 79: 874-80.
[9] Wolsk E, Mygind H, Grøndahl TS, Pedersen BK,
van Hall G. Human skeletal muscle releases leptin in vivo. Cytokine 2012; 60: 667-73. [10] Sendlhofer G, Brunner G, Schaupp L, Wutte A,
Ellmerer M, Pieber TR. Estimation of human
leptin concentration in the subcutaneous adi-pose and skeletal muscle tissues. Eur J Clin Invest 2015; 45: 445-51.
[11] Zhang F, Chen Y, Heiman M, Dimarchi R. Leptin: structure, function and biology. Vitam Horm 2005; 71: 345-72.
[12] Guerra B, Santana A, Fuentes T, Delgado-Guer -ra S, Cabre-ra-Socorro A, Do-rado C, Calbet JA. Leptin receptors in human skeletal muscle. J Appl Physiol 2007; 102: 1786-92.
[13] Hamrick MW, Herberg S, Arounleut P, He HZ,
Shiver A, Qi RQ, Zhou L, Isales CM, Mi QS. The
adipokine leptin increases skeletal muscle
mass and significantly alters skeletal muscle miRNA expression profile in aged mice. Bio -chem Biophys Res Commun 2010; 400: 379-83.
[14] Sáinz N, Rodríguez A, Catalán V, Becerril S, Ramírez B, Gómez-Ambrosi J, Frühbeck G. Leptin administration downregulates the in-creased expression levels of genes related to
oxidative stress and inflammation in the skel
-etal muscle of ob/ob mice. Mediators Inflamm
2010; 2010: 784343.
[15] Arounleut P, Bowser M, Upadhyay S, Shi XM, Fulzele S, Johnson MH, Stranahan AM, Hill WD, Isales CM, Hamrick MW. Absence of func-tional leptin receptor isoforms in the POUND (Lepr(db/lb)) mouse is associated with muscle atrophy and altered myoblast proliferation and differentiation. PLoS One 2013; 8: e72330. [16] Rodríguez A, Becerril S, Méndez-Giménez L,
Ramírez B, Sáinz N, Catalán V, Gómez-Ambrosi J, Frühbeck G. Leptin administration activates irisin-induced myogenesis via nitric oxide-de-pendent mechanisms, but reduces its effect on subcutaneous fat browning in mice. Int J Obes 2015; 39: 397-407.
[17] Nakazono H, Nagake Y, Ichikawa H, Makino H. Serum leptin concentrations in patients on he-modialysis. Nephron 1998; 80: 35-40. [18] Chen LK, Liu LK, Woo J, Assantachai P,
Auy-eung TW, Bahyah KS, Chou MY, Chen LY, Hsu
PS, Krairit O, Lee JS, Lee WJ, Lee Y, Liang CK, Limpawattana P, Lin CS, Peng L, Satake S,
Su-zuki T, Won CW, Wu CH, Wu SN, Zhang T, Zeng
P, Akishita M, Arai H. Sarcopenia in Asia: con-sensus report of the Asian Working Group for Sarcopenia. J Am Med Dir Assoc 2014; 15: 95-101.
[19] Cruz-Jentoft AJ, Baeyens JP, Bauer JM, Boirie Y,
Cederholm T, Landi F, Martin FC, Michel JP, Rolland Y, Schneider SM, Topinková E, Vande -woude M, Zamboni M; European Working Group on Sarcopenia in Older People.
Sarcope-nia: European consensus on definition and di -agnosis: Report of the European Working Group on Sarcopenia in older people. Age Age-ing 2010; 39: 412-23.
[20] Ohara M, Kohara K, Tabara Y, Igase M, Miki T.
Portable indices for sarcopenia are associated
with pressure wave reflection and central
pulse pressure: the J-SHIPP study. J Hypertens 2015; 33: 314-22.
[21] El-Kateb S, Davenport A. Changes in intracel-lular water following hemodialysis treatment lead to changes in estimates of lean tissue us-ing bioimpedance spectroscopy. Nutr Clin Pract 2016; 31: 375-7.
[22] Tsai JP, Lee MC, Chen YC, Ho GJ, Shih MH, Hsu
BG. Hyperleptinemia is a risk factor for the de-velopment of central arterial stiffness in
kid-ney transplant patients. Transplant Proc 2015;
47: 1825-30.
[23] Chen MC, Hsu BG, Lee CJ, Wang JH. Hyperlepti-naemia positively correlates with cardiometa-bolic syndrome in hypertensive patients. Int J Clin Exp Pathol 2016; 9: 12959-67.
[24] Tsai JP, Wang JH, Chen ML, Yang CF, Chen YC,
Hsu BG. Association of serum leptin levels with central arterial stiffness in coronary artery dis-ease patients. BMC Cardiovasc Disord 2016; 16: 80.
[25] Nguyen MH, Cheng M, Koh TJ. Impaired mus -cle regeneration in ob/ob and db/db mice.
Sci-entificWorldJournal 2011; 11: 1525-35.
[26] Minokoshi Y, Toda C, Okamoto S. Regulatory
role of leptin in glucose and lipid metabolism in skeletal muscle. Indian J Endocrinol Metab 2012; 16 Suppl 3: S562-8.
[27] Doh KO, Park JO, Kim YW, Park SY, Jeong JH, Jeon JR, Lee SK, Kim JY. Effect of leptin on in-sulin resistance of muscle-direct or indirect? Physiol Res 2006; 55: 413-9.
[28] Waters DL, Qualls CR, Dorin RI, Veldhuis JD, Baumgartner RN. Altered growth hormone, cortisol, and leptin secretion in healthy elderly persons with sarcopenia and mixed body com-position phenotypes. J Gerontol A Biol Sci Med Sci 2008; 63: 536-541.
[29] Kohara K, Ochi M, Tabara Y, Nagai T, Igase M, Miki T. Leptin in sarcopenic visceral obesity:
[30] Castaneda-Sceppa C, Sarnak MJ, Wang X,
Greene T, Madero M, Kusek JW, Beck G, Kop -ple JD, Levey AS, Menon V. Role of adipose tis-sue in determining muscle mass in patients with chronic kidney disease. J Ren Nutr 2007; 17: 314-22.
[31] Gómez JM, Maravall FJ, Gómez N, Navarro MA, Casamitjana R, Soler J. Interactions between serum leptin, the insulin-like growth factor-I system, and sex, age, anthropometric, and body composition variables in a healthy popu-lation randomly selected. Clin Endocrinol 2003; 58: 213-9.
[32] Hubbard RE, O’Mahony MS, Calver BL,
Wood-house KW. Nutrition, inflammation, and leptin
levels in aging and frailty. J Am Geriatr Soc 2008; 56: 279-84.
[33] Lana A, Valdés-Bécares A, Buño A, Rodríguez-Artalejo F, Lopez-Garcia E. Serum leptin con-centration is associated with incident frailty in older adults. Aging Dis 2017; 8: 240-9. [34] Dervisoglu E, Eraldemir C, Kalender B, Kir HM,
Caglayan C. Adipocytokines leptin and
adipo-nectin, and measures of malnutrition-inflam -mation in chronic renal failure: is there a rela-tionship? J Ren Nutr 2008; 18: 332-7. [35] Kara E, Ahbap E, Sahutoglu T, Sakaci T, Bas
-turk T, Koc Y, Sevinc M, Akgol C, Ucar ZA, Kaya -lar AO, Bayraktar F, Unsal A. Elevated serum leptin levels are associated with good nutri-tional status in non-obese chronic hemodialy-sis patients. Clin Nephrol 2015; 83: 147-53. [36] Markaki A, Grammatikopoulou MG, Venihaki
M, Kyriazis J, Perakis K, Stylianou K. Associa-tions of adiponectin and leptin levels with pro-tein-energy wasting, in end stage renal disease patients. Endocrinol Nutr 2016; 63: 449-57.
[37] Chiu TT, Liao SC, Lee WC, Lee PS, Ng HY, Chien YS, Lee CT. Gelsolin and adipokines are associ -ated with protein-energy wasting in hemodialy-sis patients. Artif Organs 2015; 39: 150-5. [38] Friedman AN, Fadem SZ. Reassessment of
al-bumin as a nutritional marker in kidney dis-ease. J Am Soc Nephrol 2010; 21: 223-30. [39] Bataille S, Serveaux M, Carreno E, Pedinielli N,
Darmon P, Robert A. The diagnosis of sarcope -nia is mainly driven by muscle mass in hemodi-alysis patients. Clin Nutr 2017; 36: 1654-1660.
[40] Patel SS, Molnar MZ, Tayek JA, Ix JH, Noori N, Benner D, Heymsfield S, Kopple JD, Kovesdy
CP, Kalantar-Zadeh K. Serum creatinine as a marker of muscle mass in chronic kidney dis-ease: results of a cross-sectional study and review of literature. J Cachexia Sarcopenia Muscle 2013; 4: 19-29.
[41] Kim TN, Park MS, Yang SJ, Yoo HJ, Kang HJ,
Song W, Seo JA, Kim SG, Kim NH, Baik SH, Choi DS, Choi KM. Prevalence and determi-nant factors of sarcopenia in patients with type
2 diabetes. The Korean Sarcopenic Obesity
Study (KSOS). Diabetes Care 2010; 33: 1497-9.
[42] Bassil MS, Gougeon R. Muscle protein anabo-lism in type 2 diabetes. Curr Opin Clin Nutr Metab Care 2013; 16: 83-8.