COMMISSION
OF THE EUROPEAN COMMUNITIES
DOCUMENT
COMMISSION
OF THE EUROPEAN COMMUNITIES
DOCUMENT
Cataloguing data can be found at the end of this publication
Luxembourg: Office for Official Publications of the European Communities, 1983 ISBN 92-825-3898-2
Catalogue number: CB-37-83-902-EN-C
-CONTENTS-Page
INTRODUCTION
CHAPTER 1 : SOCIAL AND ECONOMIC ANALYStS 3
Introduction 3 Recent trends in the Irish Economy 3
Review of Main Socio-Economie Indicators 12
Population 12 Urbanisation 19 Age Structure and Dependency Ratios 20
Employment 2h
Projected Increase in the Labour Force 36
Job Requirements 38 Personal Incomes 38
Domestic Regional Policy kk
Cross Border Cooperation k7
Infrastructure 5^ Agriculture 56
Recent Trends 36
'Farmers' Borrowing Position 58 Common Agricultural Policy 59
Industry 59 Recent Trends . 59
Performance of the Industrial Promotion
Agencies 63 Effects on Irish Industry of the
Community's External Trade and
Page
Services 8o Tourism 80 Social Policy 8l
Housing 8l
Health 82
Education 8k
Social Welfare 87
Manpower 88 Public Social Expenditure 89
Incomes Policy 90
Taxation and Fiscal Capacity 90 Supportive Role of the European Community 92
CHAPTER 2 : DEVELOPMENT OBJECTIVES 98 National Development Objectives 98
General aims 98 Labour Force 101 Sectoral Development Objectives IO3
•Agriculture IO3
Manufacturing Industry 104 Building and Construction IO5
Services IO6 Social Policy I07
CHAPTER 3 : MEASURES FOR DEVELOPMENT IO9
General Measures 109
Incomes 109 Industrial Relations 111
Efficiency and Productivity 112
Sectoral Measures 114
Agriculture ll4 Food Industries 116
Forestry 117 Fisheries and Aquaculture 119
Secondary Sector 121
Manufacturing Industry 121 Building and Construction 131
Tertiary Sector 132 Public Sector Services 132
Private Sector Services 134
Tourism 137
Youth Employment 139 Productive Infrastructure l4l
Energy l4l
Telecommunications 143
Roads 144 Transport 146 Water and Sewerage Services 150
Social Infrastructure 152
Health 152
Education and Training 157
Housing I62
Socio-Cultural Amenities 164
Environment and Physical
CHAPTER 4 : FINANCIAL RESOURCES I67
Investment I67 The Public Capital Programme I67
Directly Productive Investment 170
Productive Infrastructure 170
Energy 174 Telecommunications 174
Roads 174 Transport 175 Water and Sewerage Services I76
Social and Other Investments I76
Role of Community Instruments I78 CHAPTER 5 : IMPLEMENTING THE PROGRAMME I8O
Introduction I80 Responsible Bodies I8I
INTRODUCTION
1. In December 1977, the Irish Government, in compliance with Article 6 of the ERDF Regulation, submitted their "Regional
Development Programme, 1977-1980 to the Commission of the
European Communities. Subsequent programmes, updating the 1977/80 3
Programme and adapted to the format of the Common Outline for Regional Development Programmes as adopted by the Regional Policy Committee were submitted to the Commission in 1979 and 1980 in
4 accordance with Article 6 of the amending ERDF Regulation . A further annual updating was submitted in June 1981.
2. A National Economic and Social Plan, covering the period to 1985, to which this Regional Development Programme is closely related, is at present being drafted. The Irish Government intend to discuss issues arising in the preparation of the Plan with the social partners in due course. The uncertainty which is a feature of all development programmes is increased in the case of the Irish
programme because of possible changes that may result from such discussions and the outcome of present negotiations on income increases.
3. The Programme is a national one as Ireland is one region of the Community and all twenty-six counties are eligible for assistance from the European Regional Development Fund. In common with all other regions of the Community, intra-regional disparities exist and continuing attention is being paid by the Irish Government to the reduction of these disparities with some modicum of success as the Programme show3.
2 3 4
Regulation (EEC)No.724/75 establishing a European Regional Development Fund.
4. Of particular concern to the Government, however, in the preparation of the Programme, is the fact that disparities in
living standards and levels of economic activity between Ireland and most other Community regions are increasing, as evidenced in the Commission's First Periodic Report on "The Regions of the Community" and as the Commission has pointed out, their
persistence "even threatens the proper functioning of the common market itself . That these disparities should continue to grow during a period of extremely high investment by Ireland is
extremely disconcerting particularly when the region has not of itself the resources to maintain these high rates of investment in future years. This is a matter of concern not only for the Irish Government but for the whole Community, one of the basic aims of which is the reduction of "the differences existing between the various regions and the backwardness of the less
favoured regions" .
note : Since this programme was submitted in December I98I the Government has
changed. The present Government are now drafting a medium term economic
plan as a framework for the main economic decisions in the years ahead.
Department of Finance December 1981
1 COM(80) 816 Final
Commission Communication of 3 June 1977 to the Council on Guidelines for Community Regional Policy - Bulletin of the European Communities Supplement 2/77.
3
CHAPTER 1: SOCIAL AND ECONOMIC ANALYSIS
Introduction
1.1 A comprehensive analysis of the social and economic situation in Ireland was contained in the annexes to the 1977/80 Programme ani
further information is available in the Periodic Report on "The Regions of the Community" submitted to the Council by the Commission in December
1980^. It is not intended to reproduce here what was contained in these earlier documents but rather to concentrate on more recent
developments and thereby present as clear a picture as possible of the present economic and social situation in Ireland.
Recent Trends in the Irish Economy
1.2 The international recession and the oil price increases had a severe adverse impact on the Irish .economy in 1980, with GDP growth slowing down to about 2 per cent. Merchandise exports remained
buoyant, growing by 8 per cent in volume but the volume of merchandise ι
imports fell by about 4^/4 per cent. However, because of the
significant deterioration in the terms of trade, the favourable volume movements in exports and imports did not produce any improvement in
the balance of payments deficit which remained high, at about IR£725 million (1,050 mECU)2. The cost of oil imports rose by IR£200 million
(290 mECU) to IR£720 million (1,043 mECU). The impact of the recession and, in particular, the large increase in the labour force, led to a rise in unemployment during the year. A review, in more detail, of the main trends in 1980 and, insofar as data are available, in 1981 is
set out below in the light of the available
data:-1 op. cit. page 2.
Expenditure
Consumer demand: Consumer spending declined in volume by
about ■L'2 per cent in 1980. Following a volume increase in the first quarter of the year, reflecting largely
pre-Budget purchasing, the retail sales index showed decreases
in the second and third quarters. In the final quarter
retail sales recovered, largely because of the first
payment under the Second National Understanding for Economic
and Social Development·1, towards the end of the year. In the
first half of 1981, retail sales have shown little change
compared with' the final quarter of 1980 and they were about
*-'2 per cent lower than in the first half of that year.
Current spending by Public Authorities; Expenditure by
public authorities on current goods and services showed a
volume increase of 4 per cent in 1980 compared with the
preceding year. However, in value terms, expenditure
increased significantly, largely because of the cost of pay
increases in the public sector.
Investment: Gross domestic fixed capital formation
declined by 7^' 4 per cent in volume in 1980, to just under 30
per cent of GNP, following on two years of exceptional growth.
Investment in machinery and equipment fell by 10 per cent in
volume, while in building and construction the decline was about
6 per cent.
The National Understandings were the results of
This decline was to be expected of course since as pointed out in the Introduction to this Programme, the region lacks the resources to maintain the high investment rate of
previous years. The figures for cement sales, and imports of producer capital goods for the first eight months of 1981
suggest a continuing sluggish investment performance in this period with little volume change in both indicators. However, on an intra-year basis, imports of investment goods have
grown.
External Trade and Payments
Exports : Exports of goods and services rose by nearly 61/2
per cent in volume in 1980. The export performance of the various sectors differed markedly. Agricultural exports, on a trade statistics basis, increased in volume by about 8 per cent, mainly because of a significant rundown of cattle
numbers on farms. Industrial exports rose by about 7 per cent in volume, a satisfactory performance given the effects of the international recession on world trade. In the first nine months of 1981, merchandise exports rose by 15 per cent in value, representing a volume increase of about 2^/2 per
cent. In this period, the performance of the different export categories was markedly different with a 7 per cent volume increase in industrial exports while agricultural exports are estimated to have fallen by about 12 per cent in volume.
Tourism: 1980 was another difficult year for tourism. It is estimated that the total number of out-of-State tourists
foreign earnings from tourism showed an increase of
7I/2 per cent in 1980 but, after allowing for inflation, there was a decline in real terms of 9 per cent. The
publicity given to developments in Northern Ireland early in 1981 has had an adverse effect on tourism this year and no growth in tourist numbers is expected.
Imports: In 1980, merchandise imports rose by nearly 121/2 per
cent in value which implied a fall in volume of about 4^/4 per cent. There was a volume decline in imports of producer capital goods and in materials for further production.
Consumer goods are estimated to have increased somewhat in volume. The fall in imports of producers' capital goods reflected the decrease in investment, while the fall in the volume of imports of materials for further production is consistent with the slowdown-in industrial production and with destocking. The increase in the cost of oil imports in 1980 was IR£200 million (290 mECU). This mainly reflects price increases. In the first nine months of 1981 imports were 21^/4 per cent higher than in the same period last
year, representing a small increase in volume terms. Producer capital goods imports showed little change in volume terms in this period while materials for further production showed a small decline. On a deseasonalised basis, however, both
Balance of Payments i The trade deficit fell from IR£1,317 million (1,909 mECU) in 1979 to an estimated IR£1,291 million
(1,871 mECU) in 1930. Community transfers at IR£365 million (529 mECU) showed little change compared with 1979, while earnings from tourism at IR£360 million (522 mECU) rose by 1^-12 per cent. Although figures for other items are not yet available, the balance of payments deficit on current account in 1980 is estimated at about IR£725 million (1,051 mECU), compared with IR£727 million (1,054 mECU) in 1979. This
represents 31'2 per cent of GNP, compared with 10 per cent
in 1979. The external reserves rose by IR£371 million (538 mECU) during the year to IR£1,346 million (1,951 mECU), the equivalent of 3 months' imports, implying a net capital inflow of about IR£1,100 million (1,594 mECU) which mainly reflected
increased public and private sector foreign borrowing during the year. In the first nine months of 1981, the trade deficit widened considerably to IR£1,435 million (2,080 mECU) or 42 per cent higher than in the same period last year. With
imports showing little change in volume terms and exports showing only modest volume growth, the major factor in the significant increase in the trade deficit was a continuing deterioration in the terms of trade.
Terms of Trade: It is estimated that the terms of trade deteriorated in 1980 by 7 per cent, the oil price rise being the main contributory factor. Import prices are
estimated to have increased by about 18 per cent, compared with an increase of 9 per cent in export prices. In the
Output
Industry: Manufacturing industry output fell by 2 per cent in 1980. On a seasonally adjusted basis, output rose by
23-'4 per cent in the first quarter of the year but there
were declines in the last three quarters. In the final
quarter, manufacturing output was 9 per cent lower than the peak level of output in the first quarter of the year.
Output in the mining, quarrying and turf sector rose by 2 per cent compared with the 1979 level. Reflecting the fall in cement sales during the year, the output of the building industry is estimated to have decreased by about 6 per
cent. In the first half of 1981, output in manufacturing industry grew strongly and in the second quarter of the year had recovered the ground lost in the second half of 1980. However, building output has not yet shown any significant improvement with cement sales in the first nine months of this year showing a volume increase of only 1*'4 per cent compared with the same period last year.
Agriculture: For the second consecutive year, output in the agricultural sector was adversely affected by
unfavourable weather conditions in 1980. High interest rates and a significant deterioration in the relationship between input and output price changes were other important
factors. Gross output showed no change compared with 1979 but, because of a significant decline in farm inputs, net
agricultural output rose by 7 '2 per cent. The higher
caused a run-down in cattle numbers on farms. The December 1980 livestock enumeration showed declines of 5.6 per cent in total cattle and 4.5 per cent in cow numbers. Milk production
decreased by about 1^/4, per cent. In the first half of 1981, cattle disposals fell sharply and milk deliveries to creameries declined slightly, mainly due to the rundown in cattle numbers
(including cows) on farms last year.
Incomes
The total wage bill in the non-agricultural sector rose by over 2 2 per cent in 1980. The main contributory factors to
this increase were the payment of the second phase of the
First National Understanding! fo r Economic and Social
Development (which amounted to just over 7 per cent of basic pay) and carryover from 1979 of the first phase of that
Understanding (which had amounted to 9 per cent of basic pay) with a considerable contribution arising from drift and special
increasec. The first phase of the Second National Understanding (amounting to just over 8 per cent of basic pay) which followed a pay pause of one month, also contributed. Average weekly
earnings in transportable goods industries rose by 181/4 per
cent in 1980,· compared with an increase of 15*/4 per cent in 1979. Farm incomes declined by about 8^/2 per cent while non-agricultural profits, professional earnings, rent and other incomes increased by 2 per cent.
Prices
The average rate of increase in consumer prices in 1980 was 18^/4 per cent, compared with an average rate of 13^/4
increase in the average for 1980 were the indirect tax measures which were introduced in the 1980 Budget, the effect of energy-related price rises and the rise in food prices. The Budget indirect tax increases and the rise in
food prices each added about 3 percentage points while
energy-related price rises accounted for about 4 percentage points. The continuing rise in domestic costs as a result of wage and salary increases also contributed to inflation.
In the first three quarters of 1981, the rate of consumer price increase accelerated, largely because of higher
import prices. However, indirect tax increases in the
January and July budgets also contributed significantly to the faster rise in prices. The mid-February, mid-May and mid-August quarterly increases were 6.2, 3.9 and 5.6 per
cent respectively, giving respective year-on-year increases of 21.0, 17.1 and 20.1 per cent.
Labour Market
Employment: The Central Statistics Office (CSO) has published a revised series of employment estimates
based on the 1979 Census of Population and the outturn of the 1979 Labour Force Survey. These figures show that in the year to mid-April 1980, total employment increased by an estimated 18,000, compared with an average annual increase of 31,000 in the preceding two-year period to mid-April 1979. In the year to mid-April 1980, employment in
which 6,000 was in the public sector. However, during 1980 employment in manufacturing industry declined and by the end of the year had fallen by 9,400 (or 4.2 per cent)
compared with the end of 1979. The decline in manufacturing employment continued into the first half of 1981 when
employment declined by a further 3,500 or 1^/4 per cent on a seasonally adjusted basis, although the rate of decline
moderated in the second quarter of the year.
Unemployment: The movement of the Live Register through 1980 indicated a reversal of the downward trend in
unemployment of the previous years. The average monthly Live Register total for 1980 was 13 per cent higher than the average for 1979. The rate of increase in the
seasonally adjusted series was highest from May to
October, with an average increase of about 4,000 a month, but in November and December this fell off to an average of 2,150. The unadjusted Live Register total at the end of December was 122,200 which represents an increase of about 38 per cent on the end-1979 figure. This is discussed in paragraph 1.22 below. The registered unemployment total continued to rise in 1981. In the first ten months of the year, the average monthly increase (seasonally
adjusted) in the registered total was 1,400. The October monthly increase of 800 was considerably lower than the
increase of 3,000 in the previous month. The unadjusted total of 129,200 at the end of October represented about
higher that the total at the end of October 1980. Notified redundancies in 1931 have shown a similar trend - in the first nine months of the year, the total of notified redundancies was
13,024 or 2 2 per cent higher than the total for the first nine months of 1980. The deterioration in labour market conditions
is also evident in the number of vacancies notified to the National Manpower Service. During the first nine months of 1981, just under 28,500 vacancies were notified, a decline of 13 per cent compared with the number for the corresponding period in 1980.
Review of Main Socio-Economie Indicators
1.3 The country remains very much less developed by comparison with the Community as a whole and the disparities that exist are growing. A review of recent trends in the main socio-economic indicators will provide information on the present level of development.
Population
1.4 Population decline was an almost continuous feature of Irish demography from the middle of the last century until the early
1960s. Since 1961 however, there has been a continuous and
Graph 1.]
National Population 1961-8)
2,850,000
¿, M O , 000
Map 1.1
PLANNING REGIONS
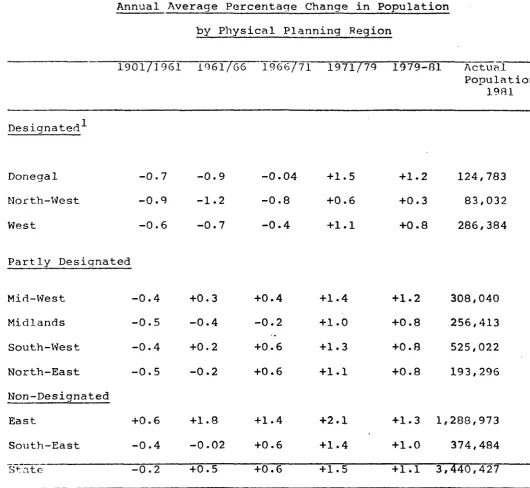
1.5 Preliminary results of the Census of Population carried out in April 1981 indicate a continuing growth in population high by European standards but lower than that averaged over the period 1971 (when the last full Census for which results are available was taken) to 1979 (when a limited Census was carried out). This
feature was common to all the physical planning regions. The preliminary total for the population as of April 1981 is 3.44 million compared with 3.368 million in 1979, representing an annual average rate of growth of almost 1.1 per cent. This compares with an annual average rate of about 1.5 per cent for the period 1971-79. For the decade as a whole the overall rate of increase at 1.45 per cent was substantially higher than that
recorded in the previous decade 1961-71 when it was 0.55 per cent. The results of the 1981 Census are summarised in Table 1.1 which provides comparable data for previous inter-Censal
periods.
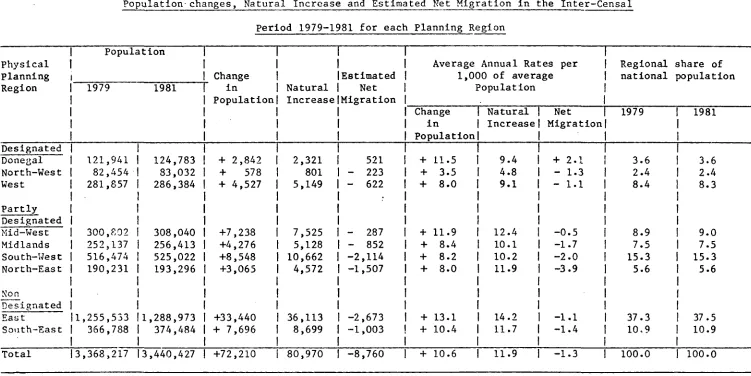
1.6 Despite the somewhat lower population growth rate, the natural increase in population at 11.9 per thousand average population was higher than that recorded in 1971-79 as shown in Table 1.2. Indeed, the natural increase at 81,000 was slightly
above the actual population increase of 72,000. The difference of 9,000 (4,500 per year) is taken as an estimate of the extent to which net emigration occured. For the preceding inter-Censal period 1971-79, it was estimated that there was net inward
migration of 109,000 or 13,600 per year, marking a reversal in a long-standing pattern of net emigration. This was due in part to the relative demand for workers in Ireland compared with
traditional centres of emigration, especially the United Kingdom. It was considered that to the extent that the outlook for
Table 1.1
Annual Average Percentage Change in Population by Physical Planning Region
1901/1961 1961/66 1966771 1971/79 Γ979-81 Actual Populatior 1931 Designated Donegal North-West West -0.7 -0.9 -0.6 -0.9 -1.2 -0.7 -0.04 -0.8 -0.4 +1.5 +0.6 +1.1 +1.2 +0.3 +0.8 124,783 83,032 286,384 Partly Designated Mid-West Midlands South-West North-East Non-Designated East South-East State -0.4 -0.5 -0.4 -0.5 +0.6 -0.4 -0.2 +0.3 -0.4 +0.2 -0.2 +1.8 -0.02 +0.5 +0.4 -0.2 +0.6 +0.6 +1.4 +0.6 +0.6 +1.4 + 1.0 +1.3 +1.1 +2.1 +1.4 + 1.5 +1.2 +0.8 +0.8 +0.8 +1.3 + 1.0 + 1.1 308,040 256,413 525,022 193,296 1,288,973 374,484 3,440,427
1- Designated areas, largely in the western part of the country, are areas where economic conditions are generally more severe than in the non-designated areas. Industrial incentives are differentiated in
Table 1.2
Annual Rate of Change in Population, Natural
Increase and Net Migration per 1,000 o F average Population
Inter-Censal Change in Natural Net Migration Period Population Increase
Per thousand average population per annum
1961-66 +4.6 10.3 -5.7 1966-71 +6.4 10.1 -3.7 1971-79 +15.4 11.1 +4.3 1979-81 +10.6 11.9 -1.3
the United States remained unpromising, it would be unlikely that net emigration would resume though at the same time the size of the potential labour force in the country would probably discourage net immigration. The results of the 1981 Census show, however, that the long-standing pattern of net emigration seems to have halted only briefly and has now resumed, though' the level of net emigration is very low in the historical context and the rate of population
increase remains high·
1.7 As mentioned above, population trends at national level have been reflected at sub-national level as shown in Table 1.3.
Prior to the 1970s population growth' had been confined to the main urban areas and some rural districts along the east coast.
Between 1971 and 1979, 132 of the 160 rural districts recorded increases in population and population decline, once the
CD
Table 1.3
Population-changes, Natural Increase and Estimated Net Migration in the Inter-Censal Period 1979-1981 for each Planning Region
Physical Planning Region Designated Donegal North-West West Partly Designated Mid-West Midlands South-West North-East NOP. Designated East South-East Total Population 1979 121,941 82,454 281,857 300,802 252,137 516,474 190,231 1,255,533 366,788 3,368,217 1981 124,783 83,032 286,384 308,040 256,413 525,022 193,296 1,288,973 374,484 3,440,427 Change in Population + 2,842 + 578 + 4,527 +7,238 +4,276 +8,548 +3,065 +33,440 + 7,696 +72,210 Natural Increase 2,321 801 5,149 7,525 5,128 10,662 4,572 36,113 8,699 80,970 Estimated Net Migration 521 - 223 - 622 - 287 - 852 -2,114 -1,507 -2,673 -1,003 -8,760
Average Annual Rates per 1,000 of average
Population Change
i n
Population + + + + + + + + + + 11.5 3.5 8.0 11.9 8.4 8.2 8.0 13.1 10.4 10.6 Natural Increase 9.4 4.8 9.1 12.4 10.1 10.2 11.9 14.2 11.7 11.9 Net Migration + 2.1 - 1.3 - 1.1 -0.5 -1.7 -2.0 -3.9 -1.1 -1.4 -1.3
[image:26.842.59.810.128.504.2]show that, with the exception of the border county Leitrim, all counties recorded increases in population.
1.8 The demographic trends discussed above differ considerably from those observed in the rest of the Community. The annual population growth rate over the last decade at almost 1^/2 per cent is almost four times the Community average, making Ireland's both the fastest growing national and regional population in the Community.
Urbanisation
1.9 While the percentage of the population living in towns is increasing as outlined in the Periodic Report on "The Regions of
the Community'1, Ireland, nevertheless, is characterized by a lov;
degree of urbanization with just oyer half the population classified as urban. Indeed, disregarding the capital and its
environs, only just over one third of the remaining population can be classified as urban i.e. living in towns with a population of
1,500 or over. Furthermore, apart from Dublin with its population of approximately 1 million, only one other town, Cork, had a
population in excess of 100,000. This emphasises the fact that in a Community context, Dublin provides the only growth point whose size is on a par with that of regional growth points elsewhere in the Community.
Age Structure and Dependency Ratios
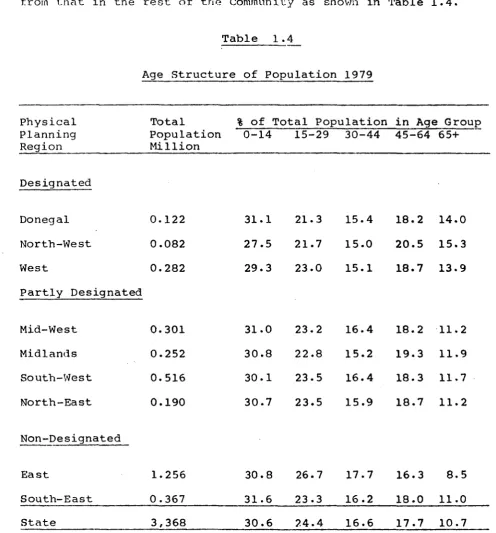
1.10 As a result of the very high population growth rate and of previous demographic trends, notably in relation to emigration, the age structure of the population also differs considerably from that in the rest of the Community as shown in Table 1.4.
[image:28.595.49.546.140.674.2]Physical Planning Region Designated Donegal North-West West Partly Desi Mid-West Midlands South-West North-East
Table 1 .4
Age Structure of Population
Total Population Million 0.122 0.082 0.282 .gnat ed 0.301 0.252 0.516 0.190 1979
% of Total Population 0-14 31.1 27.5 29.3 31.0 30.8 30.1 30.7 15-29 21.3 21.7 23.0 23.2 22.8 23.5 23.5 30-44 15.4 15.0 15.1 16.4 15.2 16.4 15.9
The moat noteworthy features of these data (the most recent
available relate to 1979) are the very high proportion of the
population in the youngest age groups - 30 per cent less than 15
years of age and 5 5 per cent less than 30 years of age - and the
low proportion in the oldest age group, features common to all
the physical planning regions, though with some variation
particularly in the case of the western half of the country.
1.11 Dependency ratios are thus very high in Ireland by
2
Community standards. According to projections made in 1978 ,
Ireland will continue to have a dependency ratio far higher than
any other of the Nine3 Member States in 1990. In 1990, Ireland's
dependency ratio is put at 67 against an average for the Nine of 50
1.12 Of particular significance is the fact that the rate of
"young dependency" is higher in Ireland than in any of the other
Member States or regions of the Community. Table 1.5 shows that
this very high ycung dependency rate is common to all the physical planning regions of the country. There is, in contrast, a degree
of variation in the rate of "old dependency" in the physcial
planning regions. While the overall rate in Ireland is low by
Community standards, being the lowest of the nine Member States,
it tends to be quite high along the western seaboard and in the
Midlands. However, because of a very low "old dependency" rate
in the East region, the overall national rate is quite low.
' defined as the proportion of the population in the economically inactive ago groups [0-14 (young dependency) and 65 and over (old dependency)] compared with those in the active age group (15-64).
*■ ' Kervyn Group Report on "The Economic implications of Demographic Change in the European Community 1975-1995" published by the Commission in 19 78·
3
Table 1.5
Dependency Rates in Ireland, 1979
Physical Planning Region
% of "Active" Population 0-1A 64+ Dependency Ratio Designated Donegal North-West West
5 6 . 7 4 8 . 2 5 1 . 6
2 5 . 6 2 6 . 9 2 4 . 5
82.3 75.0 76.1 Partly Designated Mid-West Midlands South-West North-East
5 3 . 6 5 3 . 8 5 1 . 6 5 2 . 9
1 9 . 5 2 0 . 9 2 0 . 1 1 9 . 3
73.0 74.6 71.7 72.1 Non-Designated East South-East 50.7 54.9 13.9 19.1 64.6 74.1
1.13 This low "old dependency" rate is however more than offset by the extremely high "young dependency" rate in all regions of the country. A high dependency ratio has important implications regarding the provision of social infrastructure as well as the level of social services. Τίτε difficulties created by a high dependency ratio are compounded when they are accompanied by increasing urbanization. A high dependency ratio affects the cost of the education, health and child support services in particular, while increasing urbanization affects housing and educational building programmes-principally.However, when dependency ratios are high, the active age groups form a
relatively small proportion of the population and this in turn creates a strain on public finances since the tax net is
relatively narrowly spread. Nevertheless, the provision of such social infrastructure is essential in itself and is also a
prerequisite for the attraction, retention and growth of foreign investment which is essential for the further economic
development of the country. Because of Ireland's limited resources, however, there is an urgent need for increased
Community aid towards the provision of this infrastructure which is just as essential for future development as investment in
factories.
Employment
1.15 The problem of creating new employment for an ever increasincj number of new entrants into the labour market is
compounded by the fact that jobs have also to be provided for job losses in other sectors. In addition, the male labour force
participation rate1 is high in Ireland by Community standards.
The female participation rate is, however, fairly low by such standards but indications are that this rate is increasing. The total participation rate is therefore slightly below the
Community average but is above the rate in Luxembourg, the Netherlands and Italy. *·
1.16 Furthermore, the structure of employment in Ireland, being heavily dependent on agriculture, as shown in Table 1.6, is
fundamentally different from that of the rest of the Community.
1.17 The primary sector thus accounts for about 19 per cent of employment in marked contrast to the situation at Community level where the sector accounts for only just over 7 per cent. In Italy, the most heavily dependent on agriculture of the other Member States, apart from Greece, the sector accounts for just under 13 per cent. The high degree of dependence on the primary sector is common to all the physical planning regions, though it is more pronounced in the designated areas. Only the East
1 participation rate is defined as the proportion of the
Table 1.6
Sectoral Employment in Ireland, 1979
Physical
Planning Region
Percentage of Total at Work Engaged in
Agriculture Industry Services
Designated
Donegal
North-West Wes t
3 2 . 6 2
3 8 . 2 3
2 9 . 2 3
2 3 . 3 3
38.15
38.44 Partly Designated Mid-West Midlands South-West North-East2 5 . 5 4 3 5 . 2 0 2 5 . 0 9 2 4 . 9 6
3 2 . 1 8 3 1 . 7 4 3 0 . 9 4 3 8 . 2 0
4 2 . 2 8 3 3 . 1 7 4 3 . 9 7 3 6 . 6 8
Non-Designated
East
South-East
4 . 2 9 2 4 . 1 2
3 3 . 5 9 3 4 . 2 0
6 2 . 1 2 4 1 . 7 6
State 19.28 32.13 48.59
planning region appears to conform with the Community average but this is due to the influence of the capital, the country's main centre of service employment. Dublin apart, agriculture accounts for some 17.4 per cent of employment in the East region.
1.18 As might be expected, the industrial sector is relatively
less developed as a source of employment than elsewhere in the Community, Ireland having the lowest share of industrial
employment of all the Member States, apart from Greece. While the sector's share is only slightly higher in Denmark and the
Netherlands, the situation is significantly different in these countries in view of the predominance of the tertiary sector.
1.19 The tertiary sector in Ireland accounts for 49 per cent of employment which is below the level obtaining in general in the Community. The relative predominance of service activity in the East planning region is again due tö the influence of the
capital. Service activity in Ireland is concentrated on Dublin where the sector accounts for 62 per cent of total employment. This is hardly surprising given the fact that the capital is the only city of sizeable proportions in the country. The capital apart, however, service employment accounts for only 45.6 per cent of total employment in the East planning region which is somewhat below the national average. The sector tends to be most developed of course in the non-designated areas. (Map 1.2 on page 27).
1.20 More precise data have recently become available as to the numbers employed in the main sectors of economic activity in
recent years. Following from the results of the 1979 Census of
Map 1.2
DESIGNATED A R E A S
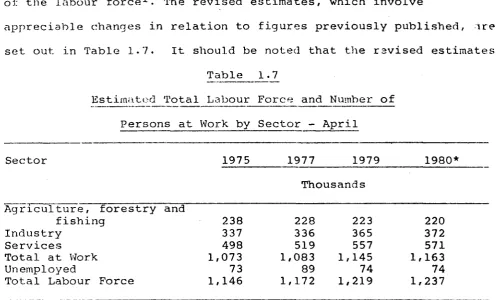
v/j Lh that Census it has been necessary to revise previous estimates of the labour force^. The revised estimates, which involve
[image:36.595.64.561.57.357.2]appreciable changes in relation to figures previously published, ire set out in Table 1.7. It should be noted that the revised estimates
Table 1.7 Estimated Total
Persons at
Sector
Agriculture, forestry and fishing
Industry Services
Total at Work Unemployed
Total Labour Force
Labour Work by 1975 238 337 498 1,073 73 1,146
Fo: ree and Sector -1977 Number of April 1979 Thousands 228 336 519 1,083 89 1,172 223 365 557 1,145 74 1,219 1 1 1980* 220 372 571 ,163 74 ,237 Source: Table 10. Economic Review and Outlook, Summer 1981, *The 1980 figures are provisional and refer to the situation as at April, 1980.
for the unemployed and for the total labour force (like the original estimates) do not include persons seeking regular work for the first time. While such information is available from each of the Labour Force Surveys, it will be recognised that, as this particular
aggregate is significantly influenced by the timing of the Survey, it is not possible to adjust this element of the 1975 and 1979 Survey data to a consistent April basis. The actual estimates for the number of such persons are as follows:
1 The Survey results have shown that in the previous estimates there was underestimation of the numbers at work in
non-agricultural activity, particularly in the building and construction and services sectors. The second factor is the change in the conceptual basis inherent in the Survey approach on which the figures are now based. This is particularly
marked in the case of the new unemployment estimates which are lower than the original figures. It is considered that a
major cause of this difference in level is the separate
197 5 end May : 20,000
1977 end April :16,000 1979 early June :14,000
1.21 This new evidence totally alters the record as regards employment changes in recent years. The main points to note are the following:
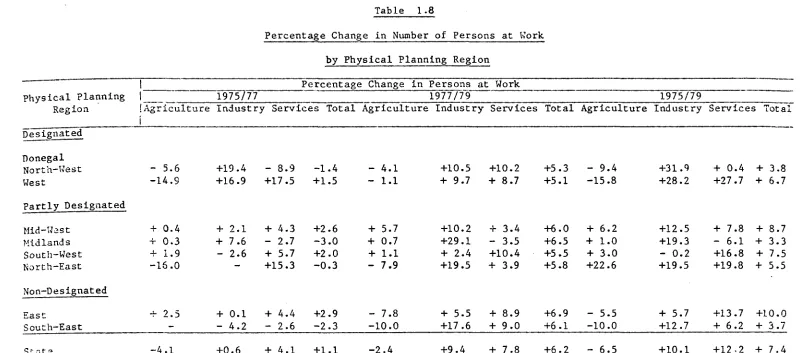
between 1975 and 1979 the labour force increased by 73,000 or over 6 per cent
the increase was more pronounced in 1977-79 at 47/000 (4 per cent) than in 197 5-7 7 when it was 26,000 (2.3 per cent)
employment in 1975-77 increased by 10,000
employment in 1977-79 increased by 62,000 (or 31,000 a year) which was well in excess of the targets set out in previous Regional Development Programmes
the numbers "out of work" in April 1979 is now put at 74,000 (excluding first time job seekers) or 6.1 per cent of the labour force which is well below the 1976 peak of 90,000 or 7.8 per cent.
OJ
α
Table 1.8
Percentage Change in Number of Persons at Work
by Physical Planning Region
Percentage Change in Persons at Work
Physical Planning I 1975/77 1977/79 1975/79
Region ¡Agriculture Industry Services Total Agriculture Industry Services Total Agriculture Industry Services Total
i
Oesignated
Donegal
North-West - 5.6 +19.4 - 8.9 -1.4 - 4.1 +10.5 +10.2 +5.3 - 9.4 +31.9 + 0.4 + 3.8
West -14.9 +16.9 +17.5 +1.5 - 1.1 + 9.7 + 8.7 +5.1 -15.8 +28.2 +27.7 + 6.7
Partly Designated
Mid-Wast + 0 . 4
Midlands + 0.3
South-West + 1.9 - 2.6 + 5.7 +2.0 + 1.1 + 2.4 +10.4 +5.5 + 3.0
North-East -16.0 - +15.3 -0.3 - 7.9 +19.5 + 3 . 9 +5.8 +22.6
Non-Designated
East + 2.5 + 0.1 + 4.4 +2.9 - 7.8 + 5.5 + 8.9 +6.9 - 5.5 + 5.7 +13.7 +10.0
South-East - - 4.2 - 2.6 -2.3 -10.0 +17.6 + 9 . 0 +6.1 -10.0 +12.7 + 6.2 + 3.7
Stats -4.1 +0.6 + 4.1 +1.1 -2.4 +9.4 + 7.8 +6.2 - 6.5 +10.1 +12.2 + 7.4
+ 2 . 1 + 7.6
+ 4.3 - 2.7
+2.6 - 3 . 0
+ 5.7 + 0.7
+10.2 + 2 9 . 1
+ 3.4 - 3.5
+ 6 . 0 + 6 . 5
+ 6.2 + 1.0
+12.5 +19.3 - 0.2 +19.5
+ 7.8 - 6.1 +16.8 +19.8
[image:38.842.28.830.117.470.2]1.2 2 There was, however, a deterioration in unemployment in 1980. The Live Register of Unemployment at end-1980 being 122,200 shows an increase of 3 3,600 on the numbers registered as unemployed at end-1979 i.e. 88,600. This represents an increase of almost 38 per cent or over 90 a day in the numbers out of work. Graph 1.2
illustrates trends in registered unemployment over the period 1977-1981 at national level. The deterioration of the
unemployment situation has been felt to varying degrees in
different areas of the country. Most seriously affected has been the South-East planning region where registered unemployment rose by 48 per cent. Other planning regions seriously affected were
the North-East, South-West, East and Midlands as shown in Table 1.9. At the other end of the scale, the numbers registered as unemployed in the North-West/Donegal planning region rose by 26 per cent but the level of unemployment in this planning region was already high.
1.23 The deterioration in the unemployment situation has
Graph 1.2
Live Register 1977/1981
130,000
125,000
120,000
115,000
110,000 ..
105,000
100,000
95,000
90,000
85,000
80,000
\
I\_-A —
^ V , 7 Λ
\^
A
V-+
\
— 1 i i i 1 — ,
I
L
7\_
j
L_t_
'
iii
TÍ
7
Ï
.
I
L_t
/
\4
1 i—'■ <- i — — — ι — ' 4. .' .1—¡—l—I—_ Feb. Apr Jim Aug. Oct. Dec. Feb. Apf. Jun.Aug. Oct. Dec. Feb. Apr. Jun Aug. Oct. Dec Feb. Apr. Jun Aug. Oct. Dec. Feb. Apf. Jun Aug. Oct. Dec
Table 1.9
Changes in numbers on the Live Register in the years to
end-December 1980 and end-October 1981
Physical Planning Region % Increase in Numbers
Registered as Unemployed
Designated
Donegal ) North-West ) West
Partly Designated
Mid-West Midlands
South-West North-East
Non-Designated
East
South-East
Year to end Dec.
26
29
30 39 45 45
39 48
19801 Year to end Oct. 19
8
14
16 10 23
1 14
1 15 I 27
Notified redundancies in the first nine months of the year, totallin just 9,200 were 22 per cent higher than in the same period last year reflecting a continuing high rate of job losses, mainly in industry, although there were 24 per cent fewer notified redundancies in the
third quarter than in the second. The latest comprehensive breakdown
of the Live Register figures by age and duration of unemployment was published in August and relates to end-October 1980. It shows that
24.9 per cent on the Live Register on that date were under 25 years, 62.1 per cent were aged between 25 and 54 years and the remaining 12.9 per cent were aged between 5 5 and 64 years. As regards duration of unemployment, 37.1 per cent of those on the Live Register in
October 1980 were registered for less than 13 weeks, 31.3 per cent for between 13 and 52 weeks and 31.6 per cent for 53 weeks and over.
1.24 From a social point of view, the experience in the labour market of certain sub-groups, such .as young people and women, is of particular importance. Labour force participation rates broken down by age and sex are given in Table 1.10. The influence of economic conditions on the participation rates for young people is evident. The participation rates for males up to age 24 and
for females up to age Io· fell between 1975 and 1977, reflecting
both the long-term trend towards staying longer in education and the impact of the recession. However, in the 1977-1979 period, when job opportunities were relatively plentiful, the
Table 1.10
Labour Force Participation Rates by Age and Sex in 1975,1977,1979
Age 15-19 20-24 25-34 35-44 45-54 55-59 60-64 65+_ Males 1975 47.3 90.1 97.2 96.6 94.0 89.0 77.9 28.2
1977 44.1 87.6 96.9 95.8 92.5 86.7 76.3 26.3 1979 46.2 89.9 96.9 95.7 91.2 83.7 71.2 26.0
Females 1975 42.0 66.0 30.5 22.3 24.6 22.4 19.1 7.2 1977 38.1 65.8 31.4 21.2 23.7 22.6 17.3 5.6 1979 38.8 68.0 33.4 22.9 24.0 23.0 16.9 4.6
Married 1975 24.5 24.1 16.0 14.4 15.7 12.6 10.5 4.5 Women 1977 * 28.4 16.7 14.3 14.4 11.4 7.8 2.9 1979 * 28.5 18.7 15.6 14.4 12.2 8.5 2.0 * sample too small to give a reliable estimate
Source:- Labour Force Surveys
1.25 As regards long-term unemployment, while the numbers registered as unemployed fell by over 20 per cent in the three years to end 1979, the numbers unemployed for more than a year showed virtually no
improvement at all.
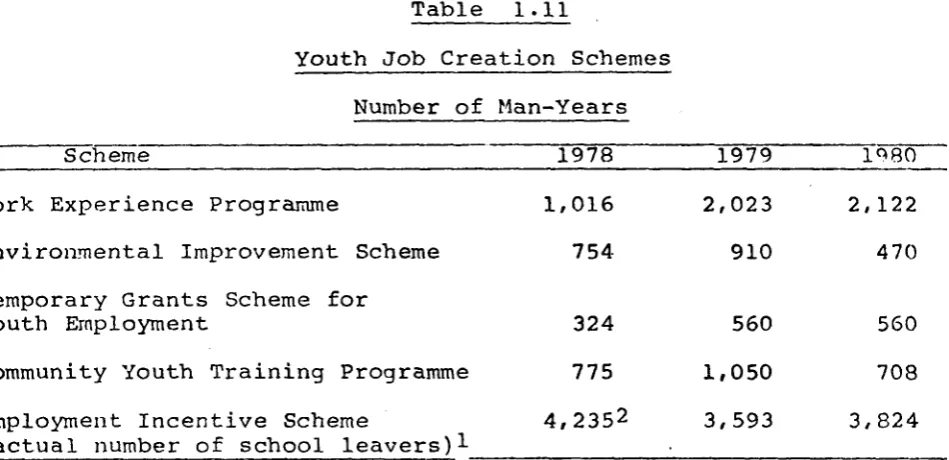
relate to those classified as unemployed in the Labour Force Survey including those looking for their first job. More up-to-date data o the trend of youth unemployment can be derived from the analysis by age group of persons on the Live Register (this does not, however, include very many of those seeking employment for the first time). Between January 1980 and January 1981, registered unemployment amon those under 20 increased by 24 per cent, while among 20-24 year old increased by 64 per cent, as against an average increase for all a groups of 36 per cent. As a special measure to curb youth unemploym
[image:44.595.96.571.284.514.2]job creation schemes were initiated, as shown in Table 1.11.
Table 1.11
Youth Job Creation Schemes Number of Man-Years
Scheme 1978 1979 1980 Work Experience Programme
Environmental Improvement Scheme Temporary Grants Scheme for
Youth Employment
Community Youth Training Programme Employment Incentive Scheme
(actual number of school leavers)1
1 Participants may be employed up to a limit of 24 weeks.
2 The corresponding numbers of adult participants which would
include a proportion of young people up to 25 years of age, oth than school leavers, were 6,175, 3,376 and 2,923 respectively. Projected increase in the labour force
1.27 The three main factors influencing the growth of the labour force viz the rate of increase in the population, the structure of the population and participation rates have now been
discussed. The manner and degree to which these variables have
fluctuated unpredictably in the past makes forecasting of them a mo hazardous business than in other countries. This is especially true
respect of the rate of increase in the population which has defied accurate forecasting in the past. Little more can be done in these circumstances other than to project previous trends in a mechanistic way without placing too much confidence in the outcome. On the basis of
such trends and on the technical working assumption of zero net
migration, the structure of the population implies an average increase in the population of working age (persons aged 15-64) of nearly 30,000 a year up to 1985. This figure will have to be reviewed in the light of the 1981 Census result which points to resumption of net emigration albeit at a fairly low level. As regards participation rates, a higher number of young persons, male and female, could delay their entry into the labour force in line with the higher educational standards required of members of the work force in an increasingly developing economy. Participation rates in the older age groups could also fall, in line with the long term trend towards earlier retirement, particularly by
farmers. On the other hand, participation rates fox· married women could, continue to increase since long-term trends favourable to married
women's employment - for example, the growth in clerical and professional job opportunities and the tendency towards earlier completion of families -are expected to intensify in the future.
1.28 In the aggregate, past trends in participation rates have
resulted in a slight decline in overall participation rates in recent years but, for the period to 1985, the relative increase in the
proportion of persons in the more active age groups means that the overall participation rate could remain relatively stable at its 1979
level of approximately 52 per cent. This assumption may also need to be revised in the light of the results of the 1981 Census.
Programme, and the calculations based on them, suggest that the average increase in the numbers seeking work in the period covered might fall in the range of 15,000 to 20,000 a year exclusive of new
jobs required to replace job losses including the decline in the numbers at work on the land. Considerable year-to year variations
around the range can be expected.
1.30 Because of its importance and the degree of uncertainty
attaching to it, the projected increase in the labour force will be continually reviewed.
Job Requirements
1.31 An increasing labour force affords only a partial view of the gross numbers of jobs required in the period to 1985. Account must also be taken of the continuing decline in the numbers engaged in agriculture and of job losses in the non-agricultural sectors. If there is to be no increase over the current level of unemployment by 1985, jobs will be required on a scale sufficient to absorb the
increase in the labour force and to offset the incidence of job-loss throughout the economy. The working assumptions adopted, combined with past experience, would suggest an annual average gross job requirement over the next five years in the region of 40,000. Personal Incomes
Table 1.12 Personal Incomes Physical Planning Region Designated Donegal North-West West Partly Designated Mid-West Midlands South-West North-East Not Designated East South East State ) ) Personal Incomes per capita 1977
[image:47.842.39.834.103.459.2]had the lowest increase in relative terms between 1969 and 197 7. In contrast, the designated planning regions experienced a relatively higher increase in incomes than either the partly or non-designated
regions. Thus, while the ranking for the planning regions by income per capita has changed very little, nevertheless, comparison of the lowest per capita income region
(North-West/Donegal) with that of the highest per capita income region (East) shows a definite tendency towards convergence over the
period 1969 to 197 7 though there has been some slowing down in the rate at which this convergence has been taking place as illustrated in Graph 1.3. This tendency towards convergence is in marked
contrast to the trend at Community level over the same period as evidenced in the Periodic Report on "The Regions of the
Community"!. The trend at Community level is illustrated in Graph 1.4.
1.33 As might be expected, agriculture is of particular
significance as a component in personal incomes, as Table 1.13
demonstrates. This is true of all planning regions including the Easi planning region where the figure is distorted because of the large element of non-agricultural income in Dublin.
Graph 1.3
Personal Incomes per capita as % of National
Average-%
130
120
110
100
90
80
70 1
2
5
':
-—;T
_ - - "■ ■
^___. . - - - - - - .
-1
9 3 4
5 8
6 7
1969 70 71 72 73 74 75 76 77
1. 2. 3. 4. 5. 6. 7. 8.
East
South West Mid West South East North East Midlands
North West/Donegal West
Graph 1.4
GDP per Capita as % of Community average*
1969 70 71 72 73 74 75 76 77 79 79 1. Denmark
2. Luxembourg 3. Germany 4. France 5. Belgium
6. Netherlands 7. United Kingdom 8. Italy
9. Ireland
Table 1.13
Agricultural Income1 as a % of Total Personal Income 1977
Physical Planning Region Agr. Income as % of Total Income Designated
Donegal ) North-West) West
21.5 22.5 Partly Designated
Mid-West Midlands
South-West North-East
23.9 26.7 23.6 23.4 Non-Designated
East
South-East
4.0 29.2
State 15.8
[image:51.595.39.541.63.670.2]Domestic Regional Policy
1.34 The aims of the Government's domestic regional strategy in the 1970s (which is presently under review) were to end
involuntary emigration from the country as a whole; to seek the attainment of national growth; and to provide for the maximum spread of development through all physical planning regions, so giving an increased and wider range of economic and social
opportunities, thereby reducing income disparities and minimising population dislocation through internal migration.
1.35 The analysis above suggests that significant progress is being made towards the achievement of these broad aims of regional policy. Changes in population pattern, the reduction in the gaps in average incomes as between planning regions together with
regional changes in employment and unemployment have been adverted to earlier in thi3 chapter. Main concerns at domestic regional level, at present, are minimising involuntary internal migration and further reducing intra-regional disparities in' income. In the shorter term, these disparities could be reduced by transfers, but the longer term aim must be to reduce the gaps in primary incomes i.e. those generated within the physical planning regions
themselves. This cannot be done without developing the indigenous potential Of each region by, inter alia, strengthening
infrastructural and productive investment in the regions.
but also of the desirability of equalising opportunities
and standards throughout the country. It is of crucial importance that urban structures in other regions be strengthened in
order to provide a sufficient range of facilities for attracting manufacturing and especially service employment to absorb local and regional labour resources. Such regions are therefore accorded very high priority in the Government's economic and social
programmes, particular attention being given to those in the designated areas, largely in the western half of the country.
1.37 Without prejudice to this concept, however, policy must also address itself to the serious problems at present facing Dublin, where the effects of the recession, particularly on employment, have been severe. Remedial action is being taken, however. Policy in
relation to the promotion of industrial investment and the
availability of financial and other incentives has been adjusted in order to cope with the problems of unemployment and redundancy in the city, while the Government also plan to invest heavily in the
provision and upgrading of infrastructure in the coming years. The Road Development Plan for the 1980s, published by the Government in x979, set as one of its major objectives the improvement and
upgrading of the principal access routes to the capital. Major investments in Dublin and its environs at present include the
electrification of commuter railway lines, major drainage schemes and major road and bridge works, many of these being assisted by the
Regional Fund. Planned investment includes the piping of natural gas from the Kinsale field to the Dublin area, thus reducing dependence on other sources of energy and enhancing the city's attractiveness for industrial development.
long-term, sub-standard housing, low educational attainment and
general social deprivation. Tn response to these problems, the
Government have set up an Inner City Group of officials reporting to the Minister for the Environment, whose remit it is to
co-ordinate and accelerate public programmes as they apply to the inner city. In addition to expenditure undertaken directly by
Departments under existing programmes, IR£1.25 million (1.81 mECU)
has been made available to date to the Group for its work. The
Group's activities have emphasised employment creation, education and training and the upgrading of the environment.
1.39 The concept of controlling urban growth while, at the same time dealing with acute problems in the city, is far from unique and in no way invalidates the overall strategy being pursued in relation to the development of smaller urban centres elsewhere in the country.
Regional Institutions
1.40 There are numerous bodies in the public sector whose work has a regional dimension. These include the Industrial Development
Authority and Bord Failte Eireann (the State Tourist Board) and ACOT, the Agricultural Development Authority. Both in structure and operation, these are regionally oriented. There are, in addition, a number of other bodies which exist to further the interest of the subnational region they cover. These include the Shannon Free Airport Development Company (SFADCo) (which operates in the Mid-West planning region), Udaras na Gaeltachta (which operates in the Irish speaking districts mainly situated in the West of Ireland) and the Central Development Committee, under whose aegis a number (13) of County Development Teams operate
region. The various bodies concerned with development in the region -mainly local authorities, certain Government Departments, the
Industrial Development Authority, Bord an Mona (the Peat Development Board), Coras Iompair Eireann (the State Transport Authority), Bord Failte (the State Tourist Board), Harbour Boards - are represented in the Organisations. The RDOs, which are non-statutory bodies, do not have executive functions in their own right. They have produced
reports setting out the main considerations bearing on development and putting forward views as to how the potential of the regions could be
fully exploited. They have carried out a number of studies and activities related to their role. A comprehensive regional development strategy for the Midlands planning region which was prepared with the financial assistance of the Commission of the
European Communities has recently been published. Assistance has also been sought towards the cost of regional development strategies for the North-East and West planning regions. As indicated in Table 5.1, the local authorities throughout the country also play an important role in the regional development process.
Cross-Border Cooperation
Non-Quota Section of Regional Fund
1.41 A special effort is also required to ensure that the border areas share to the fullest extent possible in the development
process. The border areas of Ireland - on both sides of the border - are among the least developed areas of the Community and their development requires the fullest cooperation of the Authorities on both sides and the involvement of the European Communities which have a special responsibility towards their less developed
Communities on 7 October 1980 of a Regulation instituting a specific Community regional development measure contributing to the improvement of the economic and social situation of the border areas (Map 1.3) of Ireland and Northern Ireland. This measure is one of five to be assisted in various regions of the Community under the Non-Quota Section of the Regional Fund. The measure is being implemented by means of a Special Programme which is concerned with the development of economic activities in
tourism, communications, craft industries and small and medium size undertakings. As far as the southern side of the border is concerned, a Special Programme Fund has been established to
finance the programme. The Fund, which amounts to just over IR£20 million (29 mECU) is being financed equally by the Irish Government and the Community. The programme has commenced and several of the development measures are well under way. The size of the Fund
is small in relation to the area it .covers. For this reason it will be neccessary to carefully monitor the progress of the programme to ensure that measures which are achieving the objectives of the programme - the improvement of the economic and social situation
in the border countries - receive priority.
EEC Cross-Border Drainage Scheme
1.42 In addition to the Non-Quota Section measure, the Council approved on 6 February 1979, a drainage programme for catchment areas on both sides of the border involving a maximum contribution of 8 mECU (IR£5 million approximately) or, if less than this
maximum, to provide 50 per cent of the total combined costs to the Irish and British Governments of whatever drainage schemes are
undertaken. The grant will be used by the Office of Public Works and the Northern· Ireland Department of Agriculture for work on the
Ulster Blackwater and Finn-Lackey (Erne tributary) catchments.
Map 1.3
Bordar Areas (shaded) covered by Regulation (EEC) No 2619/80
νζΔ
V/ '/
vS/λ Border Regions
1 : 2,000,000 1 cm = 20 Km
Cress-Border Studies
1.43 As a means of providing guidelines towards an overall co-ordinated strategy for border areas, several studies of a cross-border nature have been undertaken on a joint basis by the Irish oud British Governments acting in some cases with Community
participation. These reports effectively span almost the entire length of the border starting with the Derry/Donegal Communications Report, the Erne Catchment Report, the Mourne Herring Fishery Report and finally the Rewry/Dundalk Study. These studies are discussed only
briefly in the following paragraphs as fuller information is contained in the separate Special Programme for the Development of the Border Areas·'· submitted to the Commission of the European Communities in the context of the Non-Quota Section of the Regional Fund.
Derry/Donegal Communications Study:
1.44 The study had the following terms of reference:
"To examine communications, including transportation (e.g. roads, railways, ports, airports, telecommunications) in the Derry and Donegal area in the light of existing
projects and plans in order to determine their adequacy and to make recommendations for future development, having
regard to financial constraints".
The consultants' report, half the cost of which was borne by the Regional Fund, was published in December 1977. Subsequently, the main recommendations of the report were endorsed in a separate study carried out by the Economic and Social Committee of the European Communities, published in June 1978. Following
publication of the report, the Irish Government reached agreement in principle on a programme of implementation covering the main areas of the consultants' recommendations and substantial
progress is being made in a number of areas such as roads and télécommunications, the operation* of freight transport services, harbour improvements, tourism, transport etc.
Erne Catchment Area Study:
1.45 Τίτο study, jointly commissioned and financed by the Irish and British Governments and the Commission of the European
Communities (the latter's contribution being provided from extra funds added to Article 266 of the EEC Budget at the instigation of the European Parliament) had the following terms of reference:
"To assess and report on the development potential of the Erne Catchment Area with reference to the development of
tourism amenities and tourism requirements in matters such as accommodation, access and marketing and of the development of land resources through arterial drainage and to make
recommendations for the area as a whole".
1.46 The report provides a comprehensive and detailed analysis of the Catchment Area and a practical strategy for developing its resources. Its main recommendations relate to the following objectives
improving agriculture conditions through arterial drainage - enhancing the identity of the Erne
reinforcing the existing tourism products of the area and developing new products which reflect the resources base of the Catchment
increasing the quantity', range and quality of accommodation improving accessibility and transport services at the inter regional and intra-regional levels
providing infrastructure to sustain an increased flow of tourists to the Catchment
extending the market spectrum.
The study proposes a development strategy to implement these
recommendations at a cost of IR£68.75 millionl (100 mECU) (in 1979 prices) for both sides of the border. It is envisaged that the
European Community, which has played a significant role in relation to the report, will have an important role to play in relation to the follow-up action to be taken. While the Government have not yet
considered the report in detail, an indication has been given by the Taoiseach to local representatives that the Government's approach is a positive one in regard to some of the recommendations.
Newry Dunda Ik Area Study
1.47 The objectives of the study
were:-to determine whether there were areas in which there was scope for improvement in cross-border co-operation; and to identify whether further specific studies by
consultants would be of mutual benefit.
The study concentrated on industrial development and training; roads; ports; water supply; tourism; electricity supply; customs facilities; telecommunications; planning; drainage; and fisheries. The report, which was published in April 1980, acknowledges that cross-border co-ordination and co-operation have been good in most of the functional areas studied, but also makes a number of
recommendations of which the most important are the commissioning of studies to examine alternative routes for the Newry/Dundalk section of the Belfast/Dublin road and of the tourism resources and potential of the area.
1.48 This study was somewhat different to the other cross-border reports in that it was the direct work of Government officials and, in consequence, there has already agreement to the various proposals made in the report. Hence speedy implementation is assured. In fact, the tourism study has already been completed by the Tourist Boards, North and South, and should be available shortly. In relation to the road study, it is the intention to seek Regional Fund assistance towards the cost of carrying it out.
Mourne Herring Fishery Report
1.49 This study, like the Erne study, was jointly commissioned and financed by the Irish and British Governments and the European
Commission, the latter's contribution again being provided from the special funds added to Article 266 of the EEC Budget at the
fishery with a view to establishing a future management require which would ensure the maximum sustained benefits to the local coastal communitites which have depended upon the fishery for income and employment over several centuries. The study was
considered to be particularly timely in view of the rapid decline of the Mourne herring stock during the 1970's, culminating in complete closure in 1979. The consultants' report, which was
published in May 1980, makes a number of recommendations including continuation of the temporary closure of the fishery, collection of
further scientific data, the establishment of a regional management group, and that an investigation be carried out to identify the dependence of coastal communities on the resources of the fishery. The report is presently being examined by both Governments with due regard being had to current negotiations within the European
Community to establish a Common Fisheries Policy.
Economic Cooperation
1.50 Economic cooperation was among the subjects covered in the Joint Report submitted to the Taoiseach and British Prime Minister at their meeting in London on 6 November 1981. The Report
considered a wide range of existing and potential areas of economic and technical cooperation, both bilateral and in the context of the two countries' common membership of the European Community and made recommendations as to how these might be encouraged and developed. The Report noted that a substantial amount of economic and
technical cooperation already existed between the two countries but that closer cooperation could open the way to greater and mutually advantageous rationalisation and harmonisation in a range of
future co-operation on energy, in particular, the
possibilities for electricity interconnection both across the land border and across the Irish Sea and for the supply of gas from the Kinsale field to Northern Ireland and the
exploitation of new energy technologies
exchange of information on pollution of the Irish Sea and co-ordination of responses to pollution emergencies
broadcasting of television and radio programmes direct to the home from a satellite
- co-operation in the field of animal and plant health the facilitation of economic development in Lough Foyle, Carlingford Lough and the nearby offshore areas
industrial development, particularly of small and craft industries
trade promotion industrial training tourism
continuing co-operation in the economic development of border areas
- science and technology.
The Report hoped that the measures envisaged would make a
contribution towards the improvement of the economy of the two islands and that the practice of economic cooperation would, in itself, generate further cooperation.
Infrastructure
1.51 Before reviewing the main sectors of economic activity, brief reference should be made to the general situation in regard to the
levelvof provision of infrastructure in Ireland, since, as will be
evident from this Programme, the economic and social development of the region is being hindered - in some cases severely - by
1.52 The rate of growth of population, industrialisation and urbanization experienced in Ireland in the last decade - the most rapid in the Community - has placed very considerable demands on the region's infrastructural capacity. The expansion of this capacity has fallen far short of this growth in demand with the r