Original Article
Polymorphisms of telomere-length related
genes in three China ethnic groups
Fanglin Niu1*, Jingjie Li1*, Jing Li1, Mengdan Yan1, Xugang Shi2, Tianbo Jin1,2
1Key Laboratory of Resource Biology and Biotechnology in Western China (Northwest University), Ministry of
Education, School of Life Sciences, Northwest University, Xi’an, Shaanxi, China; 2Xi’an Tianqin Precision Medical
Institute, Xi’an, Shaanxi, China
Received June 24, 2017; Accepted June 26, 2017; Epub September 1, 2017; Published September 15, 2017
Abstract: Little is known about polymorphic distribution of telomere-length related genes among ethnicities, which play important roles in the progression of high-altitude pulmonary edema (HAPE). We genotyped 45 single nucleo-tide polymorphism (SNP) in 300 unrelated healthy volunteers from the following three Chinese ethnic populations:
Han (n = 100), Tibetan (n = 100) and Sherpa (n = 100). We used χ2 test, pairwise FST values, and structure
clustering analyses to investigate the genetic differences between these populations. Our results first indicated
that rs12615793 (ACYP2), rs10936599 (TERC), rs10069690 (TERT) and rs6010620, rs4809324 (RTEL1) showed
the greatest number of significant differences between Han and Tibetan, Sherpa and 11 HapMap populations.
Meanwhile, we found that rs1056654 and rs1056629 (MPHOSPH6), rs2320615 (NAF1), rs6010621 (RTEL1), rs8105767 and rs2188972 (ZNF208) genotype frequencies showed considerable divergence among Tibetan and Sherpa. Besides, pairwise FST values and structure clustering analyses revealed that Han exhibited a close genetic
affinity with CHD and CHB, but revealed a great genetic heterogeneity with YRI and MKK. This work greatly expanded
our understanding of the distribution of telomere-length related genes in Chinese populations and may be helpful to forensic applications and population genetic studies.
Keywords: Single nucleotide polymorphism (SNP), telomere-length related gene, ethnic difference
Introduction
Telomeres are nucleoprotein complexes com-posed of noncoding TTAGGG repeats at the ends of chromosomes in eukaryotic cells that are crucial in maintaining chromosome integri-ty and genomic stabiliintegri-ty through prohibiting nucleolytic degradation, chromosomal end-to-end fusion and irregular recombination [1-3]. Telomere length is determined by the balance of processes that shorten and lengthen the telomere [4]. The average telomere length rang-es from 10 to 15 kb in human somatic cells, and they shorten by 50-200 bp with each cell division [5]. During somatic-cell replication, telomere length progressively shortens due to the inability of DNA polymerase to fully repli-cate the 3’end of the DNA. In general, a criti-cally short telomere length can trigger cell to enter replicative senescence with a result of cell death [6]. Therefore, telomere length acts
as a mitotic clock that defines the lifespan of somatic cells [7, 8].
HAPE is a hypoxia-inducedpulmonary edema characterized by exaggerated pulmonary hyper-tension caused by stress failure [14]. It may develop in otherwise healthy individuals when first quickly ascended and exposed to altitude above 2500m. Nevertheless, whether there are differences in different populations have not been unknown.
As we all know, there are 56 ethnic groups in China. The majority of the ethnic people are known as the Han Chinese, which is the most population group (91.59%). Lantian is a county of Xi’an which located in the southern part of the Guanzhong Plain. Tibetan population is a major minority ethnic group, who mostly lives in compact communities located in highlands and mountainous regions, is geographically isolat-ed from other ethnic groups in the region and rarely intermarries with other Chinese ethnic groups. Sherpa refers to a minority ethnic pop-ulation that has resided for almost 500 years in the Himalayan region, who mostly lives in the border areas with a long life expectancy, where the elevation ranges from 1600 to 4000m. There are very diverse genetic backgrounds, unique lifestyle, distinct dietary habits, various-cultures and different resident geographical environments between these populations. Previous researches also showed that the inci-dence of high altitude sickness [15], hypoxic adaptation [16, 17], oxygen free radical metab-olism [18] are different between Han and Tibetan populations.Genetic susceptibility mi- ght have different results from Han population. We presumed that there might be different genetic information of some telomere-length associated genes in different populations. Therefore, the main aim of this study was toin-vestigate the genotypes frequencies of poly-morphisms of these genes in distinct ethnic groups. Our results may be helpful to forensic applications and population genetic studies. Materials and methods
Ethics statement
The study protocol was approved by the Ethics Committee of Northwest University and was conducted in accordance with the Declaration of Helsinki. Written informed consent was obtained from all subjects before participation in the study.
Study subjects
A total of 300 volunteers from three distinct ethnic groups in China including 100 Han, 100 Tibetan and 100 Sherpa individuals were re- cruited for the present study. The participants gave a detailed medical history after carefully interviewed and underwent a physical examina-tion prior to the study. The inclusion criteria were as follows: (1) All individuals had at least three generations of paternal ancestry in their ethnic group without history of intermarried with any other ethnic groups; (2) There was no genetic relationship among all participants; (3) All participants were healthy and had no heredi-tary disease.
SNPs selection and genotyping
We selected 45 single-nucleotide polymor-phisms (SNPs) which located in eight telomere-length associated genes for genotyping. And the minor allele frequencies (MAF) of all of the SNPs were > 5% in the HapMap Han Chinese population. Peripheral blood (5 ml) was collect-ed from each subject in vacutainer tubes con-taining ethylene diaminetetraacetic acid (EDTA). Genomic DNA was extracted using a GoldMag-Mini Whole Blood Genomic DNA Purification Kit (GoldMag Co. Ltd., Xi’an, China) according to the manufacturer’s protocol. DNA concentra-tion and purity were measured by a NanoDrop 2000 (Thermo Scientific, Waltham, Massach- usetts, USA). Polymerase chain reaction (PCR) and extension primers for these SNPs were designed using the Sequenom MassARRAY Assay Design 3.0 software (Sequenom, San Diego, California, USA), presented in Table S1. SNPs genotyping was performed utilizing the Sequenom MassARRAY RS1000 recommend-ed by the manufacturer. Sequenom Typer 4.0 Software was performed to manage and analy-sis data.
Statistical analysis
Table 1. Basic characteristic of the selected variants in Han, Tibetan and Sherpa
SNP-ID Genes Chr Position
Alleles MAF (%) Han (count) Tibetan Sherpa P value
A/B Han Tibetan Sherpa AA AB BB AA AB BB AA AB BB Han vs. Tibetan Han vs. Sherpa Tibetan vs. Sherpa
rs6713088 ACYP2 2 54198973 C/G 54.0 60.0 70.9 36 42 22 34 52 14 47 45 6 0.235 0.005 0.056
rs12621038 ACYP2 2 54244617 C/T 54.0 49.5 43.9 32 44 24 24 51 25 20 47 32 0.432 0.135 0.501
rs1682111 ACYP2 2 54281483 A/T 30.0 24.0 29.8 9 42 49 4 40 56 8 43 48 0.295 0.963 0.358
rs843752 ACYP2 2 54300091 G/T 73.5 68.5 71.2 54 39 7 46 45 9 50 41 8 0.517 0.876 0.816
rs10439478 ACYP2 2 54312954 A/C 56.5 55.7 58.2 32 49 19 29 49 18 34 46 18 0.955 0.922 0.79
rs843645 ACYP2 2 54328168 G/T 74.0 68.5 71.2 54 40 6 46 45 9 50 41 8 0.464 0.800 0.816
rs11125529 ACYP2 2 54329370 A/C 75.0 85.0 91.0 54 42 4 75 20 5 82 18 0 0.003 0.000 0.067
rs12615793 ACYP2 2 54329418 A/G 75.3 85.5 91.2 54 41 4 76 19 5 80 17 0 0.003 0.000 0.075
rs843711 ACYP2 2 54332621 C/T 49.0 52.5 62.0 21 56 23 26 53 21 37 50 13 0.703 0.023 0.143
rs11896604 ACYP2 2 54332703 C/G 74.5 84.5 90.5 53 43 4 74 21 5 81 19 0 0.004 0.000 0.067
rs843706 ACYP2 2 54333873 A/C 49.5 52.5 61.5 22 55 23 26 53 21 36 51 13 0.794 0.043 0.171
rs17045754 ACYP2 2 54350261 C/G 77.0 85.5 90.5 57 40 3 76 19 5 81 19 0 0.005 0.001 0.076
rs843720 ACYP2 2 54364164 G/T 62.0 67.5 71.5 38 48 14 46 43 11 52 39 9 0.497 0.123 0.683
rs1056675 MPHOSPH6 16 80739435 C/T 55.1 69.2 63.5 33 43 23 47 43 9 40 47 13 0.014 0.164 0.481
rs1056654 MPHOSPH6 16 80739512 A/G 69.0 68.5 81.0 50 38 12 51 35 14 66 30 4 0.866 0.028 0.02
rs1056629 MPHOSPH6 16 80739605 C/T 69.0 68.5 80.6 50 38 12 51 35 14 64 30 4 0.866 0.036 0.025
rs3751862 MPHOSPH6 16 80739730 A/C 95.5 95.0 95.9 92 7 1 90 10 0 89 8 0 0.460 0.585
-rs11859599 MPHOSPH6 16 80740333 C/G 19.0 32.5 40.5 4 30 66 12 41 47 13 55 32 0.012 0.000 0.085
rs2967361 MPHOSPH6 16 80761004 G/T 20.7 31.5 35.5 7 27 65 12 39 49 14 43 43 0.057 0.005 0.691
rs3792792 TNIP1 5 150420699 C/T 95.0 98.5 99.0 90 10 0 97 3 0 96 2 0 - -
-rs4958881 TNIP1 5 150430429 C/T 94.5 97.0 98.0 89 11 0 94 6 0 94 4 0 - -
-rs7708392 TNIP1 5 150437678 C/G 30.5 32.5 33.7 8 45 47 11 43 46 9 48 41 0.767 0.762 0.69
rs10036748 TNIP1 5 150438339 C/T 30.0 32.5 33.3 7 46 47 11 43 46 9 48 42 0.606 0.753 0.722
rs960709 TNIP1 5 150441242 A/G 29.9 32.0 34.2 7 44 46 10 44 46 9 49 40 0.785 0.627 0.698
rs2320615 NAF1 4 164289399 A/G 22.0 18.0 27.3 6 32 62 1 34 65 7 39 51 0.157 0.408 0.039
rs9420907 OBFC1 10 105666455 A/C 0.0 2.5 3.1 0 0 100 1 3 96 0 6 92 0.130 - 0.356
rs9325507 OBFC1 10 105635612 C/T 66.0 60.5 53.5 41 50 9 36 49 15 26 54 19 0.400 0.029 0.313
rs3814220 OBFC1 10 105637290 A/G 66.0 60.5 53.5 41 50 9 36 49 15 26 55 19 0.400 0.028 0.297
rs12765878 OBFC1 10 105659612 C/T 66.0 60.5 53.5 41 50 9 36 49 15 26 55 19 0.400 0.028 0.297
rs11191865 OBFC1 10 105662832 A/G 66.0 61.3 53.0 41 50 9 36 47 14 25 55 19 0.482 0.021 0.187
rs6010620 RTEL1 20 61780283 A/G 71.5 80.0 70.2 51 41 8 65 30 5 50 39 10 0.130 0.871 0.091
rs6010621 RTEL1 20 61781316 G/T 73.0 79.5 68.2 54 38 8 65 29 6 47 41 11 0.285 0.586 0.04
rs4809324 RTEL1 20 61788664 C/T 90.5 90.5 88.0 83 15 2 83 15 2 79 18 3 1.000 0.751 0.751
rs2297441 RTEL1 20 61798026 A/G 67.0 71.5 70.0 49 36 15 50 43 7 49 42 9 0.170 0.375 0.873
rs10936599 TERC - - - 47.0 40.5 35.9 28 38 34 17 47 36 11 49 39 0.157 0.010 0.486
rs10069690 TERT 5 1332790 C/T 89.9 82.8 88.5 80 18 1 70 24 5 80 17 3 0.123 0.599 0.308
rs2242652 TERT 5 1333028 A/G 88.5 81.5 88.8 77 23 0 68 27 5 78 18 2 0.053 0.273 0.153
rs2853677 TERT 5 1340194 A/G 34.5 33.5 33.8 8 53 39 12 43 45 12 43 44 0.321 0.343 0.997
rs2853676 TERT 5 1341547 C/T 14.0 23.0 15.5 2 24 74 8 30 62 1 29 70 0.070 0.633 0.051
rs8105767 ZNF208 - - - 71.2 75.0 61.5 50 41 8 55 40 5 36 51 13 0.626 0.103 0.012
rs2188972 ZNF208 19 21941298 A/G 47.0 57.5 70.5 21 52 27 32 51 17 52 37 11 0.102 0.000 0.016
rs2188971 ZNF208 19 21944022 C/T 29.5 38.0 41.3 9 41 50 16 44 40 23 35 40 0.204 0.021 0.323
rs8103163 ZNF208 19 21966592 A/C 29.5 38.0 40.5 9 41 50 16 44 40 23 35 42 0.204 0.026 0.312
rs7248488 ZNF208 19 21980549 A/C 29.5 38.0 40.5 9 41 50 16 44 40 23 35 42 0.204 0.026 0.312
Table 2. Han compared with 11 HapMap populations after Bonferroni’s multiple adjustments
SNP-ID ASW CEU CHB CHD GIH JPT LWK MEX MKK TSI YRI
rs6713088 - - 0.532 - - 0.083 - - - - 0.549
rs12621038 0.000 0.000 0.943 0.722 0.000 0.066 0.000 0.001 0.000 0.000 0.000
rs1682111 - - 0.858 - - 0.052 - - - - 0.012
rs843752 - - 0.707 - - 0.893 - - - - 0.000
rs10439478 - - 0.915 - - 0.072 - - - - 0.000
rs843645 0.779 0.779 0.333 0.821 0.000 0.348 0.001 0.091 0.000 0.169 0.001 rs11125529 0.018 0.018 0.517 0.054 0.000 0.016 0.214 0.006 0.001 0.001 0.106 rs12615793 0.000 0.000 0.631 0.366 0.000 0.023 0.047 0.009 0.000 0.001 0.001 rs843711 0.029 0.029 0.092 0.201 0.067 0.035 0.039 0.000 0.002 0.006 0.001 rs11896604 0.016 0.016 0.461 0.162 0.711 0.021 0.219 0.004 0.003 0.000 0.178 rs843706 0.365 0.365 0.128 0.320 0.066 0.049 0.083 0.000 0.006 0.004 0.050
rs17045754 - - 0.294 - - 0.182 - - - - 0.574
rs843720 0.001 0.001 0.704 0.299 0.392 0.431 0.000 0.001 0.000 0.013 0.000
rs1056675 - - 0.341 - - 0.570 - - - - 0.000
rs1056654 0.000 0.000 0.974 0.082 0.405 0.594 0.000 0.743 0.000 0.001 0.000 rs1056629 0.000 0.000 0.878 0.085 0.405 0.851 0.000 0.829 0.000 0.000 0.000 rs3751862 0.000 0.000 0.935 0.457 0.214 0.003 0.000 0.761 0.000 0.199 0.000
rs11859599 - - 0.182 - - 0.380 - - - - 0.059
rs2967361 0.000 0.000 0.674 0.447 0.002 0.113 0.000 0.252 0.000 0.034 0.000
rs3792792 - - -
-rs4958881 0.000 0.000 - - - - 0.000 - 0.000 0.074 0.000
rs7708392 - - 0.518 - - 0.351 - - - -
-rs10036748 0.131 0.131 0.577 0.878 0.000 0.842 0.007 0.001 0.180 0.000 0.000 rs960709 0.236 0.236 0.614 0.872 0.000 0.878 0.013 0.000 0.091 0.000 0.000 rs2320615 0.243 0.243 0.869 0.852 0.303 0.234 0.385 0.299 0.717 0.057 0.149
rs9420907 0.000 0.000 - - - - 0.000 0.000 0.000 0.000 0.000
rs9325507 0.688 0.688 0.514 0.505 0.294 0.582 0.944 0.341 0.013 0.000 0.128
rs3814220 - - 0.383 - - 0.964 - - - - 0.028
rs12765878 0.843 0.843 0.514 0.519 0.341 0.582 0.953 0.482 0.016 0.000 0.142 rs11191865 0.531 0.531 0.564 0.447 0.419 0.545 0.969 0.337 0.013 0.000 0.142 rs6089953 0.000 0.000 0.818 0.998 0.000 0.843 0.000 0.000 0.000 0.000 0.000 rs6010620 0.000 0.000 0.758 0.626 0.000 0.816 0.000 0.000 0.000 0.000 0.000
rs6010621 - - 0.278 - - 0.352 - - - - 0.000
rs4809324 0.126 0.126 0.473 0.875 0.672 0.133 0.001 0.000 0.041 0.409 0.003 rs2297441 0.000 0.000 0.263 0.055 0.000 0.296 0.000 0.000 0.000 0.000 0.000 rs10936599 0.000 0.000 0.017 0.341 0.000 0.003 0.000 0.001 0.000 0.000 0.000 rs10069690 0.000 0.000 0.016 0.190 0.000 0.011 0.000 0.024 0.000 0.003 0.000
rs2242652 - - - 0.030 - - - -
-rs2853677 0.251 0.251 0.520 0.153 0.000 0.098 0.648 0.414 0.008 0.103 0.008 rs2853676 0.109 0.109 0.970 0.868 0.000 0.385 0.070 0.284 0.000 0.001 0.211 rs8105767 0.000 0.000 0.532 0.639 0.052 0.710 0.000 0.954 0.003 0.568 0.000 rs2188972 0.000 0.000 0.248 0.767 0.000 0.213 0.000 0.131 0.000 0.145 0.000 rs2188971 0.005 0.005 0.298 0.809 0.000 0.419 0.967 0.423 0.604 0.007 0.684
rs8103163 - - 0.033 - - 0.097 - - - - 0.073
rs7248488 - - 0.153 - - 0.318 - - - - 0.178
ASW: African ancestry in the southwestern USA; CEU: a northwestern European population; CHB: the Han Chinese in Beijing,
China; CHD: a Chinese population of metropolitan Denver, Colorado, USA; GIH: the Gujarati Indians in Houston, Texas, USA; JPT: the Japanese population in Tokyo, Japan; LWK: the Luhya people in Webuye, Kenya; MEX: people of Mexican ancestry living in Los Angeles, California, USA; MKK: the Maasai people in Kinyawa, Kenya; TSI: the Tuscan people of Italy; YRI: the Yoruba in
Beijing, China (CHB); a Chinese population of metropolitan Denver, Colorado, USA (CHD); the Gujarati Indians in Houston, Texas, USA (GIH); the Japanese population in Tokyo, Japan (JPT); the Luhya people in Webuye, Kenya (LWK); peo-ple of Mexican ancestry living in Los Angeles, California, USA (MEX); the Maasai people in Kinyawa, Kenya (MKK); the Tuscan people of Italy (TSI) and the Yoruba in Ibadan, Nigeria (YRI) (data were from the second phase of HapMap: http://hapmap.ncbi.nlm.nih.gov) sep-arately, using chi-square test. Meanwhile, we also calculated and compared the genetic het-erogeneity between Tibetan and Sherpa using χ2 test. All p values in this study were two-sided,
and P ≤ 0.05 after Bonferroni correction was considered to be statistically significant.
We used Haploview software package (version 4.2) to perform the analysis of the linkage dis-equilibrium (LD), constructed haplotype and genetic association at significant polymorphism loci in Lantian Han, Tibetan and Sherpa. The Pairwise Fst values, Slatkins linearized Fst val-ues and coancestry coefficients among all of the populations were calculated in programAr-lequin v3.5.1.3 (Institute of Ecology and Evo- lution, University of Bern, Switzerland) using genotype data. We applied the Structure (ver-sion 2.3.4) software to analysis population genetic structure comparisons which works well on small number of loci.
Results
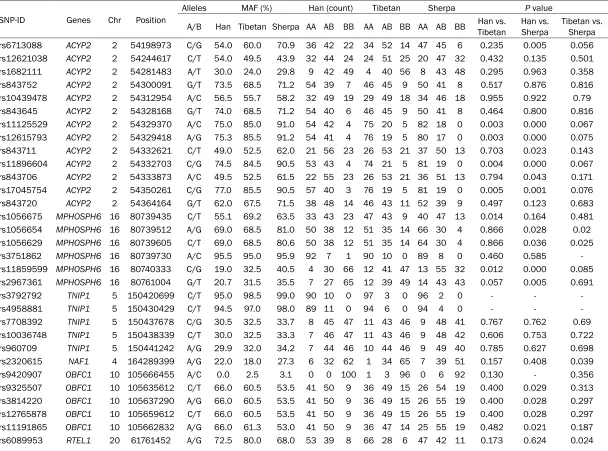
The basic information about the 45 selected SNPs are displayed in Table 1, including the gene name, chromosome number and position, minor allele frequencies and genotypic counts in the Han, Tibetan and Sherpa populations. We used χ2 test to evaluate the polymorphic
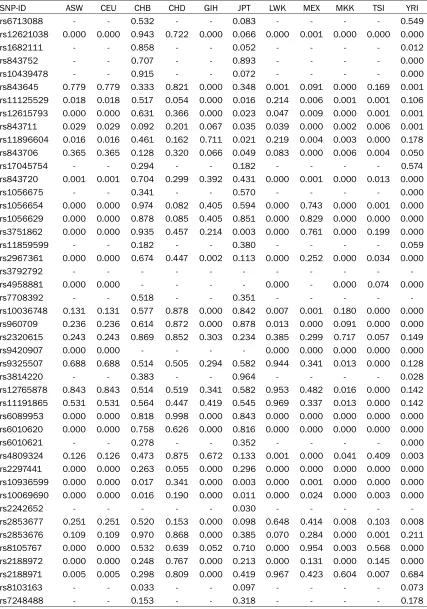
distribution of the variants between Han, Tibetan and Sherpa populations (Table 1). We found that four polymorphisms (rs11125529, rs12615793, rs11896604 and rs17045754) in ACYP2 and two polymorphisms (rs1056675 and rs11859599) in MPHOSPH6 (P = 0.003, 0.003, 0.004, 0.005, 0.014 and 0.012, respec-tively) were significantly different between the Han and Tibetan population. Meanwhile, twen-ty genetic variants in ACYP2 (rs6713088, rs11125529, rs12615793, rs843711, rs118- 96604, rs843706 and rs17045754), MPHO- SPH6 (rs1056654, rs1056629, rs11859599 and rs2967361), OBFC1 (rs9325507, rs381-
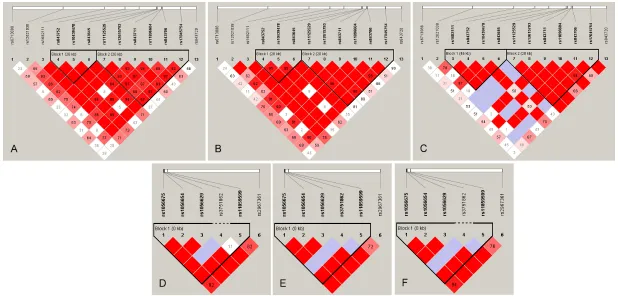
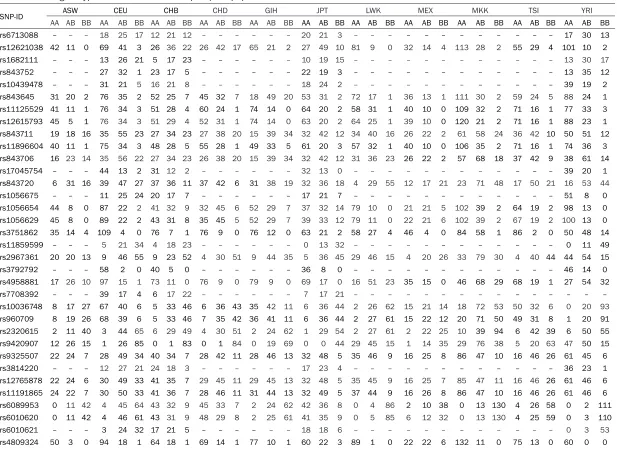
4220, rs12765878 and rs11191865), TERC (rs10936599) and ZNF208 (rs2188972, rs21- 88971, rs8103163 and rs7248488) showed considerable divergence among Han and Sh- erpa (P < 0.05). Additionally, we also found that rs1056654 and rs1056629 (MPHOSPH6), rs- 2320615 (NAF1), rs6010621 (RTEL1), rs81- 05767 and rs2188972 (ZNF208) (P = 0.020, 0.025, 0.039, 0.040, 0.012 and 0.016, respec-tively) were significant genetic divergences between the Tibetan and Sherpa population. Furthermore, we also used chi-square test to compare the genotypic frequencies of the test-ed variants between Han and other 11 HapMap populations (Table 2). There were 20, 20, 3, 16, 9, 21, 16, 27, 23 and 29 variants that differed in frequency in the Han population compared to the ASW, CEU, CHB, GIH, JPT, LWK, MEX, MKK, TSI and YRI populations, respectively. However, we didn’t find any polymorphism in Han differ-ent from CHD. The rs10936599 (TERC) and rs12615793 (ACYP2) showed the greatest nu- mber of significant differences between Han and the other 11 populations, while the rs2320615 (NAF1) has no significant genetic differences between Han and the 11 HapMap populations. The genotype counts of 45 loci in 11 HapMap populations listed in Table S2. We found two LD blocks for ACYP2 in the Han, Tibetan and Sherpa populations, while the block 1 (rs843752, rs10439478 and rs84- 3645) in the Han and Tibetan was different from the block 1 in the Sherpa population which included four loci (rs168211, rs843752, rs10- 439478 and rs843645). In addition, each pair of variants in the second block in the Han popu-lation had a stronger linkage than the Tibetan and Sherpa. We also found one LD block for MPHOSPH6 in the three populations, rs375- 1862 and rs11859599 was complete recombi-nation in the Han and was not linkage in the Sherpa population, whereas the pair of loci was partial linkage in the Tibetan (Figure 1).
Figure 1. Linkage disequilibrium analysis of the ACYP2/MPHOSPH6 in the Liantian Han, Tibetan and Sherpa. LD is displayed by standard color schemes with bright red for very strong LD (LOD > 2, D’ = 1), pink red (LOD > 2, D’ < 1) and blue (LOD < 2, D’ = 1) for partial linkage, and white (LOD < 2, D’ < 1) for complete recombina
-tion. A: LD blocks of ACYP2 in Liantian Han. B: LD blocks of ACYP2 in Tibetan. C: LD blocks of ACYP2 in Sherpa. D: LD blocks of MPHOSPH6 in Liantian Han. E: LD
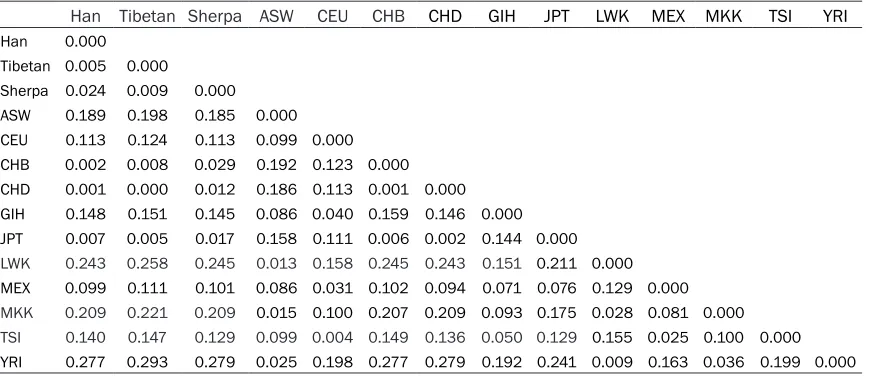
of differentiation was observed between the Han and CHD populations (FST = 0.001), fol-lowed by the CHB (FST = 0.002), whereas the greatest divergence was found in the YRI popu-lation (FST = 0.277). This finding was also sup-ported by Slatkin linearized FST and co-ances-try coefficients (Tables S3 and S4).
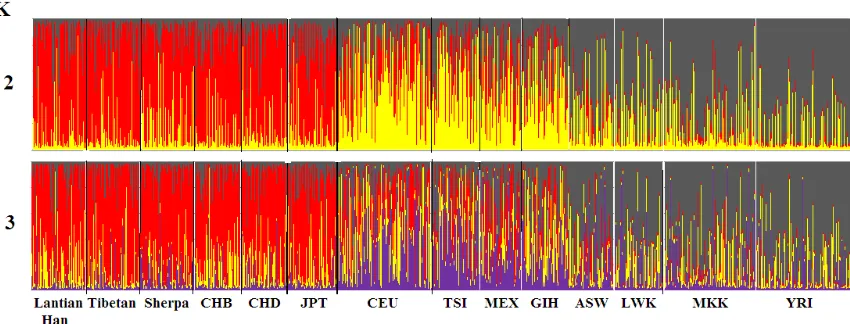
We used Bayesian-based Structure 2.3.4 that provided complementary methods for visualiz-ing patterns of genetic similarity and differenti-ation to analyze genetic structure difference between Han population and the other 13 pop-ulations in the current study. The results of cluster analysis indicated that the 45 selected variants could distinguish the 14 populations genetic structure when K = 2 or 3. From Figure 2, the bar graph revealed that the genetic struc-ture of Han population was near to cluster of CHB and CHD populations.
Discussion
In this study, we evaluated the polymorphic dis-tribution of 45 variants in telomere-length relat-ed genes in different populations. We found that the genotype frequencies of variants exhib-ited great variation among different popula-tions and there were 6, 20, 20, 20, 3, 0, 16, 9, 21, 16, 27, 23 and 29 variants that differed in frequency Han compared to the other popula-tions. Comprehensive analysis of all the results indicated that Han population exhibited closely
genetic affinity with the CHD and CHB but differ significantly from those in the YRI and MKK. We found some significantly different polymor-phisms among the 14 populations, rs10936- 599 (TERC), rs10069690, rs2853676 (TERT) and rs6010620, rs4809324 (RTEL1), as well as some others. These results suggested that genotype data from one group or subgroup should not be overly generalized and applied to genetically distinct groups.
[image:8.612.92.536.84.272.2]TERC is located on chromosome 3q26.2 that is an essential element of telomerase, serving as a template for telomere elongation [19]. Even moderate changes in TERC activity could pro-foundly affect telomere homeostasis [11]. The SNP (rs10936599) is one of the variants of the TERC. According to the analysis of data from 37669 European ancestry participants showed that the allele “T” of rs10936599 were associ-ated with the mean leukocyte telomere length. One study found that the effect of the T allele of this SNP to be equivalent to 3.91 years of age-related telomere attrition [11]. Our results showed that rs10936599 was significantly dif-ferent in the three groups, may cause the aver-age life is different. In addition, the SNP is sig-nificantly associated with colorectal cancer [20], high-grade glioma [21] and coronary heart disease risk [22]. Further studies to determine the mechanism of rs10936599 should be considered.
Table 3. Distribution of pairwise Fst distances among the among the 14 populations
Han Tibetan Sherpa ASW CEU CHB CHD GIH JPT LWK MEX MKK TSI YRI
Han 0.000 Tibetan 0.005 0.000
Sherpa 0.024 0.009 0.000 ASW 0.189 0.198 0.185 0.000 CEU 0.113 0.124 0.113 0.099 0.000 CHB 0.002 0.008 0.029 0.192 0.123 0.000
CHD 0.001 0.000 0.012 0.186 0.113 0.001 0.000 GIH 0.148 0.151 0.145 0.086 0.040 0.159 0.146 0.000 JPT 0.007 0.005 0.017 0.158 0.111 0.006 0.002 0.144 0.000
LWK 0.243 0.258 0.245 0.013 0.158 0.245 0.243 0.151 0.211 0.000 MEX 0.099 0.111 0.101 0.086 0.031 0.102 0.094 0.071 0.076 0.129 0.000
MKK 0.209 0.221 0.209 0.015 0.100 0.207 0.209 0.093 0.175 0.028 0.081 0.000 TSI 0.140 0.147 0.129 0.099 0.004 0.149 0.136 0.050 0.129 0.155 0.025 0.100 0.000 YRI 0.277 0.293 0.279 0.025 0.198 0.277 0.279 0.192 0.241 0.009 0.163 0.036 0.199 0.000
ASW: African ancestry in the southwestern USA; CEU: a northwestern European population; CHB: the Han Chinese in Beijing, China; CHD: a Chi
Recent study revealed that rs10069690 locat-ed in intron 4 of the TERT, which encodes the catalytic subunit of telomerase reverse tran-scriptase, a complex with an integral role in telomere maintenance [23], at chromosome 5p15 was not significantly correlated with breast cancer in the Chinese Henan Han wo- men [24]. The findings were inconsistent with other studies in European and African-American populations [25, 26]. Interestingly, previous research has shown that rs2853676 genotype “AG” was associated with an increased risk ofglioma in Xi’an [27] that was not inconsistent with Shanghai [28] and United States partici-pants [29]. The RTEL1 locates in 20q13.3, including 40 exons. It is an essential DNA heli-case thathas been shown to have critical roles in setting telomere length, maintaining telo-mere integrity and disassembling a variety of DNA secondary structures to facilitate 3R (rep-lication, repair, and recombination) processes in mice. Its loss is associated with shortened telomere length, chromosome breaks and translocations [30-32]. Previous report showed that rs6010620 (RTEL1) was significantly cor-related with the risk of glioma in the German cohort and Han Chinese population, but the French population [28, 33, 34]. Furthermore, rs4809324 (RTEL1) was significantly associat-ed with the risk of high grade glioma in the American, while itwas not correlated with the risk of glioma in Han Chinese [28, 34]. These phenomena also showed that the variationmay be lead to the occurrence of diseases are dif-ferent in distinct groups.
It should be mentioned that this is the first study to explore the polymorphic distribution of variants in the telomere-length related genes in the three China distinct ethnic groups and the other 11 HapMap populations to our knowl-edge. However, the sample size of the Han, Tibetan and Sherpa population in our study was relative small, and further investigation with larger cohort is necessary to determine the generalizability of our results and focus on determining the biological functions of these SNPs.
The present study is the first to present genetic polymorphisms in the telomere-length related genes of the Han people compare with the dis-tinct ethnic groups (Tibetan, Sherpa and other 11HapMap populations). We also compared these polymorphisms in the Tibetan with the Sherpa population. Results indicated that the Han people are most similar to CHD and six polymorphisms in the Tibetan differ from the Sherpa. The results also confirmed that there are important interethnic differences in the dis-tribution of telomere-length related genes vari-ants, which may be related to different efficacy on the telomere length related genes.
Acknowledgements
We are grateful to the all individuals for their participation in the study. We also thank the cli-nicians and hospital staff who contributed to sample and data collection for this study. Disclosure of conflict of interest
[image:9.612.95.520.75.237.2]None.
Figure 2. Comparison of genetic structure among 14 populations assessed by structure based on 45 telomere
length related SNPs. K = 2 and K = 3. K is the number of parental populations. Each individual is represented by a
Address correspondence to: Dr. Tianbo Jin, Key
La-boratory of Resource Biology and Biotechnology in Western China (Northwest University), Ministry of Education, School of Life Sciences, Northwest Uni- versity, Mailbox 386, 229 North Taibai Road, Xi’an 710069, Shaanxi, China. Tel: +86-29-33755247; E-mail: [email protected]
References
[1] de Lange T, Shiue L, Myers RM, Cox DR, Naylor SL, Killery AM and Varmus HE. Structure and
variability of human chromosome ends. Mol Cell Biol 1990; 10: 518-527.
[2] de Lange T. Shelterin: the protein complex that shapes and safeguards human telomeres. Genes Dev 2005; 19: 2100-2110.
[3] Blasco MA. Telomeres and human disease: ageing, cancer and beyond. NatRev Genet 2005; 6: 611-622.
[4] Hug N and Lingner J. Telomere length homeo-stasis. Chromosoma 2006; 115: 413-425. [5] Huffman KE, Levene SD, Tesmer VM, Shay JW
and Wright WE. Telomere shortening is propor-tional to the size of the G-rich telomeric 3’-over-hang. J Biol Chem 2000; 275: 19719-19722. [6] Allsopp RC, Vaziri H, Patterson C, Goldstein S,
Younglai EV, Futcher AB, Greider CW and Har -ley CB. Telomere length predicts replicative
capacity of human fibroblasts. Proc Natl Acad
Sci U S A 1992; 89: 10114-10118.
[7] Steffens JP, Masi S, D’Aiuto F and Spolidorio
LC. Telomere length and its relationship with chronic diseases-new perspectives for peri-odontal research. Arch Oral Biol 2013; 58: 111-117.
[8] Blackburn EH. Switching and signaling at the telomere. Cell 2001; 106: 661-673.
[9] Codd V, Mangino M, van der Harst P, Braund PS, Kaiser M, Beveridge AJ, Rafelt S, Moore J, Nelson C, Soranzo N, Zhai G, Valdes AM, Black
-burn H, Mateo Leach I, de Boer RA, Kimura M,
Aviv A; Wellcome Trust Case Control
Consor-tium, Goodall AH, Ouwehand W, van Veldhuis
-en DJ, van Gilst WH, Navis G, Burton PR, Tobin MD, Hall AS, Thompson JR, Spector T, Samani
NJ. Common variants near TERC are associat-ed with mean telomere length. Nat Genet 2010; 42: 197-199.
[10] Levy D, Neuhausen SL, Hunt SC, Kimura M,
Hwang SJ, Chen W, Bis JC, Fitzpatrick AL, Smith
E, Johnson AD, Gardner JP, Srinivasan SR,
Schork N, Rotter JI, Herbig U, Psaty BM,
Sas-trasinh M, Murray SS, Vasan RS, Province MA, Glazer NL, Lu X, Cao X, Kronmal R, Mangino M, Soranzo N, Spector TD, Berenson GS, Aviv A. Genome-wide association identifies OBFC1 as
a locus involved in human leukocyte telomere biology. Proc Natl Acad Sci U S A 2010; 107: 9293-9298.
[11] Codd V, Nelson CP, Albrecht E, Mangino M, Deelen J, Buxton JL, Hottenga JJ, Fischer K, Esko T, Surakka I, Broer L, Nyholt DR, Mateo Leach I, Salo P, Hagg S, Matthews MK, Palmen J, Norata GD, O’Reilly PF, Saleheen D, Amin N,
Balmforth AJ, Beekman M, de Boer RA, Böhringer S, Braund PS, Burton PR, de Craen
AJ, Denniff M, Dong Y, Douroudis K, Dubinina E, Eriksson JG, Garlaschelli K, Guo D, Harti
-kainen AL, Henders AK, Houwing-Duistermaat JJ, Kananen L, Karssen LC, Kettunen J, Klopp N, Lagou V, van Leeuwen EM, Madden PA, Mägi R, Magnusson PK, Männistö S, McCarthy
MI, Medland SE, Mihailov E, Montgomery GW, Oostra BA, Palotie A, Peters A, Pollard H, Pouta
A, Prokopenko I, Ripatti S, Salomaa V, Suchi
-man HE, Valdes AM, Verweij N, Viñuela A,
Wang X, Wichmann HE, Widen E, Willemsen G,
Wright MJ, Xia K, Xiao X, van Veldhuisen DJ, Catapano AL, Tobin MD, Hall AS, Blakemore AI, van Gilst WH, Zhu H; CARDIoGRAM consor
-tium, Erdmann J, Reilly MP, Kathiresan S, Sc -hunkert H, Talmud PJ, Pedersen NL, Perola M,
Ouwehand W, Kaprio J, Martin NG, van Duijn
CM, Hovatta I, Gieger C, Metspalu A, Boomsma
DI, Jarvelin MR, Slagboom PE, Thompson JR, Spector TD, van der Harst P, Samani NJ. Identi
-fication of seven loci affecting mean telomere
length and their association with disease. Nat Genet 2013; 45: 422-427, 427, e421-422. [12] He Y, Chen J, Zhang X, Li X, Du J, He X, Zhang Z,
Zhang Y, Kang L and Jin T. Telomere length re -lated gene ACYP2 polymorphism is associated with the risk of HAPE in Chinese Han popula-tion. J Gene Med 2016; 18: 244-249.
[13] Association between genetic polymorphism of telomere-associated gene ACYP2 and the risk of HAPE among the Chinese Han population. Medicine 2017; 96: e6504.
[14] Scherrer U, Rexhaj E, Jayet PY, Allemann Y and Sartori C. New insights in the pathogenesis of high-altitude pulmonary edema. Prog
Cardio-vasc Dis 2010; 52: 485-92.
[15] Buroker NE, Ning XH, Zhou ZN, Li K, Cen WJ,
Wu XF, Ge M, Fan LP, Zhu WZ, Portman MA and Chen SH. Genetic associations with mountain sickness in Han and Tibetan residents at the Qinghai-Tibetan Plateau. Clin Chim Acta 2010; 411: 1466-1473.
[16] Naeije R. High-altitude adaptation: where Ti-betans and Han Chinese agree. Exp Physiol 2014; 99: 1593-1594.
[17] Wu T and Kayser B. High altitude adaptation in
Tibetans. High Alt Med Biol 2006; 7: 193-208. [18] Sakamoto R, Matsubayashi K, Kimura Y, Ishine
geriatric assessment of elderly highlanders in Qinghai, China, III: oxidative stress and aging in Tibetan and Han elderly highlanders. Geriatr Gerontol Int 2009; 9: 352-358.
[19] Ueda Y, Calado RT, Norberg A, Kajigaya S, Roos
G, Hellstrom-Lindberg E and Young NS. A muta-tion in the H/ACA box of telomerase RNA com-ponent gene (TERC) in a young patient with myelodysplastic syndrome. BMC Med Genet 2014; 15: 68.
[20] Jones AM, Beggs AD, Carvajal-Carmona L, Far
-rington S, Tenesa A, Walker M, Howarth K, Ballereau S, Hodgson SV, Zauber A, Bertag
-nolli M, Midgley R, Campbell H, Kerr D, Dunlop
MG and Tomlinson IP. TERC polymorphisms are associated both with susceptibility to colorectal cancer and with longer telomeres. Gut 2012; 61: 248-254.
[21] Walsh KM, Codd V, Smirnov IV, Rice T, Decker PA, Hansen HM, Kollmeyer T, Kosel ML, Molin -aro AM, McCoy LS, Bracci PM, Cabriga BS, Pe-kmezci M, Zheng S, Wiemels JL, Pico AR, Tihan
T, Berger MS, Chang SM, Prados MD, Lachance DH, O’Neill BP, Sicotte H, Eckel-Passow JE; EN -GAGE Consortium Telomere Group, van der
Harst P, Wiencke JK, Samani NJ, Jenkins RB, Wrensch MR. Variants near TERT and TERC in
-fluencing telomere length are associated with
high-grade glioma risk. Nat Genet 2014; 46: 731-735.
[22] Ding H, Yan F, Zhou LL, Ji XH, Gu XN, Tang ZW
and Chen RH. Association between previously
identified loci affecting telomere length and coronary heart disease (CHD) in Han Chinese
population. Clin Interv Aging 2014; 9: 857-861.
[23] Gao L, Thakur A, Liang Y, Zhang S, Wang T, Chen T, Meng J, Wang L, Wu F, Jin T, Li X, Liu JJ, Chen C and Chen M. Polymorphisms in the TERT gene are associated with lung cancer risk in the Chinese Han population. Eur J Can-cer Prev 2014; 23: 497-501.
[24] He Y, Liu H, Chen Q, Sun X, Liu C and Shao Y.
Relationship between five GWAS-identified sin -gle nucleotide polymorphisms and female breast cancer in the Chinese Han population. Tumour Biol 2016; 37: 9739-44.
[25] Haiman CA, Chen GK, Vachon CM, Canzian F, Dunning A, Millikan RC, Wang X, Ademuyiwa F,
Ahmed S, Ambrosone CB, Baglietto L, Balleine
R, Bandera EV, Beckmann MW, Berg CD, Bern -stein L, Blomqvist C, Blot WJ, Brauch H, Buring JE, Carey LA, Carpenter JE, Chang-Claude J,
Chanock SJ, Chasman DI, Clarke CL, Cox A, Cross SS, Deming SL, Diasio RB, Dimopoulos AM, Driver WR, Dünnebier T, Durcan L, Eccles D, Edlund CK, Ekici AB, Fasching PA, Feigelson HS, Flesch-Janys D, Fostira F, Försti A, Fountzi -las G, Gerty SM; Gene Environment Interaction and Breast Cancer in Germany (GENICA)
Con-sortium, Giles GG, Godwin AK, Goodfellow P, Graham N, Greco D, Hamann U, Hankinson SE,
Hartmann A, Hein R, Heinz J, Holbrook A,
Hoover RN, Hu JJ, Hunter DJ, Ingles SA, Irwanto A, Ivanovich J, John EM, Johnson N, JukkolaVu
-orinen A, Kaaks R, Ko YD, Kolonel LN, Konstan
-topoulou I, Kosma VM, Kulkarni S, Lambrechts D, Lee AM, Marchand LL, Lesnick T, Liu J, Lind -strom S, Mannermaa A, Margolin S, Martin NG, Miron P, Montgomery GW, Nevanlinna H, Nick-els S, Nyante S, Olswold C, Palmer J,Pathak H,
Pectasides D, Perou CM, Peto J, Pharoah PD, Pooler LC, Press MF, Pylkäs K, Rebbeck TR, Rodriguez-Gil JL, Rosenberg L, Ross E, Rüdiger T, Silva Idos S, Sawyer E, Schmidt MK,
Schulz-Wendtland R, Schumacher F, Severi G, Sheng
X, Signorello LB, Sinn HP, Stevens KN, Southey
MC, Tapper WJ, Tomlinson I, Hogervorst FB, Wauters E, Weaver J, Wildiers H, Winqvist R,
Van Den Berg D, Wan P, Xia LY, Yannoukakos D,
Zheng W, Ziegler RG, Siddiq A, Slager SL,
Stram DO, Easton D, Kraft P, Henderson BE,
Couch FJ. A common variant at the TERT-CLPT-M1L locus is associated with estrogen recep-tor-negative breast cancer. Nat Genet 2011; 43: 1210-1214.
[26] Palmer JR, Ruiz-Narvaez EA, Rotimi CN, Cup-ples LA, Cozier YC, Adams-Campbell LL and Rosenberg L. Genetic susceptibility loci for subtypes of breast cancer in an African Ameri-can population. Cancer Epidemiol Biomarkers Prev 2013; 22: 127-134.
[27] Li G, Jin TB, Wei XB, He SM, Liang HJ, Yang HX,
Cui Y, Chen C, Cai LB and Gao GD. Selected
polymorphisms of GSTP1 and TERT were as-sociated with glioma risk in Han Chinese. Can-cer Epidemiol 2012; 36: 525-527.
[28] Chen H, Chen Y, Zhao Y, Fan W, Zhou K, Liu Y, Zhou L, Mao Y, Wei Q, Xu J and Lu D. Associa -tion of sequence variants on chromosomes 20, 11, and 5 (20q13.33, 11q23.3, and 5p15.33) with glioma susceptibility in a Chi-nese population. Am J Epidemiol 2011; 173: 915-922.
[29] Egan KM, Thompson RC, Nabors LB, Olson JJ, Brat DJ, Larocca RV, Brem S, Moots PL, Mad -den MH, Browning JE and Ann Chen Y. Cancer susceptibility variants and the risk of adult gli-oma in a US case-control study. J Neurooncol 2011; 104: 535-542.
[30] Vannier JB, Sarek G and Boulton SJ. RTEL1:
functions of a disease-associated helicase. Trends Cell Biol 2014; 24: 416-425.
[31] Barber LJ, Youds JL, Ward JD, McIlwraith MJ,
[32] Ding H, Schertzer M, Wu X, Gertsenstein M, Selig S, Kammori M, Pourvali R, Poon S, Vulto I,
Chavez E, Tam PP, Nagy A and Lansdorp PM. Regulation of murine telomere length by Rtel: an essential gene encoding a helicase-like pro-tein. Cell 2004; 117: 873-886.
[33] Simon M, Hosking FJ, Marie Y, Gousias K, Bois
-selier B, Carpentier C, Schramm J, Mokhtari K, Hoang-Xuan K, Idbaih A, Delattre JY, Lathrop
M, Robertson LB, Houlston RS, Sanson M.
Ge-netic risk profiles identify different molecular
etiologies for glioma. Clin Cancer Res 2010; 16: 5252-5259.
[34] Li G, Jin T, Liang H, Zhang Z, He S, Tu Y, Yang H, Geng T, Cui G, Chen C and Gao G. RTEL1 tag-ging SNPs and haplotypes were associated
Table S1. The PCR primers of loci used in this study
SNP-ID Genes 2nd-PCRP 1st-PCRP UEP-SEQ
rs6713088 ACYP2 ACGTTGGATGGTCACCAAAACACGTAATG ACGTTGGATGACACACACAGACTCCTTCAC gaggcCAGAATGGTCCACTAGAGA rs12621038 ACYP2 ACGTTGGATGGGCATAAGTTTTATTGCCTC ACGTTGGATGATTGTGCTAGGCACTTTAGG ccATTGCCTCAGCTAGACT rs1682111 ACYP2 ACGTTGGATGGCCAGTGGGAATGCAAAATG ACGTTGGATGGAATTGCTGGGTTATTTGGC tgtcATGCAAAATGAAACAGACACTT rs843752 ACYP2 ACGTTGGATGGAGACAACATAATGGAGGTC ACGTTGGATGTCCTCTTTTCAGAAACCTGC cGAGTTTGGGTTTGAGGT rs10439478 ACYP2 ACGTTGGATGCTACACTCTCCAGAGGAATG ACGTTGGATGTAGCACAAGACCTACACTGG TTGCTGTTTTCCCAGAA rs843645 ACYP2 ACGTTGGATGACAGTGCCTTTAGCAAGGTG ACGTTGGATGGAAATCTGAATACCACCTAC TCATAGGCACTACTGTATC rs11125529 ACYP2 ACGTTGGATGCCGAAGAAAAGAAGATGAC ACGTTGGATGGAGCTTAGTTGTTTACAGATG AGAAAAGAAGATGACTAAAACAT rs12615793 ACYP2 ACGTTGGATGATCTTGGCCCTTGAAGAA ACGTTGGATGTTTGAGCTTAGTTGTTTAC AAATTGAGTGACAAATATAAACTAC rs843711 ACYP2 ACGTTGGATGTGCCTTGTGGGAATTAGAGC ACGTTGGATGGACAAAGGACCTTACAACTC gggaTCAGGGAACCAGTGCAAA rs11896604 ACYP2 ACGTTGGATGTGTCTCTGACCTAGCATGTA ACGTTGGATGAAGTCAGAATAGTGCTTAC GTTAAGCTTGCAAGGAG rs843706 ACYP2 ACGTTGGATGTGAATAACTTGGTCTTATC ACGTTGGATGTGAAAGCCATAAATATTTTG cACTTGGTCTTATCTGATGC rs17045754 ACYP2 ACGTTGGATGGAAATCAGGGATATTAGTGC ACGTTGGATGCTGTAAAAGTTCTGGCATGG caggTATTCAGCTTCCTAGAGTTA rs843720 ACYP2 ACGTTGGATGAGTCAGAGCTAGACCTCTGG ACGTTGGATGCTTCACAACACTCCTGTAAG ccccAATCTGTCTCAGGGTCTT rs1056675 MPHOSPH6 ACGTTGGATGGTCAAGCCAATTCGTACATAC ACGTTGGATGAATACTTAAGGCTGGAGAGG ggtgCGTACATACAATTTGGAATCAA rs1056654 MPHOSPH6 ACGTTGGATGCAGTCACTGACCTTGAATTG ACGTTGGATGGTATGTACGAATTGGCTTGAC ACCTTGAATTGACTTACATAAA rs1056629 MPHOSPH6 ACGTTGGATGGGTCAGTGACTGGAGAACTA ACGTTGGATGTTTTTAGCCCCTGATCTAC cGGAAGCAGCCCTGTAACAA rs3751862 MPHOSPH6 ACGTTGGATGCATCTGTTTCAAAAACAGC ACGTTGGATGTGGTGTCTCTATAGTTATT TGTTTCTAAAATGATAATCTCTTTACA rs11859599 MPHOSPH6 ACGTTGGATGCCCAGGAATGCTCCTCTTAC ACGTTGGATGTAAGAGAAGGCCGATCACAG CCTCTTACCCCACAGT
rs2967361 MPHOSPH6 ACGTTGGATGAGCTGTACCCTGACTGCTTC ACGTTGGATGTTACTGGGAACCAGCTTACG tCCTGACTGCTTCTGTGTAC rs3792792 NAF1 ACGTTGGATGATGGCAGCTGTTACGGCCAC ACGTTGGATGCTCAGATCAGTTCACTCCTC ccctTTACGGCCACCACCAAGCATG rs4958881 NAF1 ACGTTGGATGTGCAATTCCACCCAAGGATG ACGTTGGATGCACAAATATGTGGACAGTTT GGATGAAAGGAAGTGAGA rs7708392 NAF1 ACGTTGGATGGGGTCTCTTCTGGAACTTAG ACGTTGGATGAGGCCAACTGGTCAATTCTC ggggaTGGAACTTAGTAGACTAGTCA rs10036748 NAF1 ACGTTGGATGCTTTCATAGCATGATACACG ACGTTGGATGGCAAAGCAGCCCCTTTTTTC ACGTATGAGAAAAATAAAATAGTAA rs960709 NAF1 ACGTTGGATGTAAGCCAGAGCTGGAGCTCA ACGTTGGATGTATGGGTCTTTTCAGCTCGG atAGTTCCGTCCAGGGC rs2320615 NAF1 ACGTTGGATGAGGCAGAGACATTCCATTTG ACGTTGGATGACCAATTTAACAAGACAGC CCATTTGAAAAGAAATAATTCTACT rs9420907 OBFC1 ACGTTGGATGTAGCACAGTAAACATGTGGC ACGTTGGATGACAAGTATAGTTTGGGGTGG TTTGTGAATTATTACACAGCTA rs9325507 OBFC1 ACGTTGGATGATAAGGCGCAGTTATCACCG ACGTTGGATGGCCTGGCAGACATAGTTATC cctaACCGCTCATAGTGATCC rs3814220 OBFC1 ACGTTGGATGAAGGACTGTGTTGGAACCTG ACGTTGGATGTGCTTGGCTTTTCATGAGGG ACCCCGCTTCATAATGT rs12765878 OBFC1 ACGTTGGATGCCACAAAATATCTAGCTTGGG ACGTTGGATGACATTGCCTTGTACAACTCC AGCTTGGGCTCTTGA rs11191865 OBFC1 ACGTTGGATGGGATTCTTTGGGTCTCCAAG ACGTTGGATGCTTCTCCCCATCTGAAAGTG cccaaAGATCCTAGCATATACCACT rs6089953 RTEL1 ACGTTGGATGGCGTCTGTCATAAAAAGGGC ACGTTGGATGCCCTTCAAAGGACGATCGTT ggGTTCCAGGTGGGGTC rs6010620 RTEL1 ACGTTGGATGCTCTCAACATCTCAGCAACC ACGTTGGATGGCCTGTTTTCCCTTTTTGAG CAGATCATGCAAAGCAGG rs6010621 RTEL1 ACGTTGGATGAGCACGAGAACAGCACCGAG ACGTTGGATGACCCCATCCCTCCCCTCTGA ACAGCACCGAGGAAAAG rs4809324 RTEL1 ACGTTGGATGGAGAAGTCAAGTGACATCAG ACGTTGGATGAGCCGGTGCACAGATTCCAA gTCAGAGGTCAATGGAACA rs2297441 RTEL1 ACGTTGGATGGTGTCCACTTTTAATCAGGG ACGTTGGATGCTCAACTCCCACCACCAAG GACAGGGCTCTCTAATAAA rs10936599 TERC ACGTTGGATGCAAGGGTAAAATTCCATTCTG ACGTTGGATGTTCCCGCTGTTTGTTCAGTC ATGCAGTATTCGCACCA rs10069690 TERT ACGTTGGATGATGTGTGTTGCACACGGGAT ACGTTGGATGCCTGTGGCTGCGGTGGCTG GGGATCCTCATGCCA rs2242652 TERT ACGTTGGATGAGGCTCTGAGGACCACAAGA ACGTTGGATGACAGCAGGACACGGATCCAG gtcgGAGGACCACAAGAAGCAGC rs2853677 TERT ACGTTGGATGGCAAGTGGAGAATCAGAGTG ACGTTGGATGATCCAGTCTGACAGTCGTTG gggtAATCAGAGTGCACCAG rs2853676 TERT ACGTTGGATGCAAAACTAAGACCCAAGAGG ACGTTGGATGTGTCTCCTGCTCTGAGACC agatGGAAGTCTGACGAAGGC rs8105767 ZNF208 ACGTTGGATGTAGTAGGCAGGGCCAGGCCA ACGTTGGATGCTGCCCATATGGGCCATTTT aAGTTACATCACCTGGGTATC rs2188972 ZNF208 ACGTTGGATGATTCAGAACCTGTGCAAAGC ACGTTGGATGGGCTTGATTGGTCAAATGGC GACTTCTCAAAGAACTAGAAA rs2188971 ZNF208 ACGTTGGATGCACTAAATCAGACTGCTGAG ACGTTGGATGCTCTTCAAAGATCTACTTC TCCAAAACTAAAGTTGGCAAAA rs8103163 ZNF208 ACGTTGGATGTTTTGGGCCAAAAACTTTG ACGTTGGATGCCAGAAGATCTGAGATAAAG cctGCCAAAAACTTTGGCATACT rs7248488 ZNF208 ACGTTGGATGGCAGAGTGTTTTCCTGGTTG ACGTTGGATGGTTCTCCAGGAACACTTATG GTCATGATGAGAAGGGT
Table S2. The genotype count of 45 loci in HapMap 11 populations
SNP-ID ASW CEU CHB CHD GIH JPT LWK MEX MKK TSI YRI
AA AB BB AA AB BB AA AB BB AA AB BB AA AB BB AA AB BB AA AB BB AA AB BB AA AB BB AA AB BB AA AB BB rs6713088 – – – 18 25 17 12 21 12 – – – – – – 20 21 3 – – – – – – – – – – – – 17 30 13 rs12621038 42 11 0 69 41 3 26 36 22 26 42 17 65 21 2 27 49 10 81 9 0 32 14 4 113 28 2 55 29 4 101 10 2 rs1682111 – – – 13 26 21 5 17 23 – – – – – – 10 19 15 – – – – – – – – – – – – 13 30 17 rs843752 – – – 27 32 1 23 17 5 – – – – – – 22 19 3 – – – – – – – – – – – – 13 35 12 rs10439478 – – – 31 21 5 16 21 8 – – – – – – 18 24 2 – – – – – – – – – – – – 39 19 2 rs843645 31 20 2 76 35 2 52 25 7 45 32 7 18 49 20 53 31 2 72 17 1 36 13 1 111 30 2 59 24 5 88 24 1 rs11125529 41 11 1 76 34 3 51 28 4 60 24 1 74 14 0 64 20 2 58 31 1 40 10 0 109 32 2 71 16 1 77 33 3 rs12615793 45 5 1 76 34 3 51 29 4 52 31 1 74 14 0 63 20 2 64 25 1 39 10 0 120 21 2 71 16 1 88 23 1 rs843711 19 18 16 35 55 23 27 34 23 27 38 20 15 39 34 32 42 12 34 40 16 26 22 2 61 58 24 36 42 10 50 51 12 rs11896604 40 11 1 75 34 3 48 28 5 55 28 1 49 33 5 61 20 3 57 32 1 40 10 0 106 35 2 71 16 1 74 36 3 rs843706 16 23 14 35 56 22 27 34 23 26 38 20 15 39 34 32 42 12 31 36 23 26 22 2 57 68 18 37 42 9 38 61 14 rs17045754 – – – 44 13 2 31 12 2 – – – – – – 32 13 0 – – – – – – – – – – – – 39 20 1 rs843720 6 31 16 39 47 27 37 36 11 37 42 6 31 38 19 32 36 18 4 29 55 12 17 21 23 71 48 17 50 21 16 53 44 rs1056675 – – – 11 25 24 20 17 7 – – – – – – 17 21 7 – – – – – – – – – – – – 51 8 0 rs1056654 44 8 0 87 22 2 41 32 9 32 45 6 52 29 7 37 32 14 79 10 0 21 21 5 102 39 2 64 19 2 98 13 0 rs1056629 45 8 0 89 22 2 43 31 8 35 45 5 52 29 7 39 33 12 79 11 0 22 21 6 102 39 2 67 19 2 100 13 0 rs3751862 35 14 4 109 4 0 76 7 1 76 9 0 76 12 0 63 21 2 58 27 4 46 4 0 84 58 1 86 2 0 50 48 14 rs11859599 – – – 5 21 34 4 18 23 – – – – – – 0 13 32 – – – – – – – – – – – – 0 11 49 rs2967361 20 20 13 9 46 55 9 23 52 4 30 51 9 44 35 5 36 45 29 46 15 4 20 26 33 79 30 4 40 44 44 54 15
rs3792792 – – – 58 2 0 40 5 0 – – – – – – 36 8 0 – – – – – – – – – – – – 46 14 0
rs4958881 17 26 10 97 15 1 73 11 0 76 9 0 79 9 0 69 17 0 16 51 23 35 15 0 46 68 29 68 19 1 27 54 32
rs7708392 – – – 39 17 4 6 17 22 – – – – – – 7 17 21 – – – – – – – – – – – – – – –
rs2297441 0 8 45 6 44 63 35 40 9 35 44 6 2 26 60 33 40 13 0 4 86 5 12 32 0 14 128 5 22 61 0 1 112 rs10936599 45 7 1 60 45 8 11 47 26 18 41 26 55 30 3 7 41 38 74 16 0 19 28 3 116 26 1 57 28 3 111 2 0 rs10069690 9 27 17 52 54 7 52 31 1 59 24 2 33 47 8 53 29 4 12 45 33 31 16 3 27 70 46 53 28 7 13 56 44
rs2242652 – – – 42 18 0 27 18 0 – – – – – – 27 15 2 – – – – – – – – – – – – – – –
rs2853677 8 22 23 19 57 37 11 43 30 12 34 39 30 48 10 6 33 47 7 42 41 4 21 25 31 74 38 16 39 33 5 40 68 rs2853676 5 11 37 11 41 58 2 21 61 1 19 65 10 41 37 5 20 60 4 33 52 0 17 33 18 80 45 11 32 43 4 38 71 rs8105767 11 29 13 53 53 6 48 32 4 37 40 8 29 50 9 41 40 5 17 44 29 24 22 4 44 72 27 49 30 9 27 50 36 rs2188972 39 12 2 30 68 15 10 47 27 19 47 19 63 22 3 21 51 14 73 14 3 17 24 8 113 30 0 29 42 17 92 20 1 rs2188971 11 29 13 12 66 35 4 29 50 10 35 40 45 30 13 8 42 34 9 36 44 6 24 19 11 67 63 16 47 25 13 40 58
rs8103163 – – – 0 14 31 0 20 16 – – – – – – 0 23 31 – – – – – – – – – – – – – – –
rs7248488 – – – 7 34 19 2 31 47 – – – – – – 5 23 16 – – – – – – – – – – – – 7 15 35
ASW (n = 53); CEU (n = 133); CHB (n = 84); CHD (n = 85); GIH (n = 88); JPT (n = 86); LWK (n = 90); MEX (n = 50); MKK (n = 143); TSI (n = 88); YRI (n = 113); ASW: African ancestry in the southwestern; USA; CEU: anorthwestern European population; CHB: the Han Chinese in Beijing, China; CHD: a Chinese population of metropolitan Denver, Colorado, USA; GIH: the Gujarati Indians in Houston, Texas, USA; JPT: the Japanese population in Tokyo, Japan; LWK: the Luhya people in Webuye, Kenya; MEX: people of Mexican ancestry living in Los Angeles, California, USA; MKK: the Maasai people in Kinyawa, Kenya; TSI: the
Table S3. Estimates of coancestry coefficients among the 14 populations
Han Tibetan Sherpa ASW CEU CHB CHD GIH JPT LWK MEX MKK TSI YRI
Han 0.000 Tibetan 0.005 0.000
Sherpa 0.024 0.010 0.000 ASW 0.209 0.220 0.204 0.000 CEU 0.120 0.132 0.120 0.104 0.000 CHB 0.000 0.008 0.029 0.213 0.131 0.000
CHD 0.000 0.000 0.013 0.205 0.120 0.001 0.000 GIH 0.160 0.164 0.156 0.089 0.040 0.174 0.157 0.000 JPT 0.007 0.005 0.017 0.173 0.117 0.006 0.002 0.156 0.000
LWK 0.278 0.298 0.281 0.014 0.171 0.281 0.279 0.164 0.237 0.000 MEX 0.104 0.118 0.107 0.090 0.032 0.107 0.099 0.074 0.079 0.138 0.000
MKK 0.235 0.249 0.234 0.016 0.106 0.232 0.235 0.098 0.192 0.029 0.084 0.000 TSI 0.150 0.159 0.138 0.104 0.004 0.162 0.146 0.052 0.139 0.168 0.025 0.105 0.000 YRI 0.324 0.346 0.327 0.025 0.221 0.325 0.327 0.214 0.275 0.009 0.178 0.037 0.222 0.000
ASW: African ancestry in the southwestern USA; CEU: a northwestern European population; CHB: the Han Chinese in Beijing, China; CHD: a Chi
-nese population of metropolitan Denver, Colorado, USA; GIH: the Gujarati Indians in Houston, Texas, USA; JPT: the Japa-nese population in Tokyo, Japan; LWK: the Luhya people in Webuye, Kenya; MEX: people of Mexican ancestry living in Los Angeles, California, USA; MKK: the Maasai people in Kinyawa, Kenya; TSI: the Tuscan people of Italy; YRI: the Yoruba in Ibadan, Nigeria.
Table S4. Estimates of Slatkin linearized FSTs among the 14 populations
Han Tibetan Sherpa ASW CEU CHB CHD GIH JPT LWK MEX MKK TSI YRI
Han 0.000 Tibetan 0.005 0.000 Sherpa 0.024 0.010 0.000 ASW 0.232 0.247 0.226 0.000 CEU 0.128 0.141 0.127 0.110 0.000 CHB 0.000 0.008 0.029 0.237 0.140 0.000
CHD 0.000 0.000 0.013 0.228 0.128 0.001 0.000 GIH 0.173 0.178 0.169 0.094 0.041 0.190 0.170 0.000 JPT 0.007 0.005 0.017 0.188 0.124 0.006 0.002 0.168 0.000
LWK 0.320 0.348 0.325 0.014 0.187 0.324 0.321 0.178 0.268 0.000 MEX 0.110 0.125 0.113 0.094 0.032 0.113 0.104 0.076 0.082 0.148 0.000
MKK 0.265 0.283 0.264 0.016 0.112 0.261 0.265 0.103 0.212 0.029 0.088 0.000 TSI 0.162 0.172 0.148 0.110 0.004 0.176 0.157 0.053 0.149 0.183 0.025 0.111 0.000 YRI 0.383 0.414 0.387 0.025 0.247 0.384 0.386 0.238 0.317 0.009 0.195 0.038 0.249 0.000
ASW: African ancestry in the southwestern USA; CEU: a northwestern European population; CHB: the Han Chinese in Beijing, China; CHD: a Chi
[image:16.612.92.532.341.531.2]