A portable image-based cytometer for rapid
malaria detection and quantification
Dahou Yang1☯
, Gowtham Subramanian1☯
, Jinming Duan2, Shaobing Gao3, Li Bai2, Rajesh Chandramohanadas1*, Ye Ai1*
1 Pillar of Engineering Product Development, Singapore University of Technology and Design, Singapore,
Singapore, 2 School of Computer Science, University of Nottingham, Nottingham, United Kingdom, 3 School of Life Science and Technology, University of Electronic Science and Technology of China, Chengdu, China
☯These authors contributed equally to this work. *[email protected](RC);[email protected](YA)
Abstract
Increasing resistance by malaria parasites to currently used antimalarials across the devel-oping world warrants timely detection and classification so that appropriate drug combina-tions can be administered before clinical complicacombina-tions arise. However, this is often challenged by low levels of infection (referred to as parasitemia) and presence of predomi-nantly young parasitic forms in the patients’ peripheral blood. Herein, we developed a sim-ple, inexpensive and portable image-based cytometer that detects and numerically counts Plasmodium falciparum infected red blood cells (iRBCs) from Giemsa-stained smears derived from infected blood. Our cytometer is able to classify all parasitic subpopulations by quantifying the area occupied by the parasites within iRBCs, with high specificity, sensitivity and negligible false positives (~ 0.0025%). Moreover, we demonstrate the application of our image-based cytometer in testing anti-malarial efficacy against a commercial flow cytometer and demonstrate comparable results between the two methods. Collectively, these results highlight the possibility to use our image-based cytometer as a cheap, rapid and accurate alternative for antimalarial testing without compromising on efficiency and minimal process-ing time. With appropriate filters applied into the algorithm, to rule out leukocytes and reticu-locytes, our cytometer may also be used for field diagnosis of malaria.
Introduction
Malaria, one of the most devastating infectious diseases around the globe, is caused by proto-zoan parasites of the genusPlasmodium. There are five major species of plasmodia that infect humans, out of whichPlasmodium (P.) falciparumcauses the majority of morbidity and mor-tality in Africa followed by less lethalP.vivaxinfections across South-East Asia, altogether infecting 200 million people and resulting in over half a million deaths every year [1]. Cur-rently used antimalarials include chloroquine, artemisinin sulfadoxine-pyrimethamine combi-nation, atovaquone and clindamycin. However, parasites have acquired resistance to most of the above-mentioned drugs both in Africa and South-East Asia, rendering them inefficient for future usage [2–4].
a1111111111 a1111111111 a1111111111 a1111111111 a1111111111 OPEN ACCESS
Citation: Yang D, Subramanian G, Duan J, Gao S,
Bai L, Chandramohanadas R, et al. (2017) A portable image-based cytometer for rapid malaria detection and quantification. PLoS ONE 12(6): e0179161.https://doi.org/10.1371/journal. pone.0179161
Editor: Georges Snounou, Universite´ Pierre et
Marie Curie, FRANCE
Received: March 1, 2017
Accepted: May 24, 2017
Published: June 8, 2017
Copyright:©2017 Yang et al. This is an open access article distributed under the terms of the
Creative Commons Attribution License, which permits unrestricted use, distribution, and reproduction in any medium, provided the original author and source are credited.
Data Availability Statement: All relevant data are
within the paper and its Supporting Information files.
Funding: DY and GS gratefully acknowledge the
President’s Graduate Fellowship awarded by the Ministry of Education (MOE), Singapore. YA and RC gratefully acknowledge the support provided by SUTD-MIT International Design Centre
(IDG11300101). RC also acknowledges A
Early diagnosis and treatment are required to avoid anemia, organ failure [5] and malaria-associated deaths [6]. Lack of reliable methods and tools in the field settings provide tremen-dous impedance to early diagnosis in malaria endemic areas such as sub-Saharan Africa. Tra-ditional and widely practised method of malaria diagnosis relies on observable clinical symptoms associated, which are results of general host response to an infection. Undoubtedly, this method foists on several challenges due to the nonspecific nature of the symptoms that could be potentially caused due to other immune challenges, which could ultimately result in inappropriate and unnecessary exploitation of antimalarials [7,8]. Rapid Diagnostic Tests (RDTs) used in clinics measure the presence of parasitic antigens such as aldolase or lactate dehydrogenase [9,10]. However, these methods rely on detection of antigens derived from the parasites, rather than detecting the parasites themselves. Though RDTs are often able to differ-entiate most malarial species by means of their antigenic properties, overall sensitivity of detec-tion is far below the threshold of microscopy-based malaria detecdetec-tion, exhibiting huge
variations among the patients [11–15] and failing to guide treatments which could be fatal when mixed infections occur [16]. These are efficient methods; however the results can vary depending on the severity of infection and the high occurrence of young parasitic forms (ring-stage infections) in the peripheral blood, which are only beginning to establish metabolic pro-cesses. Due to the recent advancements in technology, several malaria diagnostic techniques such as microarray [17], PCR [18], loop-mediated isothermal amplification (LAMP) [19], flow cytometry [20], hemozoin detection using automated hematology analyser [21] have been developed for efficient malaria diagnosis. Diagnostic methods leveraging PCR, 18s-rRNA detection [22], mitochondrial cytochrome b activity [23,24],PgMt19 andPfMT869 mitochon-drial regions [25], and thePvr47andPfr364genes [26,27], have been used for detecting Plas-modiumspecies. However, quantitative amplification of genes demands careful processing of blood to remove the inhibitors of amplification and thermal cycling, making it a cumbersome procedure. Notably, all of these methods demand expensive laboratory facilities and highly trained personnel to conduct complicated analytical procedures and data analyses, which may not be feasible in resource-poor malaria endemic countries.
The current gold standard technique for detecting malaria is microscopic examination of Giemsa-stained thin and thick blood smears [28] both in the field as well as in laboratory. This method allows detection of densely stained parasites against a background of lightly stained RBCs and widely accepted owing to cost effectiveness, simplicity and rapidity. Though, this method detects parasitemia levels of up to 1 infected cell in 106cells [29], the microscopic examination requiring traditional bulky microscope is laborious and often fails when the para-sitemia is low, a situation very common in the case ofP.vivaxinfections. In addition, logistic issues and challenges associated with transporting the traditional bulky microscopes to remote and rural malaria endemic regions [30] and fulfilling operational and maintenance require-ments could be challenging. Furthermore, manual counting from Giemsa-smears is known to vary depending on the personnel engaged and quality of smears involving a high chance of misinterpreting other microorganisms such as bacteria and fungi asPlasmodiumparasites and difficulties associated with identifying differentPlasmodiumstrains [31]. Previously, several laboratories explored image processing based automated cell counting for parasitemia estima-tion, but most of them suffered from high false positive values [32–34], inferior accuracy [35], inability to differentiate parasitic stages [36] primarily rings [37] and the requirement of fluo-rescent dyes [38,39].
To address these problems, we have developed a low-cost, portable image-based cytometer capable of detecting parasitic infections at levels as low as 0.2%. Additionally, our system allows reliable classification of all parasitic life stages at different magnifications. Finally, we demonstrate that the newly developed image-based cytometer can be adopted for antimalarial the Singapore Ministry of Education Academic
Research Fund Tier 2 (T2MOE1603).
Competing interests: The authors have declared
screening with high accuracy and efficiency and thus can be routinely exploited as a powerful alternative to expensive, technically demanding procedures such as traditional flow cytometry.
Materials and methods
Blood collection and parasite culture
Blood used in this project was purchased from Interstate Blood Bank. Before culturing malaria parasites, blood was transferred to EDTA Tubes (VACUETTE1EDTA Tubes, Greiner Bio-One), washed three times in RPMI 1640 (Sigma-Aldrich) by centrifuging at 600g for 10 min-utes to remove the buffy coat. RBCs were stored at 50% hematocrit in malaria culture medium (MCM), which is RPMI supplemented with bovine serum (Albumax II, Gibco-Singapore), 2.5μg/mL gentamycin and hypoxanthine. Standard laboratory strains ofP.falciparum, 3D7, were used in all experiments. Parasites were cultured in human O+erythrocytes at 2.5% hae-matocrit in MCM under standard conditions [40]. Parasites were synchronized by magnetic selection at late stages (46–48 h) with the help of a SuperMACS magnet (Miltenyi Biotech, Ber-gisch Gladbach, Germany) and introduced into fresh RBCs, followed by sorbitol synchroniza-tion three hours later to allow a tight window of invasion [41].
Growth inhibition assays and parasitemia determination by flow
cytometry and microscopic examination
Parasites at trophozoite stage (24–26 hpi) were treated with a range of concentrations of anti-malarial drugs at 2% parasitemia and 2.5% hematocrit. Samples were cultured for 50–52 h until the trophozoites (28–30 hpi) appeared in the next replication cycle and then harvested for further analysis.
Flow cytometry was performed on Accuri C6 flow cytometer (Becton, Dickinson, CA. USA). At least 100,000 RBCs were analysed for each sample to determine parasitemia. To do this, 50μl aliquots were collected from each sample and fixed with 0.1% glutaraldehyde (Sigma-Aldrich) at 4˚C overnight. Fixed cells were collected by centrifuging at 400 g for 3 min, washed in PBS, permeabilized using 0.25% Triton X-100/PBS (Sigma-Aldrich) for 10 min at room temperature and washed again. Further, samples were incubated with 25μg/ml Hoechst 33342 (Thermo Fisher) for 30 min in dark, and then parasitemia was scored by flow cytometry as reported elsewhere [42]. Data analysis and statistics were performed using GraphPad Prism (GraphPad Software) in accordance with the recommended protocol for nonlinear regression of a log-(inhibitor)-versus-response curve.
Thin smears for microscopic examination were prepared on glass slides and fixed with 100% methanol (Merck). The smears were stained with freshly prepared, filtered 1 in 10 dilu-tion of Giemsa (Sigma-Aldrich) soludilu-tion in de-ionised water for 10 min. Parasites were observed under an oil immersion lens (100X) using an optical microscope (Leica) for standard experiments.
Design of in-house image-based cytometer and image acquisition
(ToupTek, Hangzhou, China) by manually translating the smear slide on the stage. Only fields containing obvious debris were discarded. A 20X objective was used to capture large fields for imaging at high-throughput. However, the use of 20X objective is not sufficient to identify ring stage, in this case, a 100X oil immersion objective was utilized for ring forms imaging and parasitemia analysis.
Image analysis algorithm
We used image processing and machine learning algorithms to analyse the smear images cap-tured by the developed image-based cytometer. The image analysis algorithm can be divided into three key steps. First, a pre-processing total generalized variation (TGV) denoising method was used to remove the unavoidable noise in the original images. Second, an efficient and robust local adaptive thresholding approach was used to segment the smoothed image with possible intensity inhomogeneity. Finally, a machine learning method was performed to prevent false detections in the case when the image does not contain any parasites. Details of each step will be discussed in the following.
The denoising of the original image was implemented by the TGV method [43], which is a powerful image pre-processing tool that has been extensively used in image processing com-munity [44–46]. The TGV regularisation has the capability of representing image characteris-tics up to an arbitrary order of differentiation (piecewise constant, piecewise affine, piecewise quadratic etc.). The TGV model is of the following form
Eðu;pÞ ¼ 1 2l
Z
O
ðu fÞ2þ
Z
O
jru pj þa
Z
O
jεðpÞj ð1Þ
whereE(u,p) means the energy functional with respect to two variablesuandp,uis the denoised/smoothed image,p= (p1,p2) is a symmetrised gradient vector which is closely related toru¼ @u
@x; @u @y
[image:4.612.108.575.78.221.2]
,fis the input original image with intrinsic noise, and the operatorε(p) is the symmetrised derivative which is defined as 0.5(rp+rpT). The first energy term on the right hand side ofEq 1is the data fidelity term which constrains the smoothed imageuto be similar to the original imagef. The second term preserves edges of objects inuand removes the noise fromfin the meantime. The third term imposes smoothness onuand also eliminates the
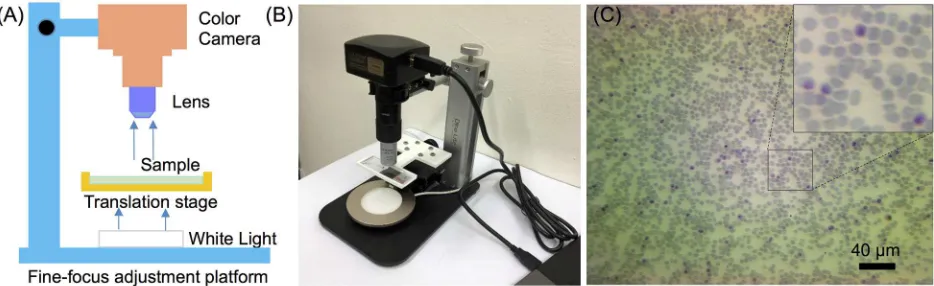
Fig 1. The developed based cytometer. (A) Schematic experimental setup of the cytometer. (B) Photograph of the
image-based cytometer. (C) An image of the blood smear taken by the cytometer.
staircase artefact produced by the second term. The minimum ofEq 1is taken over all the symmetrised gradient of the deformation fieldp= (p1,p2) on the image spaceO. The positiveλ coefficients andαinEq 1balance the data fidelity term (the first energy term), the first order derivative (the second energy term) and the second order derivative (the third energy term). The value ofαis normally set to 2 and this setting is suitable for most applications [44] and does not need to be tuned. In our experiment, we therefore setα= 2 and only varyλto achieve different smoothness scales.
As TGV takes both first and second derivatives into consideration, it can highlight the edges of objects and smooth image without creating additional artefacts. This property also enables TGV to overcome the problem of intensity inhomogeneity that has been found to widely exist in our captured images. Moreover, since the TGV functional ofEq 1is convex, it guarantees a global optimal solution as well as allows the use of powerful modern optimization techniques. Finally, TGV is translationally invariant and rotationally invariant, meaning that the denoising results are not affected by the viewpoint of the images taken from different angles. In spite of the outstanding performance of TGV for image denoising, it is difficult to minimise such functional due to its non-linear and non-smooth nature. In this study, we mini-mise TGV with a fast numerical algorithm based on split Bregman.[47] For a complete imple-mentation on this algorithm, we refer the reader to a previous study [48].
The smoothed image can be then segmented via a simple local adaptive thresholding approach [49], which is given as
T ¼ 0; lsðI;wsÞ I >C 1; otherwise
(
ð2Þ
whereTis the binary image,I = uin this case, andls(I,ws) means thatIis convolved with a suitable operator, i.e. the mean or median filter.wsis the window size of the filter andCis a user-defined threshold value. The adaptive thresholding produces binary segmentation with fewer isolated points, giving a better result than a simple high-pass threshold. It is worth men-tioning that this approach can segment large sized images (e.g. 2000×2000 pixels) with real-time computational speed, making it an ideal segmentation tool for the images used in the experiments. In addition, previous studies have shown that it is robust against inhomogeneity in medical images and can also obtain higher accuracy [50].
To prevent false detections in images that do not contain any parasites, we performed the machine-learning algorithm to automatically classify the parasite and non-parasite images. Specifically, 50 images were first selected manually as a training dataset, and divided into two groups, one containing 25 parasite images and the other group with 25 non-parasite images. The selected representative images were then segmented separately. For each RGB channel of the segmented image, the average intensity of all the pixels that fall in the segmented cells was calculated, thus forming a three-dimensional feature that can be effectively used for training a precise classification model. In this study, we choose Support Vector Machine (SVM) classifier with the linear kernel [51] to train these extracted features. The SVM classifies two different datasets by finding an optimal hyperplane that has the largest margin distance between them. It is more robust and accurate than other machine learning techniques. We therefore used the trained model by the SVM to automatically classify the rest of parasite and non-parasite images.
Total RBC number and infected RBC number quantification process
classify distinct developmental stages of the parasite. For images acquired under objective 20X, we used the mean filter with the window sizews= 120 and setC= 0.03,λ= 3 for the segmenta-tion of all RBCs, which produces binary segmentasegmenta-tion with isolated RBCs and clustered RBCs. The number of RBCs in the clustered region was estimated by dividing the whole clustered area by the average area of a single RBC. For iRBCs segmentation, a high threshold value
C= 0.2 was used withws= 100,λ= 3. Similarly, under 100X oil immersion objective,ws= 300,
C= 0.01 andλ= 5 were used for RBCs segmentation andws= 300,C= 0.15 andλ= 10 were set for iRBCs segmentation. It should be noted that theCvalue can be affected by the light intensity. After standardizations, we kept a constant, optimum light intensity and fixed expo-sure time of camera for our further assays. To address the possible risk of counting multiply infected parasites in one single iRBC as multiple iRBCs, we performed the following calcula-tion: if the distance between two segmented parasites is less than 150 pixels, these parasites will be considered as single iRBCs. It might still cause the false classification when two overlapping iRBCs are observed, but this was an extremely rare case due to the careful preparation of thin and uniform smear slides.
Classification of parasites’ developmental stage
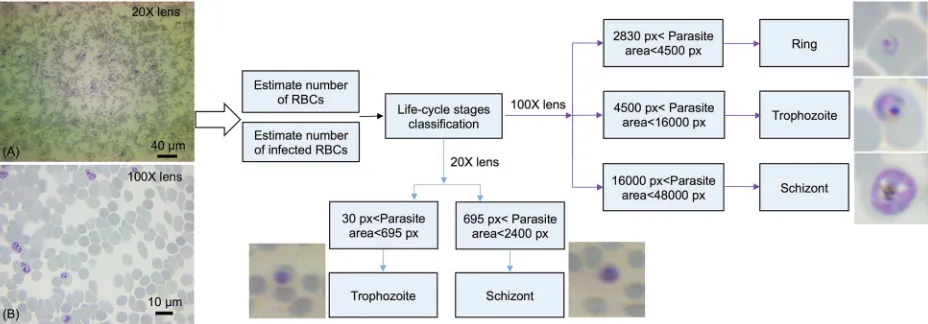
[image:6.612.110.574.79.241.2]After estimating the number of iRBCs, the algorithm performed the stage classification based on the area occupied by individual parasites within an iRBC.Fig 2depicts the criteria of para-sites’ stage classification under 20X and 100X magnifications. For 100X oil immersion objec-tive, if the area occupied by the parasite is larger than 2830 pixels and less than 4500 pixels, then it was identified as a ring-stage parasite. It was classified as trophozoite stage when the area is greater than 4500 pixels and less than 16000 pixels. If the parasite-occupied area is greater than 16000 pixels and less than 48000 pixels, it was considered as a schizont. For 20X objective, the magnification was insufficient to image the rings, thus we only identify the two late stages under this low magnification. All these threshold pixel numbers for stage classifica-tion were verified independently based on convenclassifica-tional cytological examinaclassifica-tion. The devel-oped system was used to determine parasitemia from seven independent samples. Each sample set included three smears and a minimum number of 30 fields were captured continuously resulting in counting at least 4000 RBCs for each smear. Imaging 30 fields for each smear took about 10 minutes, meaning it took 20 seconds to image each field.
Fig 2. Flowchart of the developed image analysis algorithm. Image A was taken by objective 20X and image B was taken by oil
immersion objective 100X.
Results and discussion
Image analysis results under 20X objective
The 20X objective was used for high-throughput imaging, and the analyses of images captured by our image-based cytometer were performed automatically using our image analysis algo-rithm, as shown inFig 3.Table 1shows the results from six randomly selected images from the same smear by using the image analysis algorithm and naked eye manual counting. Errors of total RBCs, iRBCs and parasitic classification were less than 5%. These negligible errors of total RBC number were primarily in regions where RBCs were clustered, minimally compromising the counting accuracy. Estimation of the number of iRBCs and life cycle stages were mildly influenced by debris. Nevertheless, error values less than 5% showed the excellent performance and reliability of our image-based cytometer compared to manual counting.
Image analysis results under 100X oil immersion objective
[image:7.612.96.566.302.689.2]Since 20X objective is insufficient to image the ring stages with high accuracy, a 100X oil immersion objective was used for parasitemia detection and classification. As illustrated in
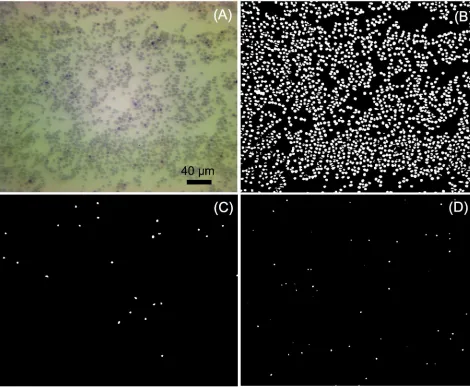
Fig 3. Images automatically analyzed by the developed image-based cytometer. (A) Original image taken by objective 20X. (B)
Representation of all the extracted RBCs. (C) Extracted schizont stage iRBCs. (D) Extracted trophozoite stage iRBCs.
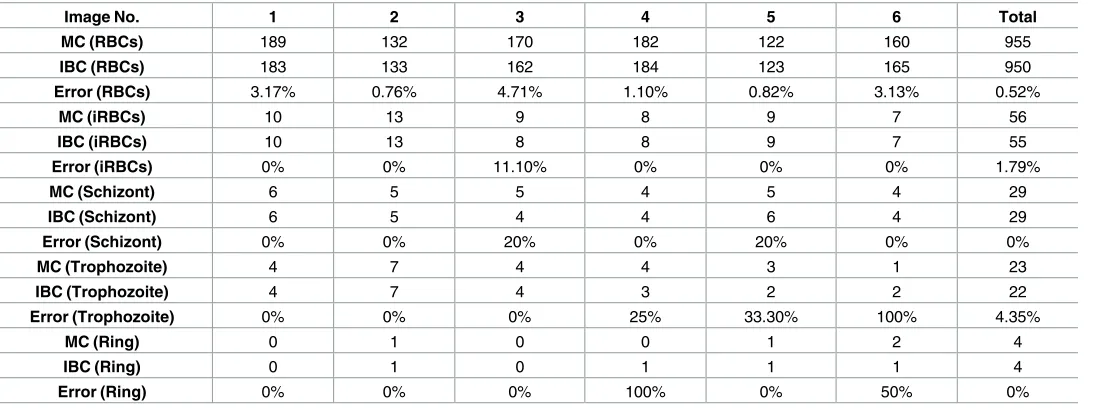
Fig 4, image-based cytometer equipped with 100X allowed us to reliably classify all the three parasitic stages.Table 2shows the inspection results of RBCs, iRBCs segmentation and stage-specific classification. The ability of our proposed cytometer to classify and document different developmental stages may lead to potential pharmacological applications in identifying the potential blockers of egress, invasion and parasitic development inhibitory molecules [38]. In
Table 1. Comparison of cell counting and developmental stage classification (Objective 20X).
Image No. 1 2 3 4 5 6 Total
MC (RBCs) 1933 2381 2788 2870 2821 1942 14735
IBC (RBCs) 2000 2340 2810 2753 2801 1972 14676
Error (RBCs) 3.35% 1.72% 0.79% 4.10% 0.71% 1.55% 4.00%
MC (iRBCs) 103 90 127 131 134 78 663
IBC (iRBCs) 106 94 126 131 137 78 672
Error (iRBCs) 2.91% 4.44% 0.78% 0% 2.24% 0% 1.36%
MC (Schizont) 50 36 70 63 71 25 315
IBC (Schizont) 51 35 72 64 72 25 319
Error (Schizont) 2.00% 2.78% 2.86% 1.59% 1.40% 0% 1.27%
MC (Trophozoite) 53 54 57 68 63 53 348
IBC (Trophozoite) 55 59 54 67 65 53 353
Error (Trophozoite) 3.77% 9.26% 5.26% 1.47% 3.17% 0% 1.44%
*MC represents the average value of two manual counting performed in the same image which was analysed by image-based cytometer. *iRBCs—infected Red Blood Cells.
*IBC indicates the result analyzed using the image-based cytometer.
https://doi.org/10.1371/journal.pone.0179161.t001
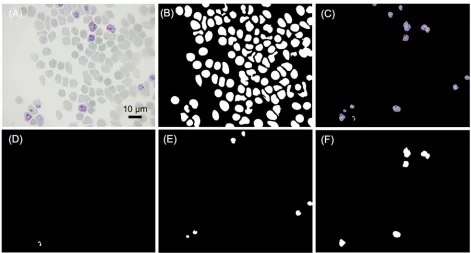
Fig 4. Images automatically analyzed by the developed image-based cytometer. (A) Original image taken by immersion objective
100X. (B) All the extracted RBCs. (C) All the extracted iRBCs. (D) Extracted ring stage. (E) Extracted trophozoite stage. (F) Extracted schizont stage.
[image:8.612.105.576.410.663.2]a single image, errors of a specific parasite stage may be large (due to limited number of para-sites in the field), but the total error of randomly selected 6 images was well below 5%, which shows the robustness of our system. Giemsa-stained images taken at 20X and 100X objective lens in the aforementioned studies are shown inS1andS2Figs of supplementary information, respectively.
Estimation of false positives
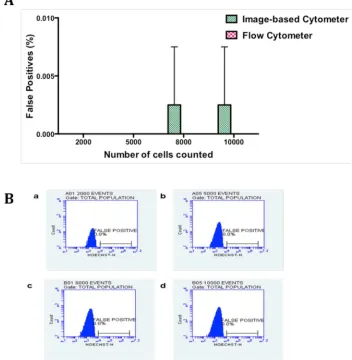
[image:9.612.37.597.87.291.2]There are several factors that could account for the sensitivity of the microscopic examination of thin blood smears such as quality of the smears (uniform dispersion of single cells vs clump of cells), duration and dilution of Giemsa staining, and debris and dirt arising from Giemsa solution [52]. Previous reports have shown a huge variation in parasitemia levels between 6.3% and 45.8% based on 48 microscopic slides circulated between four laboratories in Mpumalanga province of South Africa [53]. We therefore set up trial experiments to standardize the param-eters such as the dilution and duration of Giemsa staining, uniform distribution of RBCs to reduce and prevent the false positive values. From our trial experiments, we noticed that uni-form distribution of RBCs stained with 1 in 10 dilution of Giemsa in distilled water for 10 min-utes and washed with distilled water showed the best results. To determine the false positive value of image-based cytometer, healthy RBCs (hRBCs) were diluted in MCM and same num-ber of RBCs (ranging from 2000 to 10000) was scored using both flow cytometer and our image-based cytometer. As expected, there was an absolute zero detection of false positive value in the flow cytometer and the corresponding flow plots are shown inFig 5Band the image-based cytometer showed 0.0025% false positive detection for 8000 and 10000 cells. As shown inFig 5A, there were no false positives detected using image-based cytometer when calculating cells less than 5000. In order to calculate the false positives, we performed two inde-pendent experiments in duplicates. In one of the replicates of the first indeinde-pendent experi-ment, we noticed 1 false positive while counting 8000 and 10000 cells, which accounts for
Table 2. Comparison of cell counting and developmental stage classification (Immersion objective 100X).
Image No. 1 2 3 4 5 6 Total
MC (RBCs) 189 132 170 182 122 160 955
IBC (RBCs) 183 133 162 184 123 165 950
Error (RBCs) 3.17% 0.76% 4.71% 1.10% 0.82% 3.13% 0.52%
MC (iRBCs) 10 13 9 8 9 7 56
IBC (iRBCs) 10 13 8 8 9 7 55
Error (iRBCs) 0% 0% 11.10% 0% 0% 0% 1.79%
MC (Schizont) 6 5 5 4 5 4 29
IBC (Schizont) 6 5 4 4 6 4 29
Error (Schizont) 0% 0% 20% 0% 20% 0% 0%
MC (Trophozoite) 4 7 4 4 3 1 23
IBC (Trophozoite) 4 7 4 3 2 2 22
Error (Trophozoite) 0% 0% 0% 25% 33.30% 100% 4.35%
MC (Ring) 0 1 0 0 1 2 4
IBC (Ring) 0 1 0 1 1 1 4
Error (Ring) 0% 0% 0% 100% 0% 50% 0%
*MC represents the average value of two manual counting performed in the same image which was analysed by image-based cytometer. *iRBCs—infected Red Blood Cells.
*IBC indicates the result analyzed using the image-based cytometer.
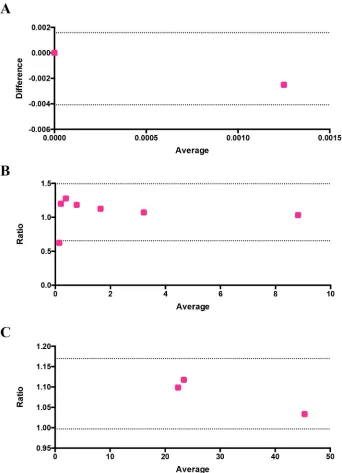
0.0125% and 0.01% false positives. We rounded off our results to decimal places, getting 0.01% false positive value and 0.0025% average false positive value in total for two independent exper-iments in duplicates and the differences between the values of image-based cytometer and flow cytometer were found to be nonsignificant using two tailed Wilcoxon T test. The result obtained from this experiment was evaluated using Bland-Altman method of comparison and it is shown inFig 6A. It should be noted that the values are within the 95% limits of agreement (lower 95% limit of agreement = -0.004079 and upper 95% limit of agreement = 0.001579).
Pharmacological testing using the developed image-based cytometer
[image:10.612.198.550.85.445.2]Reliable, easy and affordable methods of inexpensive and high throughput screening tech-niques are needed for quantitative evaluation of new classes of antimalarials. Quantification of
Fig 5. Comparison of false positives in hRBCs using image-based cytometer and flow cytometer. (A)
Briefly, freshly drawn RBCs were counted and scored using image-based cytometer and flow cytometer, respectively. There were no false parasites obtained until 5000 RBCs were scored using image-based cytometer. Our developed cytometer exhibited 0.0025% false positive values while calculating more than 5000 cells. The figure represents the average of two independent experiments performed in duplicates and the error bars represent the standard deviation of the average values. (B) The figure represents the histogram plots for false positives estimated using flow cytometer while counting 2000 (a), 5000 (b), 8000 (c) and 10000 (d) events.
radioactive substance uptake such as [3H]hypoxanthine [54], [3H]isoleucine [55] and [3 H]eth-anolamine [56] by malaria parasites in the presence of the drugs have been measured to assess the drug efficacy. Several tools including flow cytometry and fluorescence microscopy are commonly employed for antimalarial tests in research laboratories. Here, we investigated the application of our image-based cytometer in pharmacological assays using three
well-Fig 6. Evaluation of the performance and reliability of the image-based cytometer using Bland-Altman method of comparison. The differences between the false positives of flow cytometer and image-based
cytometer versus their average is plotted in (A). Ratio of parasitemia detected through flow cytometer and image-based cytometer and ratio of IC50values identified through flow cytometer and image-based cytometer
are shown in (B) and (C) respectively. All values are within the 95% limits of agreement, which are shown as two dotted lines in the figures.
[image:11.612.201.543.76.549.2]established antimalarials: chloroquine, artemisinin and cycloheximide in comparison to a more laborious flow cytometry method. These three antimalarials were selected since they act through distinct mechanisms and halt the parasitic growth and development under different stages [57].
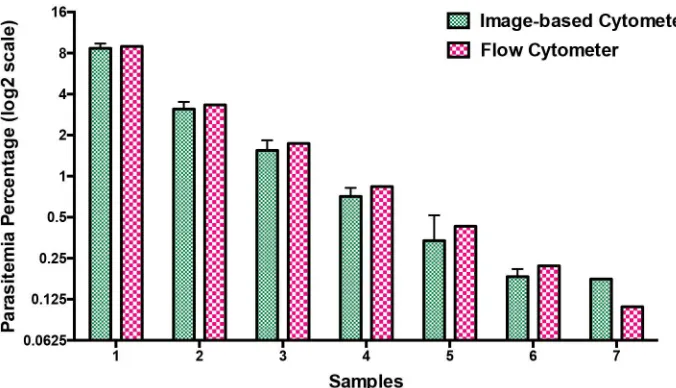
Prior to proceeding with drug testing, we evaluated the potency of our image-based cytom-eter over a range of parasitemia and the results were compared against flow cytometry. Mixed stage parasites were diluted to obtain parasitemia ranging between 0.2% and 9%. Giemsa-stained smears were taken for assessing the parasitemia (in a blind manner to not reveal sam-ple identity) using image-based cytometer in parallel to flow cytometry-based assay. As shown inFig 7, parasitemia scored using our image-based cytometer were totally comparable to the values obtained from flow cytometric experiments as confirmed through two-tailed paired T test. Corresponding flow cytometer plots are shown inS3 Figof the supplementary informa-tion. The results obtained through this parasitemia determination experiment is evaluated using Bland-Altman method of comparison and it is shown inFig 6B. It should be noted that the values are within the 95% limits of agreement (lower 95% limit of agreement = 0.6539 and upper 95% limit of agreement = 1.493).
Next, dose-response curves for chloroquine, artemisinin and cycloheximide estimated through image-based cytometer and standard flow cytometer are shown inFig 8. Despite minor differences, IC50values defined as half maximal inhibitory concentration calculated
through these methods were similar (and mostly in agreement with reported values elsewhere [57–59]) as listed inTable 3. These results demonstrate the feasibility of our proposed system for inexpensive, highly sensitive and reliable, high throughput screening of antimalarials. The IC50values obtained by the image-based cytometer was evaluated using Bland-Altman
[image:12.612.201.539.76.270.2]method of comparison and it is shown inFig 6C. It should be noted that the values are within the 95% limits of agreement (lower 95% limit of agreement = 0.9970 and upper 95% limit of agreement = 1.170).
Fig 7. Comparison of parasitemia values using image-based cytometer and flow cytometer. Mixed
stage malaria parasites were diluted in hRBCs to obtain parasitemia ranging between 0.2% and 9% and scored using image-based cytometer. The results were comparable with flow cytometer values with no significant difference. The figure represents the average of three independent measurements performed and the error bars represent the standard deviation of the average values.
Fig 8. Comparison of dose response curves for the three antimalarial drugs generated using image-based cytometer and flow cytometer. Well-known anti-malarials; (A) Chloroquine, (B) Artemisinin and (C)
Cycloheximide were screened against the laboratory strain, 3D7. Standard growth inhibition assay was performed and IC50values determined using our image-based cytometer and flow cytometry in parallel
[Table 3], to obtain comparable results. The error bars represent standard errors.
Conclusions
In this study, we have developed an image-based cytometer for scoring and classifying the stages of malaria parasites. This portable system, which is a combination of commercial parts and in-house 3D-printed parts, has a compact dimension of 22 cm (L) x 15 cm (W) x 23 cm (H) and weights less than 2000 grams and can be used in routine laboratory drug screening and potential on field-diagnosis. By comparing the results obtained by our developed method to manual counting and flow cytometry, we have validated its robustness and accuracy to dif-ferentially estimate all parasitic stages. For the parasitemia test and IC50determination assays,
results were comparable with flow cytometry method. Several advantages of our portable image-based cytometer are summarized as follows: 1) it provides comparable results to flow cytometry and allows stage-specific scoring of parasitemia; 2) it is a non-fluorescent method with simple preparation and operation, exhibiting high computational speed less than 10 sec-onds per image (Dimensions: 4096 x 3286) using commonly used laptops; 3) this image-based cytometer is low-cost (less than 600 USD) and compact, therefore making it a reliable and affordable tool to (i) detect and score level of infection and (ii) facilitate screening of antimalar-ials from natural or synthetic products in resource-poor settings.
Supporting information
S1 Fig. Six randomly selected images from the same smear taken and analysed using the developed image-based cytometer under 20X objective lens. (Quantitative analyses are
shown in theTable 1). (TIFF)
S2 Fig. Six randomly selected images from the same smear taken and analysed using the developed image-based cytometer under 100X oil immersion objective lens. (Quantitative
analyses are shown in theTable 2). (TIFF)
S3 Fig. Comparison of true positives (parasitemia) measured using image-based cytometer and flow cytometer. The figure represents the histogram plots of parasite values calculated
using flow cytometer. Figures (a) to (g) represents the different samples from 1 to 7 showed in Fig 7.
(TIFF)
Acknowledgments
[image:14.612.38.573.89.141.2]DY and GS gratefully acknowledge the President’s Graduate Fellowship awarded by the Min-istry of Education (MOE), Singapore. YA and RC gratefully acknowledge the support pro-vided by SUTD-MIT International Design Centre (IDG11300101). RC also acknowledges Astar-India Collaboration Grant (RGAST1503) for funding support. YA also acknowledges the support from the Singapore Ministry of Education Academic Research Fund Tier 2 (T2MOE1603).
Table 3. Comparison of IC50determined by two different methods.
Antimalarial drugs IC50(Flow cytometer) IC50(Image-based cytometer)
Chloroquine (ng/ml) 24.7 22.1
Artemisinin (ng/ml) 23.4 21.3
Cycloheximide (ng/ml) 46.1 44.6
[image:14.612.40.575.89.140.2]Author Contributions
Conceptualization: DY GS RC YA.
Data curation: DY GS JD.
Formal analysis: DY GS JD.
Funding acquisition: YA RC.
Investigation: DY GS.
Methodology: DY GS JD.
Project administration: YA RC.
Resources: YA RC.
Software: JD DY SG LB.
Supervision: YA RC.
Validation: YA RC.
Visualization: DY GS YA RC.
Writing – original draft: DY GS JD.
Writing – review & editing: YA RC.
References
1. Organization WHO. World Malaria Report 2015. 2015.
2. Dondorp AM, Nosten F, Yi P, Das D, Phyo AP, Tarning J, et al. Artemisinin Resistance in Plasmodium falciparum Malaria. New England Journal of Medicine. 2009; 361(5):455–67.https://doi.org/10.1056/ NEJMoa0808859PMID:19641202
3. Noedl H, Socheat D, Satimai W. Artemisinin-Resistant Malaria in Asia. New England Journal of Medi-cine. 2009; 361(5):540–1.https://doi.org/10.1056/NEJMc0900231PMID:19641219
4. Peters W. Drug resistance in Plasmodium berghei. Vincke and Lips, 1948. I. Chloroquine resistance. Experimental parasitology. 1965; 17(1):80–9. PMID:5843289
5. Dondorp AM, Angus BJ, Chotivanich K, Silamut K, Ruangveerayuth R, Hardeman MR, et al. Red blood cell deformability as a predictor of anemia in severe falciparum malaria. American Journal of Tropical Medicine and Hygiene. 1999; 60(5):733–7. PMID:10344643
6. Tangpukdee N, Duangdee C, Wilairatana P, Krudsood S. Malaria Diagnosis: A Brief Review. Korean Journal of Parasitology. 2009; 47(2):93–102.https://doi.org/10.3347/kjp.2009.47.2.93PMID:19488414 7. Mwangi TW, Mohammed M, Dayo H, Snow RW, Marsh K. Clinical algorithms for malaria diagnosis lack utility among people of different age groups. Tropical Medicine & International Health. 2005; 10(6):530– 6.https://doi.org/10.1111/j.1365-3156.2005.01439.xPMID:15941415
8. Reyburn H, Mbatia R, Drakeley C, Carneiro I, Mwakasungula E, Mwerinde O, et al. Overdiagnosis of malaria in patients with severe febrile illness in Tanzania: a prospective study. British Medical Journal. 2004; 329(7476):1212–5.https://doi.org/10.1136/bmj.38251.658229.55PMID:15542534
9. Doderer C, Heschung A, Guntz P, Cazenave J-P, Hansmann Y, Senegas A, et al. A new ELISA kit which uses a combination of Plasmodium falciparum extract and recombinant Plasmodium vivax anti-gens as an alternative to IFAT for detection of malaria antibodies. Malaria journal. 2007; 6(1):19.
10. Makler MT, Ries JM, Williams JA, Bancroft JE, Piper RC, Gibbins BL, et al. Parasite lactate-dehydroge-nase as an assay for Plasmodium falciparum drug-sensitivity. American Journal of Tropical Medicine and Hygiene. 1993; 48(6):739–41. PMID:8333566
12. Lema OE, Carter JY, Nagelkerke N, Wangai MW, Kitenge P, Gikunda SM, et al. Comparison of five methods of malaria detection in the outpatient setting. American Journal of Tropical Medicine and Hygiene. 1999; 60(2):177–82. PMID:10072132
13. Cho D, Kim KH, Park SC, Kim YK, Lee KN, Lim CS. Evaluation of rapid immunocapture assays for diag-nosis of Plasmodium vivax in Korea. Parasitology Research. 2001; 87(6):445–8.https://doi.org/10. 1007/s004360000360PMID:11411942
14. Richardson DC, Ciach M, Zhong KJY, Crandall I, Kain KC. Evaluation of the Makromed dipstick assay versus PCR for diagnosis of Plasmodium falciparum malaria in returned travelers. Journal of Clinical Microbiology. 2002; 40(12):4528–30.https://doi.org/10.1128/JCM.40.12.4528-4530.2002PMID:
12454146
15. Iqbal J, Khalid N, Hira PR. Comparison of two commercial assays with expert microscopy for confirma-tion of symptomatically diagnosed malaria. Journal of Clinical Microbiology. 2002; 40(12):4675–8.
https://doi.org/10.1128/JCM.40.12.4675-4678.2002PMID:12454171
16. Genton B, D’Acremont V, Rare L, Baea K, Reeder JC, Alpers MP, et al. Plasmodium vivax and mixed infections are associated with severe malaria in children: A prospective cohort study from Papua New Guinea. Plos Medicine. 2008; 5(6):881–9.https://doi.org/10.1371/journal.pmed.0050127PMID:
18563961
17. Palacios G, Quan PL, Jabado OJ, Conlan S, Hirschberg DL, Liu Y, et al. Panmicrobial oligonucleotide array for diagnosis of infectious diseases. Emerging Infectious Diseases. 2007; 13(1):73–81.https:// doi.org/10.3201/eid1301.060837PMID:17370518
18. Morassin B, Fabre R, Berry A, Magnaval JF. One year’s experience with the polymerase chain reaction as a routine method for the diagnosis of imported malaria. American Journal of Tropical Medicine and Hygiene. 2002; 66(5):503–8. PMID:12201583
19. Poon LLM, Wong BWY, Ma EHT, Chan KH, Chow LMC, Abeyewickreme W, et al. Sensitive and inex-pensive molecular test for falciparum malaria: Detecting Plasmodium falciparum DNA directly from heat-treated blood by loop-mediated isothermal amplification. Clinical Chemistry. 2006; 52(2):303–6.
https://doi.org/10.1373/clinchem.2005.057901PMID:16339303
20. Shapiro HA, Mandy F. Cytometry in malaria: Moving beyond Giemsa. Cytometry Part A. 2007; 71A (9):643–5.https://doi.org/10.1002/cyto.a.20453PMID:17712779
21. de Langen AJ, van Dillen J, de Witte P, Mucheto S, Nagelkerke N, Kager P. Automated detection of malaria pigment: feasibility for malaria diagnosing in an area with seasonal malaria in northern Namibia. Tropical Medicine & International Health. 2006; 11(6):809–16.
22. Singh B, Bobogare A, Cox-Singh J, Snounou G, Abdullah MS, Rahman HA. A genus- and species-spe-cific nested polymerase chain reaction malaria detection assay for epidemiologic studies. American Journal of Tropical Medicine and Hygiene. 1999; 60(4):687–92. PMID:10348249
23. Steenkeste N, Incardona S, Chy S, Duval L, Ekala MT, Lim P, et al. Towards high-throughput molecular detection of Plasmodium: new approaches and molecular markers. Malaria Journal. 2009; 8.https:// doi.org/10.1186/1475-2875-8-86PMID:19402894
24. Steenkeste N, Rogers WO, Okell L, Jeanne I, Incardona S, Duval L, et al. Sub-microscopic malaria cases and mixed malaria infection in a remote area of high malaria endemicity in Rattanakiri province, Cambodia: implication for malaria elimination. Malaria Journal. 2010; 9. https://doi.org/10.1186/1475-2875-9-108PMID:20409349
25. Polley SD, Mori Y, Watson J, Perkins MD, Gonzalez IJ, Notomi T, et al. Mitochondrial DNA Targets Increase Sensitivity of Malaria Detection Using Loop-Mediated Isothermal Amplification. Journal of Clin-ical Microbiology. 2010; 48(8):2866–71.https://doi.org/10.1128/JCM.00355-10PMID:20554824 26. Demas A, Oberstaller J, DeBarry J, Lucchi NW, Srinivasamoorthy G, Sumari D, et al. Applied
Geno-mics: Data Mining Reveals Species-Specific Malaria Diagnostic Targets More Sensitive than 18S rRNA. Journal of Clinical Microbiology. 2011; 49(7):2411–8.https://doi.org/10.1128/JCM.02603-10
PMID:21525225
27. Fontecha GA, Mendoza M, Banegas E, Poorak M, De Oliveira AM, Mancero T, et al. Comparison of molecular tests for the diagnosis of malaria in Honduras. Malaria Journal. 2012; 11.https://doi.org/10. 1186/1475-2875-11-119PMID:22513192
28. Payne D. Use and limitations of light-microscopy for diagnosing malaria at the primary health-care level. Bulletin of the World Health Organization. 1988; 66(5):621–6. PMID:2463112
29. Murray CK, Gasser RA, Magill AJ, Miller RS. Update on rapid diagnostic testing for malaria. Clinical Microbiology Reviews. 2008; 21(1):97-+.https://doi.org/10.1128/CMR.00035-07PMID:18202438 30. Gascoyne P, Satayavivad J, Ruchirawat M. Microfluidic approaches to malaria detection. Acta Tropica.
31. Erdman LK, Kain KC. Molecular diagnostic and surveillance tools for global malaria control. Travel med-icine and infectious disease. 2008; 6(1):82–99.
32. Tek FB, Dempster AG, Kale I. Parasite detection and identification for automated thin blood film malaria diagnosis. Computer Vision and Image Understanding. 2010; 114(1):21–32.https://doi.org/10.1016/j. cviu.2009.08.003
33. Memeu DM, Kaduki KA, Mjomba A, Muriuki NS, Gitonga L. Detection of plasmodium parasites from images of thin blood smears. Open Journal of Clinical Diagnostics. 2013; 3:183–94.
34. Tsai M-H, Yu S-S, Chan Y-K, Jen C-C. Blood Smear Image Based Malaria Parasite and Infected-Eryth-rocyte Detection and Segmentation. Journal of medical systems. 2015; 39(10):1–14.
35. Ross NE, Pritchard CJ, Rubin DM, Duse AG. Automated image processing method for the diagnosis and classification of malaria on thin blood smears. Medical & Biological Engineering & Computing. 2006; 44(5):427–36.https://doi.org/10.1007/s11517-006-0044-2PMID:16937184
36. Somasekar J, Reddy BE. Segmentation of erythrocytes infected with malaria parasites for the diagnosis using microscopy imaging. Computers & Electrical Engineering. 2015; 45:336–51.https://doi.org/10. 1016/j.compeleceng.2015.04.009
37. Lee SA, Leitao R, Zheng G, Yang S, Rodriguez A, Yang C. Color capable sub-pixel resolving optofluidic microscope and its application to blood cell imaging for malaria diagnosis. PloS one. 2011; 6(10): e26127.https://doi.org/10.1371/journal.pone.0026127PMID:22022535
38. Moon S, Lee S, Kim H, Freitas-Junior LH, Kang M, Ayong L, et al. An image analysis algorithm for malaria parasite stage classification and viability quantification. PloS one. 2013; 8(4):e61812.https:// doi.org/10.1371/journal.pone.0061812PMID:23626733
39. Duffy S, Avery VM. Development and Optimization of a Novel 384-Well Anti-Malarial Imaging Assay Validated for High-Throughput Screening. American Journal of Tropical Medicine and Hygiene. 2012; 86(1):84–92.https://doi.org/10.4269/ajtmh.2012.11-0302PMID:22232455
40. Trager W, Jensen JB. Human malaria parasites in continuous culture. Science. 1976; 193(4254):673– 5.https://doi.org/10.1126/science.781840PMID:781840
41. Lambros C, Vanderberg JP. Synchronization of Plasmodium falciparum erythrocytic stages in culture. Journal of Parasitology. 1979; 65(3):418–20.https://doi.org/10.2307/3280287PMID:383936 42. Subramanian G, Rajeev CPB, Mohan CD, Sinha A, Chu TTT, Anusha S, et al. Synthesis and in vitro
evaluation of hydrazinyl phthalazines against malaria parasite, Plasmodium falciparum. Bioorganic & Medicinal Chemistry Letters. 2016; 26(14):3300–6.https://doi.org/10.1016/j.bmcl.2016.05.049PMID:
27261180
43. Bredies K, Kunisch K, Pock T. Total generalized variation. SIAM Journal on Imaging Sciences. 2010; 3 (3):492–526.
44. Duan J, Lu W, Tench C, Gottlob I, Proudlock F, Samani NN, et al. Denoising optical coherence tomogra-phy using second order total generalized variation decomposition. Biomedical Signal Processing and Control. 2016; 24:120–7.
45. Liu RW, Shi L, Huang W, Xu J, Yu SCH, Wang D. Generalized total variation-based MRI Rician denois-ing model with spatially adaptive regularization parameters. Magnetic resonance imagdenois-ing. 2014; 32 (6):702–20.https://doi.org/10.1016/j.mri.2014.03.004PMID:24746774
46. Knoll F, Bredies K, Pock T, Stollberger R. Second order total generalized variation (TGV) for MRI. Mag-netic resonance in medicine. 2011; 65(2):480–91.https://doi.org/10.1002/mrm.22595PMID:21264937 47. Goldstein T, Osher S. The split Bregman method for L1-regularized problems. SIAM journal on imaging
sciences. 2009; 2(2):323–43.
48. Lu W, Duan J, Qiu Z, Pan Z, Liu RW, Bai L. Implementation of high-order variational models made easy for image processing. Mathematical Methods in the Applied Sciences. 2016.
49. Ding Y, Pardon MC, Agostini A, Faas H, Duan J, Ward WO, et al. Novel Methods for microglia segmen-tation, feature extraction and classification. IEEE/ACM Transactions on Computational Biology and Bio-informatics. 2016.
50. Duan J, Tench C, Gottlob I, Proudlock F, Bai L. Automated Segmentation of Retinal Layers from Optical Coherent Tomography Images Using Geodesic Distance. arXiv preprint arXiv:160902214. 2016.
51. Scholkopf B, Sung K-K, Burges CJ, Girosi F, Niyogi P, Poggio T, et al. Comparing support vector machines with Gaussian kernels to radial basis function classifiers. IEEE transactions on Signal Pro-cessing. 1997; 45(11):2758–65.
52. Frean J, Poonsamy B, Shandukani B, Moonasar D, Raman J. Case management of malaria: Diagnosis. Samj South African Medical Journal. 2013; 103(10):789–93.https://doi.org/10.7196/samj.7442PMID:
53. Durrheim DN, Becker PJ, Billinghurst K, Brink A. Diagnostic disagreement—The lessons learnt from malaria diagnosis in Mpumalanga. South African Medical Journal. 1997; 87(5):609–11. PMID:9254820 54. Desjardins RE, Canfield C, Haynes J, Chulay J. Quantitative assessment of antimalarial activity in vitro
by a semiautomated microdilution technique. Antimicrobial agents and chemotherapy. 1979; 16 (6):710–8. PMID:394674
55. Iber P, Pavanand K, Wilks N, Colwell E. Evaluation of in vitro drug sensitivity of human Plasmodium fal-ciparum by incorporation of radioactive isoleucine. Journal of the Medical Association of Thailand. 1975; 58(11):559–66. PMID:1107459
56. Elabbadi N, Ancelin ML, Vial HJ. Use of radioactive ethanolamine incorporation into phospholipids to assess invitro antimalarial activity by the semiautomated microdilution technique. Antimicrobial Agents and Chemotherapy. 1992; 36(1):50–5. PMID:1590699
57. Wilson DW, Langer C, Goodman CD, McFadden GI, Beeson JG. Defining the Timing of Action of Anti-malarial Drugs against Plasmodium falciparum. Antimicrobial Agents and Chemotherapy. 2013; 57 (3):1455–67.https://doi.org/10.1128/AAC.01881-12PMID:23318799
58. Lee YQ, Goh ASP, Ch’ng JH, Nosten FH, Preiser PR, Pervaiz S, et al. A High-Content Phenotypic Screen Reveals the Disruptive Potency of Quinacrine and 3 ’, 4 ’-Dichlorobenzamil on the Digestive Vacuole of Plasmodium falciparum. Antimicrobial Agents and Chemotherapy. 2014; 58(1):550–8.
https://doi.org/10.1128/AAC.01441-13PMID:24217693