A hybrid EDA for load balancing in multicast with
network coding
Authors
: Huanlai Xing
1, Saifei Li
1, Yunhe Cui
1, Lianshan Yan
1, Wei Pan
1, Rong Qu
2Affiliation
:
1
School of Information Science and Technology, Southwest Jiaotong University
2
ASAP Group, School of Computer Science, University of Nottingham
Corresponding author
: Huanlai Xing
Telephone
: +(86) 18780272961
: [email protected]
Address
: Room 9439, Teaching building 9, School of Information Science and Technology,
Southwest Jiaotong University (Xipu Campus), Chengdu 611756, China
Abstract:
Load balancing is one of the most important issues in the practical deployment of multicast with network coding. However, this issue has received little research attention. This paper studies how traffic load of network coding based multicast (NCM) is disseminated in a communications network, with load balancing considered as an important factor. To this end, a hybridized estimation of distribution algorithm (EDA) is proposed, where two novel schemes are integrated into the population based incremental learning (PBIL) framework to strike a balance of exploration and exploitation, thus enhance the efficiency of the stochastic search. The first scheme is a bi-probability-vector coevolution scheme, where two probability vectors (PVs) evolve independently with periodical individual migration. This scheme can significantly diversify the population and enhance the global exploration. The second scheme is a local search heuristic. It is based on the problem-specific domain knowledge and improves the NCM transmission plan at the expense of additional computational time. The heuristic can be utilized either as a local search operator to enhance the local exploitation during the evolutionary process, or as a follow-up operator to improve the best-so-far solutions found after the evolution. Experimental results show that the proposed algorithms outperform a number of state-of-the-art evolutionary algorithms regarding the best solution obtained on a large set of benchmark instances.
Index Terms — Estimation of distribution algorithm, load balancing, multicast, network coding, population
1.
Introduction
In recent years, there is a significant increase of Internet traffic due to the dramatic growth of multimedia applications such as IPTV, video conferencing, and online games. Statistical reports show 90% of internet traffic comes from multimedia [41]. Multimedia distribution usually requires real-time and point-to-multipoint data transmissions, with stringent quality-of-service (QoS) requirements guaranteed. Multicast is able to provide efficient support to one-to-many data delivery, which incurs less amount of burden to network resources compared with multiple unicasts. This technique has received ever-increasing demand in many multimedia applications [4]. Nevertheless, the traditional multicast, which employs the store-and-forward data forwarding scheme, cannot always achieve the theoretical maximum throughput [1].
The concept of network coding was introduced in 2000 [1]. Different from the store-and-forward scheme, network coding allows intermediate nodes to recombine packets received from different incoming links. This paradigm is featured with a number of significant advantages, such as balanced network payload, robust security, strong resistance to network failures, energy-efficient transmission, and so on. In addition, when applied to multicast, network coding can always achieve the theoretical maximum throughput. This makes network coding based multicast (NCM) an ideal technology to support one-to-many broadband data transmission [30]. Therefore, NCM has received a significant amount of research attention from areas, such as information theory and computer science, for more than one decade [32][37].
To accommodate ever-increasing users while providing sufficient QoS to the network, network service providers (NSPs) are interested in maximizing the utilization of their infrastructure, where load balancing is one of the key performance indicators. Load balancing of the traditional multicast traffic (which is based on the store-and-forward scheme) has drawn a great amount of attention for many years [37][40].
HLCR achieves more balanced traffic load, compared with the traditional multicast. Vieira et al [39] analyze the problem of exploiting the capabilities of next generation terminals to receive and process several, partially overlapping beams of a multi-beam satellite. Two iterative algorithms are devised to gain balanced traffic load. In [21], in the context of multi-hop wireless networks, the authors propose a flexible energy-efficient multicast routing algorithm based on network coding, which is beneficial for balancing the traffic load, maximizing network throughput and decreasing network energy consumption simultaneously.
Nevertheless, all the above work is under the assumption that coding operations are performed at all coding-possible nodes. This may lead to serious waste of network resources, since coding operations usually incur computationally expensive overhead. In fact, performing coding operations at a subset of the coding-possible nodes is sufficient to achieve an expected multicast data rate [24][25][26]. This paper investigates the issue of load balancing in the context of NCM with coding operations necessarily performed. To the best of our knowledge, however, this issue has drawn little research attention in the literature.
As a class of stochastic optimization techniques, estimation of distribution algorithms (EDAs) explore the search space by building probabilistic models based on the sampling of promising solutions/individuals [15]. EDAs have been successfully applied to a wide range of optimization problems in areas such as computer science, operational research, electrical and electronic engineering, and so on. In general, EDAs for binary optimization problems can be classified into three categories, namely algorithms with univariate, tree-based and multivariate models. Algorithms in the first category are for addressing problems where variables are independent of each other. Some of the well-known EDAs include the population based incremental learning (PBIL), the univariate marginal distribution algorithm (UMDA), the quantum-inspired evolutionary algorithm (QEA), and the compact genetic algorithm (cGA). The second category is for tackling those problems with pairwise interactions in variables, e.g. the mutual information maximizing input clustering (MIMIC) algorithm and the bivariate marginal distribution algorithm (BMDA). Algorithms in the last category aim to solve problems with multivariate interactions in variables. The extended compact genetic algorithm (ECGA) and the Bayesian optimization algorithm (BOA) belong to this category. Details can be found in [15].
involved. Due to its simplicity and effectiveness, PBIL has been widely applied to a number of benchmark and real-world problems, e.g. the image retrieval problem [11], the power system stabilizer design [10], the iterated prisoner dilemma [14], the dynamic optimization problem [49][50], the unsupervised feature selection problem [18], the robot soccer system optimization problem [29], the truss optimization problem [35][36], the electromagnetic device design problem [34], the sensor network design problem [7], the water distribution network optimization [6], the constrained portfolio optimization [22], the non-linear antenna array design optimization [16], inverse problems in continuous space [17], and so on.
As aforementioned, PBIL has been reported to perform well on problems with no interdependency among variables. In the problem concerned in this paper, variables are also independent of each other (see Subsection 4.1 for details). So, PBIL should have the potential to well address the new load balancing problem. In addition, PBIL has been adopted to solve the network coding related optimization problems [43][44] and load balancing [5], respectively, where the algorithm showed outstanding performance in terms of the global exploration and computational costs. Hence, it is expected that PBIL could also achieve excellent performance when solving a similar problem. This motivates us to explore PBIL for conducting the research work on the problem concerned here.
The contributions of this paper are summarized as follows.
― We formulate a load balancing optimization problem in NCM, where coding operations are
performed when necessary. This provides extra flexibility to NCM since less computational resource consumptions allow the network to accommodate more flows, especially when the network is heavily loaded. In the optimization problem, the single objective is the variance of the bandwidth utilization ratios over all links within a given communications network. A smaller variance indicates a more balanced traffic load.
― We propose a hybridized PBIL with two performance-improving schemes, namely the
evolution as a follow-up operator to improve the quality of best-so-far samples.
The performance of the proposed algorithm has been evaluated via a large set of computer simulations. The results demonstrate that our algorithm outperforms a number of state-of-the-art evolutionary algorithms with respect to the solution quality.
2.
Problem Description
A communications network can be represented by a directed graph G = (V, E), where V is the set of nodes and E is the set of links, respectively. Number all links in G, where the i-th link is denoted by ei∈E. Link ei is associated with a maximum bandwidth Bimax and an occupied bandwidth Bioccu, where Bimax ≥ Bioccu. So, the available bandwidth of ei is Bimax-Bioccu. In a NCM scenario, there is a source node s∈V, a set of receivers T = {t1,…, td}, tk∈V, and an expected data rate R indicating how fast the original data is to be delivered to each node tk∈T from s [25][26].
If there is a NCM request, the task is to select a connected subgraph from graph G to support the NCM data transmission process [25][26]. This NCM subgraph, denoted by Gs→T, is composed of multiple paths, where each path originates from the source s and terminates at one of the receivers, e.g. tk∈V. For two arbitrary paths, if they are connected to the same receiver and do not share any common link, they are referred to as link-disjoint paths. In an arbitrary NCM subgraph, identical bandwidth consumption, e.g. Bs→T, incurs in each link during the NCM data transmission in Gs→T. If there are R link-disjoint paths constructed from the source to each receiver, the total bandwidth between the source and each receiver is R·Bs→T.
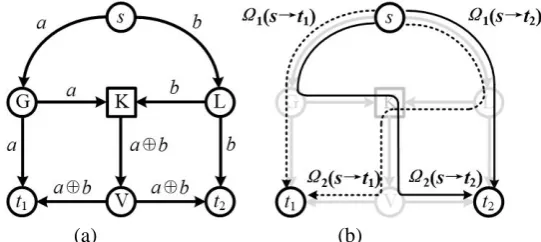
We call a node in G as a coding node if it is capable of performing coding operations. A coding node has at least two incoming links from which information can be mathematically recombined (i.e. coded); we refer to an outgoing link of a coding node in G as a coding link if the coded information by the coding node is output via this link; an intermediate node in G is called a merging node as long as it is non-source, non-receiver and with multiple incoming links. In fact, coding operations are performed at only merging nodes. More descriptions can be found in [25][26].
coding operation recombining a and b into a new bit a○+b (symbol ○+ indicates an exclusive-OR operation). Fig.1(b) shows the corresponding NCM subgraph which is composed of four paths, namely Ω1(s→t1), Ω2(s→t1), Ω1(s→t2) and Ω2(s→t2). Note that each of the four paths is from source s to a receiver;
paths to the same receiver, e.g. Ω1(s→t2) and Ω2(s→t2), are link-disjoint.
[image:6.595.160.431.181.302.2](a) (b)
Fig. 1 An example NCM scenario. (a) Data delivery. (b) The NCM subgraph.
We define as below a list of notations used to formulate the load balancing optimization problem. - s: the source node in G(V, E);
- T ={t1, t2, …, td}: the set of receivers, where d = |T| represents the number of receivers; - Gs→T: the NCM subgraph to support the NCM data transmission from s to T;
- ei: the i-th link in E, i = 1,…, |E|, where |E| is the number of links in E; - Bimax: the maximum bandwidth of ei;
- Bioccu: the occupied bandwidth of ei prior to the NCM, where Bimax ≥ Bioccu; - Bs→T: the bandwidth consumed on each link of Gs→T;
- ωi : the bandwidth utilization ratio of ei∈E; It is the ratio of the currently occupied bandwidth to
the maximum bandwidth;
- β: the variance of the bandwidth utilization ratios over all links in G(V, E); - Φ: the expected number of link-disjoint paths in Gs→T;
- Ωi(s→tk): the i-th path from s to tk in Gs→T, i=1, …, Φ. There are Φ paths to each receiver; - ρi(s→tk): the link set of path Ωi(s→tk);
- r(s→tk) : the achievable bandwidth from s to tk∈T in Gs→T;
known, one is able to have an overall picture of the bandwidth utilization condition and thus the distribution of network traffic. The variance of BURs over all links can well reflect to what degree the network traffic is balanced. Based on this idea, this paper considers the variance of BURs as the only objective to minimize.
The task is to find an appropriate NCM subgraph in G(V, E), satisfying a number of constraints, while minimizing the variance of the set of BURs. A smaller variance indicates a more balanced load in NCM. Note that, as BURs are no larger than 1, their variance may be a very small value. In order to distinguish among different variances clearly, we amplify the variance value by a sufficiently large constant Z. The objective obj and all constraints are shown below.
Minimize:
𝑜𝑏𝑗 = Z ∙ 𝛽 (1)
where 𝛽 =|𝐸|1 ∑|𝐸|𝑖=1(𝜔𝑖− 𝜔)2 (2)
𝜔̅ = (∑𝑖∈|𝐸|𝜔𝑖) |𝐸|⁄ (3)
𝜔𝑖= (𝐵𝑠→𝑇∙ 𝑐𝑖+ 𝐵𝑖𝑜𝑐𝑐𝑢)/𝐵𝑖𝑚𝑎𝑥 (4)
𝑐𝑖= {0, 𝑜𝑡ℎ𝑒𝑟𝑤𝑖𝑠𝑒1, 𝑒𝑖 ∈ 𝐺𝑠→𝑇 (5)
Subject to: 𝑟(𝑠 → 𝑡𝑘) = 𝛷 · 𝐵𝑠→𝑇, ∀𝑡𝑘∈ 𝑇 (6)
𝐵𝑠→𝑇+ 𝐵𝑖𝑜𝑐𝑐𝑢≤ 𝐵𝑖𝑚𝑎𝑥, ∀𝑖 = {1, … , |𝐸|} (7)
𝜌𝑚(𝑠 → 𝑡𝑘) ∩ 𝜌𝑛(𝑠 → 𝑡𝑘) = ∅, ∀𝑚, 𝑛 ∈ {1, … , 𝛷}, 𝑚 ≠ 𝑛 (8)
by Gs→T incur bandwidth consumption Bs→T; Constraint (6) restricts that Φ link-disjoint paths are to be constructed from s to each of the receivers, so the achievable bandwidth r(s→tk) is Φ times of Bs→T. The bandwidth constraint is defined in Constraint (7); Constraint (8) specifies that any two paths in Gs→T, terminating at the same receiver, cannot share any common link.
3.
An overview of the original PBIL
As a class of estimation of distribution algorithms, PBIL has been reported to achieve excellent optimization performance when dealing with the network coding resource minimization problems. In [43], PBIL is adapted for the network coding resource minimization (NCRM) problem, where an entropy-based restart scheme is devised to improve the global searching ability and hence helps the approach to explore promising areas in the search space. The proposed algorithm performs significantly better than genetic algorithms and quantum-inspired evolutionary algorithms regarding the solution quality and computational time. In [44], a variant of the NCRM problem is formulated for delay sensitive applications (e.g. video conferencing), where in addition to the data rate and link-disjoint constraints, the end-to-end delay is also considered. A novel PBIL is developed to tackle the delay-constrained NCRM problem, where a new probability vector update scheme is used to balance global exploration and local exploitation. The proposed algorithm in this paper is based on the framework of PBIL.
Different from algorithms that manipulate explicit population (e.g. genetic algorithm), PBIL maintains a real-valued probability vector (PV) [3]. As the search progresses, PV is gradually shifted to represent solutions with better fitness, based on statistic information collected during the evolution. PV could thus generate promising samples with increasingly higher probabilities. At each generation, PV is updated by means of learning from the best-so-far samples. After that, mutation might adjust PV so as to avoid local optima. More details can be found in [3].
Fig. 2 illustrates the pseudo-code of the original PBIL. Denote PV at generation k by P(k) = {P1k, …,P
Lk}, where L is the encoding length of solutions and Plk is the probability of obtaining value ‘1’ at the l-th position, 1≤l≤L. Let B(k) = {B1k, …,B
Lk} be the best-so-far sample at generation k and α the learning rate, respectively. PV at generation k is updated by Eq. (9).
During the evolution of PV, mutation could be applied to alleviate the prematurity of the search, thus improving the global exploration of PBIL [3]. Random probability shift is commonly used to introduce a small amount of variance to a number of selected positions in PV, which could help to avoid local optima. Let σ ∈ (0,1) denote the probability shifting at each position. Eq. (10) is adopted to each selected Plk[3].
Plk = (1.0 − ) Plk + frnd (10)
where frnd is either 0.0 or 1.0, randomly generated with equal probabilities.
Initialization. 1. Set k = 0.
2. For l = 1 to L, Do set Plk = 0.5. Hence, P(k) is initialized as {0.5,…,0.5}. 3. Sample a set S(k) of N solutions from P(k).
Repeat
4. Set k = k + 1.
5. Find the best sample B(k) from B(k-1)S(k-1). 6. Update P(k) by Eq. (9).
7. Mutate P(k) by Eq. (10).
8. Sample a set S(k) of N solutions from P(k). Until when the stopping condition is met 9. Output the best sample B(k).
Fig. 2 Pseudo-code of the original PBIL [3].
4.
The proposed PBIL
Firstly, the individual representation is introduced briefly. Then, two novel schemes, namely the bi-PV co-evolution scheme and the local search heuristic, are described in detail. Finally, the pseudo-code of the proposed algorithm is given.
4.1 Individual representation and evaluation
[image:9.595.98.484.251.450.2]able to clearly show how information flows pass each merging node [28]. Due to its popularity and simplicity, the BLS method is adopted for individual representation in the paper, detailed as follows.
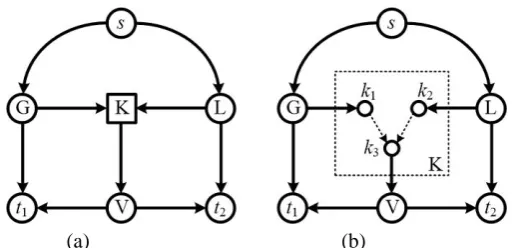
GD decomposes every merging node in a network G into a number of auxiliary nodes and auxiliary links so that all possible routes passing by each merging node are clearly illustrated. Suppose a merging node M has IM incoming links and OM outgoing links. By using GD, node M is first decomposed into IM incoming auxiliary nodes and OM outgoing auxiliary nodes. Then, an auxiliary link is added between any pair of incoming and outgoing auxiliary nodes within M. In addition, the original incoming links flowing into node M are redirected to the IM incoming auxiliary nodes. Similarly, those outgoing links originally connected to M are redirected to the OM outgoing auxiliary nodes. In this way, every merging node in G is decomposed and a decomposed graph GGD is constructed.
Fig. 3(b) shows the decomposed graph for Fig. 3(a), where node K is the only merging node, node s is the source and t1 and t2 are receivers, respectively. By using GD, K is decomposed into three auxiliary nodes in Fig. 3(b), namely the incoming auxiliary nodes k1, k2, and the outgoing auxiliary node k3. Two auxiliary links, i.e. k1→k3, and k2→k3, are inserted between each pair of incoming and outgoing auxiliary nodes within K. Besides, the original links, i.e. G→K, L→K, and K→V, connecting to K are redirected to auxiliary nodes, k1, k2, and k3.
(a) (b)
Fig. 3 An example of GD. (a) Original graph G. (b) Decomposed graph GGD
BLS representation is based on the decomposed graph GGD [26]. An individual is represented by a string of binary variables, each binary code associated with one of the auxiliary links between incoming and outgoing auxiliary nodes. Value ‘1’ and ‘0’ indicate the associated auxiliary link in GGD is active and inactive, respectively. An active link allows information to pass by, while an inactive one does not. Using BLS, each individual x corresponds to an explicit decomposed graph GGD(x).
[image:10.595.169.426.459.583.2]resulting NCM subgraph obtained from GGD(x) meets the bandwidth (Constraint (7)) and link-disjoint (Constraint (6)) property requirements. If x is feasible, the standard deviation β of BURs over all links in G is then computed (Eq. (2)) as the fitness value obj of x (Eq. (1)); otherwise, a sufficiently large value is assigned to x so that feasible and promising individuals are more competitive than infeasible ones during the search. Note that the Goldberg algorithm, a commonly used max-flow algorithm is adopted to calculate the max-flow between source s and receiver tk [12].
4.2 The bi-PV co-evolution scheme
The original PBIL maintains one PV during the evolution [3]. However, with a single PV, the search may be easily trapped into local optima. This is because only the best sample imposes a great impact on only one PV to guide the search exploring unknown areas in the search space. Quite often the best sample is a local optimum or near local optima, thus the search guided by PV is likely to be stuck into a small search region.
To alleviate the prematurity and enhance the global exploration of PBIL, a number of diversity preservation schemes have been proposed. Among them, multiple PV evolution has drawn an increasing amount of research attention. Yang and Yao [49] presented a dual PBIL where two PVs were operated and dual to each other regarding the central point in the genotype space. This helped to improve the adaptability of PBIL in dynamic environments. In [36] and [6], multiple PVs were employed to maintain a high level of population diversity, which was useful for designing appropriate trusses and water distribution networks, respectively. In addition, updating PV with multiple samples also demonstrated to enhance the optimization performance of PBIL. The statistical information, which is referred to as the Hebbian-inspired rule, is extracted from multiple samples and adopted to drive the search exploring areas of interests simultaneously [13][43].
also applied to introduce variance to PV, with the aim of avoiding the premature convergence.
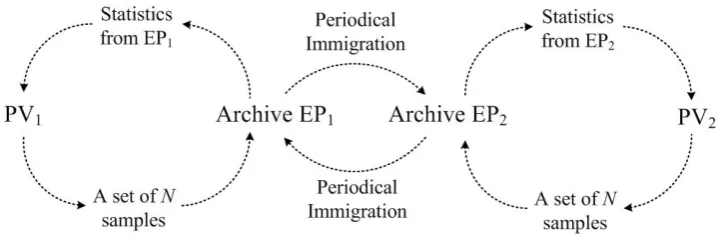
The proposed scheme is illustrated in Fig. 4. The two PVs, namely PV1 and PV2, evolve independently. Each PV, when sampled, generates a set of N samples/individuals at each generation. Those fitter samples are used to update the individuals in the external population (EP), ensuring that the fittest individuals found so far are all kept in EP. The statistical information is extracted from each EP and utilized to update the corresponding PV. Mutation in Eq.(10) is then performed on each PV. After a fixed number of generations (e.g. every 5 generations in this paper), immigration is launched, where a proportion of individuals are randomly selected from each EP to migrate between EP1 and EP2. Detailed pseudo-code can be found in Subsection 4.4.
Fig. 4 The bi-PV co-evolution (BPVCE) scheme.
Denote PV1 and PV2 by P1(k) and P2(k), respectively. Let EP1 = {Y1EP1, Y2EP1,…, YNEP1} and EP2 = {Y1EP2, Y2EP2,…, YNEP2} be the two EPs, where N is the number of individuals in EPj and YiEPj represents the i-th individual in EPj, j∈{1, 2}. Let PEP1 and PEP2 be the statistical information extracted from EP1 and EP2, respectively. Let α denote the learning rate. PV1 and PV2 are updated by the Eq. (11)-(14).
P1(k) = (1.0 − ) P1(k-1) + PEP1, (11)
PEP1=N1∙∑Ni=1YiEP1 (12)
P2(k) = (1.0 − ) P2(k-1) + PEP2, (13)
PEP2=1N∙∑Ni=1YiEP2 (14)
[image:12.595.117.478.302.419.2]With multiple best individuals used for updating the PVs, the search is less likely to get stuck into local optima, and hence promising areas in the search space could have more chance to be discovered and explored. During the co-evolution, random immigrants possibly bring different genes to each EP, also helping to diversify the population and reduce the risk of premature convergence. The bi-PV co-evolution scheme helps gain better performance as observed in Section 5.
4.3 The local search heuristic
As aforementioned, each feasible individual x corresponds to an explicit decomposed graph GGD(x), where a valid NCM subgraph Gs→T(x) is found. Different NCM subgraphs with different fitness may be constructed within the same GGD(x), thus different search techniques have been devised to search for better NCM subgraphs based on the given GGD(x). Kim et al [28] devised a greedy sweep operator and launched it at the end of evolution to improve the best individual found. Xing et al [45][47][48] developed a number of local search procedures for the purpose of solution quality improvement. All attempts above were reported to greatly enhance the performance of the corresponding algorithms. However, the techniques above were exclusively designed for the network coding resource minimization problem and cannot be used for the problem concerned in this paper.
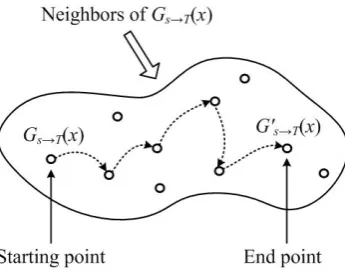
Fig. 5 An illustrative example of LSH.
Assume there are H incoming auxiliary links, ε1, ε2,…, εH, in Gs→T(x). Obviously, these links also belong to GGD(x) since Gs→T(x) is a subset of GGD(x). Denote a temporary GGD(x) and a new NCM subgraph by GGDtemp(x) and Gs→Tnew(x), respectively. Note that Gs→Tnew(x) is found from a temporary decomposed graph GGDtemp(x). Let ETAL be a temporary auxiliary link set, where each element in ETAL is an auxiliary link traversed already. Besides, rnd is a random integer from {1, …, H}, representing the index of an auxiliary link. Hence, εrnd is the rnd-th incoming auxiliary link. Let |ETAL| be the cardinality of ETAL. We have Ø ≤ |ETAL| ≤ H, where Ø is an empty set and H is the number of auxiliary links in Gs→T(x). Fig. 6
shows the pseudo-code of LSH, where symbol ‘\’ stands for the operation of exclusion (e.g. ‘\Y’ means with Y excluded, where Y can be a set, e.g. ETAL, or an element in a set, e.g. εrnd.).
1. Set GGDtemp(x) = GGD(x) and ETAL = ø; 2. whileETAL ≠ {1, …, H} do
3. Randomly generate an integer rnd ∈ {1, …, H}\ETAL; 4. Place rnd in ETAL;
5. Set GGDtemp(x) = GGDtemp(x)\εrnd;
6. if a new NCM subgraph Gs→Tnew(x) is found from GGDtemp(x) then 7. if obj(Gs→Tnew(x)) < obj(Gs→T(x)) then
8. Set obj(Gs→T(x)) = obj(Gs→Tnew(x)); 9. else Reinsert εrnd to GGDtemp(x);
10. else Reinsert εrnd to GGDtemp(x) 11. Output Gs→Tnew(x) as G’s→T (x)
Fig. 6 Pseudo-code of the proposed Local Search Heuristic (LSH).
[image:14.595.211.384.75.210.2] [image:14.595.92.494.465.658.2]removed from the temporary decomposed graph GGDtemp(x). If a new NCM subgraph is found from GGDtemp(x), i.e. Gs→Tnew(x), and this subgraph has better fitness value than the incumbent Gs→T(x), LSH accepts the deletion of the rnd-th auxiliary link and hence link εrnd is permanently removed from GGDtemp(x); otherwise, the rnd-th auxiliary link is reinserted into GGDtemp(x). So, the auxiliary link removal affects the temporary decomposed graph GGDtemp(x) and hence the resultant NCM subgraph. If a link deletion is accepted, the resultant Gs→Tnew(x) is recorded as the best so far NCM subgraph found by LSH. After LSH, the best NCM subgraph is output.
LSH aims to improve the quality of a selected NCM subgraph for finding a more balanced load in network G. It can be used either as a local search procedure to reinforce the local exploitation of the proposed PBIL or as a follow-up operator at the end of the evolution to improve the structure of a set of best-so-far solutions. LSH reveals its effectiveness in Section 5.
4.4 The pseudo-code of the proposed PBIL
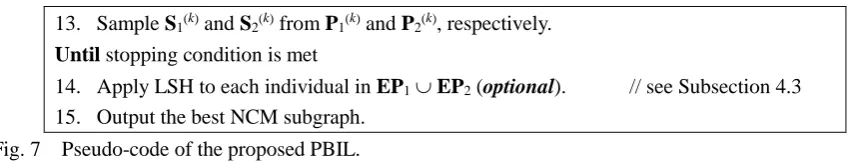
The proposed PBIL is featured with two performance-improving schemes, namely the bi-PV co-evolution scheme and the local search heuristic (LSH). Assume the two EPs have the same number of samples/individuals which is denoted by NEP. Let NSS be the number of samples in both sampling sets, S1(k) and S2(k). Let NIMMI be the number of random immigrants selected from each EP. The detailed pseudo-code of the proposed algorithm is shown in Fig.7.
Initialization.
1. Set k = 0.
2. Set EP1 = Ø and EP2 = Ø.
3. Set P1(k) = {0.5, …, 0.5} and P2(k) = {0.5, …, 0.5}, respectively. // see Section 3 4. Sample S1(k) and S2(k) from P1(k) and P2(k), respectively. // see Section 3 Repeat
5. Set k = k + 1.
6. Evaluate each individual in S1(k) and S2(k). // see Subsection 4.1 7. Apply LSH to each selected individual (optional). // see Subsection 4.3 8. Update EP1 and EP2 with the best NEP samples from EP1S1(k-1) and EP2S2(k-1),
respectively. // see Subsection 4.2 9. if immigration condition is met then // see Subsection 4.2 10. Exchange NIMMI selected individuals between EP1 and EP2.
13. Sample S1(k) and S2(k) from P1(k) and P2(k), respectively. Until stopping condition is met
14. Apply LSH to each individual in EP1 EP2 (optional). // see Subsection 4.3 15. Output the best NCM subgraph.
Fig. 7 Pseudo-code of the proposed PBIL.
As mentioned in Subsection 4.1, the individual representation is based on the BLS encoding. In the initialization, both external populations, EP1 and EP2, are set to be empty; and for each PV, the value of each position is set to 0.5; two sampling sets, S1(k) and S2(k), are filled with individuals sampled from P1(k) and P2(k), respectively. An all-one individual, i.e. ‘11…1’ is inserted into each EP to ensure that the search starts with at least one feasible individual [45]. A sufficiently large value is set to each infeasible individual as its fitness value.
In the main loop, after fitness evaluation, LSH may be applied to improve each individual in S1(k) and S2(k). LSH helps to enhance the local exploitation, at the expense of additional computational time. In Step 8, each EP is updated by promising individuals generated in the associated sampling set at generation k. In Steps 9 and 10, random immigrants are exchanged between the two EPs. Note that we set NIMMI = NSS/10 and the interval between consecutive immigrants to be 5 in this paper. In Step 11, each PV is updated by the extracted statistics from its associated EP. Mutation operations are then applied to P1(k) and P2(k), according to Eq. (10).
The termination condition is that the pre-defined number of generations, denoted by GMAX, is achieved. At the end of evolution, LSH might be applied to each individual in EP1 and EP2 as a follow-up operator, with the aim of furthering improving the obtained NCM subgraphs.
5.
Performance Evaluation
In this section, we first introduce the test instances for evaluating the performance of the proposed PBILs. Then, we investigate the effectiveness of the BPVCE scheme and LSH, respectively. Finally, we compare the proposed algorithms with a number of state-of-the-art EAs with respect to the optimization performance gained.
5.1 Test instances
[image:16.595.75.502.69.150.2]The fixed networks are Fx1 (3-copy), Fx2 (7-copy), Fx3 (15-copy) and Fx4 (31-copy) networks, respectively. The random ones Rdx are directed networks with from 20 to 60 nodes. Both the fixed and random networks have been widely adopted to compare performance of EAs on a number of network coding related optimization problems (e.g. [45][46]). All instances and their parameters are shown in Table 1. In terms of the objective function of the problem concerned in this paper, a smaller value indicates a more balanced network load while supporting the NCM; a larger value, however, leads to a weak load balancing performance (see Section 2). All experiments were run on a Windows XP computer with Intel(R) Core(TM) E8400 3.0GHz, 2G RAM. For performance comparison, each algorithm is run 30 times (unless stated otherwise) on each instance.
Table 1 Test Networks and Their Parameters [45].
Networks
Original network G Decomposed graph GGD
nodes links Receivers rate nodes links
auxiliary links
Fx1 25 36 4 2 49 68 32
Fx2 57 84 8 2 117 164 80
Fx3 121 180 16 2 253 356 176
Fx4 249 372 32 2 617 740 368
Rd1 20 37 5 3 54 81 43
Rd2 20 39 5 3 65 89 50
Rd3 30 60 6 3 94 146 86
Rd4 30 69 6 3 113 181 112
Rd5 40 78 9 3 124 184 106
Rd6 40 85 9 4 91 149 64
Rd7 50 101 8 3 178 246 145
Rd8 50 118 10 4 194 307 189
Rd9 60 150 11 5 239 385 235
Rd10 60 156 10 4 262 453 297
5.2 The effectiveness of the BPVCE scheme
In the proposed PBILs, the bi-PV co-evolution (BPVCE) scheme aims to maintain a relatively high level of diversity, by striking a balance between the global exploration and local exploitation (see Subsection 4.2 for details). To evaluate the performance of the BPVCE scheme, we compare the following two PBILs on all test networks.
- PBIL: PBIL with a single PV [43]. It uses the Hebbian-inspired rule to prevent the search from
converging rapidly to local optima.
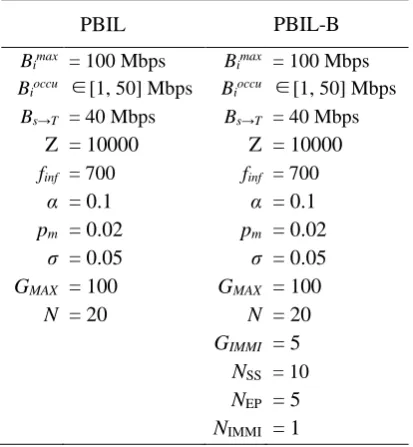
[image:17.595.112.480.319.563.2]The parameter settings are shown in Table 2, including the maximum bandwidth for link ei∈E, i.e. Bimax, the occupied bandwidth of ei∈E prior to the construction of NCM, i.e. Bioccu, the bandwidth consumption on each link of a NCM subgraph, i.e. Bs→T, the amplifying factor Z, the fitness value of infeasible individual finf, the learning rate α, the mutation probability at each locus of PV pm, the probability shifting at each locus σ, the predefined number of generations GMAX, the population size N, the immigration interval GIMMI, the size of each sampling set NSS, the size of each EP NEP, and the number of random immigrants NIMMI.
Table 2 The Parameter Setting of The Two PBILs.
PBIL PBIL-B
Bimax = 100 Mbps Bimax = 100 Mbps
Bioccu ∈[1, 50] Mbps Bioccu ∈[1, 50] Mbps
Bs→T = 40 Mbps Bs→T = 40 Mbps
Z = 10000 Z = 10000
finf = 700 finf = 700
α = 0.1 α = 0.1
pm = 0.02 pm = 0.02
σ = 0.05 σ = 0.05
GMAX = 100 GMAX = 100
N = 20 N = 20
GIMMI = 5
NSS = 10
NEP = 5 NIMMI = 1
To evaluate the proposed scheme regarding the quality of the best solutions and the convergence, the following metrics are adopted in Section 5.
- Mean and standard deviation (SD) of the best solutions found over 30 runs. One best solution is
obtained in a single run. The mean and SD values are of vital importance to show the overall performance of an EA.
- Evolution of the average fitness in each generation, averaged over 30 runs (also referred to as the
curve of the average fitness value). This metric reflects the convergence of an EA.
- Evolution of the best fitness in each generation, averaged over 30 runs, which is also referred to as
the curve of the best fitness value. It is another convergence indicator for an EA.
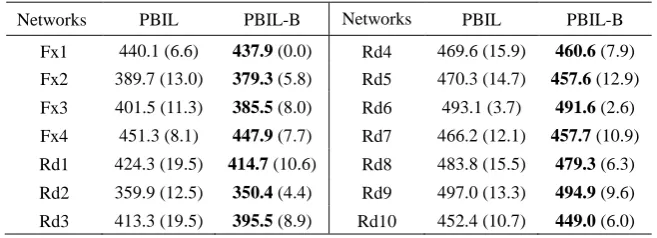
[image:18.595.195.402.283.507.2]is easy to observe that PBIL-B is always smaller, thus is better than PBIL in terms of the mean and SD values, indicating a better load balancing performance and a more stabilized optimization performance on all test instances. With only one PV, PBIL converges quickly since a rapid loss in global exploration causes prematurity. However, with two evolving PVs with periodical exchange of random immigrants, the population diversity of PBIL-B is retained at a relatively high level and the search is thus left with more opportunities exploring unknown areas. This increases the probability of locating promising areas in the search space.
Table 3 Mean values (SDs) obtained by PBIL and PBIL-B (Best results are in bold).
Networks PBIL PBIL-B Networks PBIL PBIL-B Fx1 440.1 (6.6) 437.9 (0.0) Rd4 469.6 (15.9) 460.6 (7.9) Fx2 389.7 (13.0) 379.3 (5.8) Rd5 470.3 (14.7) 457.6 (12.9) Fx3 401.5 (11.3) 385.5 (8.0) Rd6 493.1 (3.7) 491.6 (2.6) Fx4 451.3 (8.1) 447.9 (7.7) Rd7 466.2 (12.1) 457.7 (10.9) Rd1 424.3 (19.5) 414.7 (10.6) Rd8 483.8 (15.5) 479.3 (6.3) Rd2 359.9 (12.5) 350.4 (4.4) Rd9 497.0 (13.3) 494.9 (9.6) Rd3 413.3 (19.5) 395.5 (8.9) Rd10 452.4 (10.7) 449.0 (6.0)
To illustrate the convergence of PBIL and PBIL-B, we plot the evolution of the average and best fitness values, averaged over 30 runs for two fixed networks and four random networks, in Fig.8 and Fig.9, respectively. In Fig.8, it is clear that PBIL-B (solid line) decreases slower than PBIL (dot line), especially after around 30 generations, indicating it has a more diversified population after a number of iterations, which leads to a finer global exploration before the search intensifies on local exploitation. In terms of the best fitness values averaged over generations, in Fig.9, at the beginning of the evolution PBIL and PBIL-B decline at similar speed; in the middle of the evolution, PBIL decreases faster than PBIL-B; and in the last stage, PBIL converges rapidly while PBIL-B still has the potential to explore thus gains better solution quality. To summarize, compared with PBIL, PBIL-B has a more diversified population and a slower convergence, due to the outstanding contribution from the BPVCE scheme.
5.3 The effectiveness of LSH
[image:19.595.133.462.274.393.2]their fitness values, i.e. objBEF and objAFT. Note that the criterion for accepting a new NCM subgraph is if and only if the new one has better fitness value than the original one. We define the quality improving coefficient Δ (%) after LSH using Eq.(15), to quantify the improvement.
Δ = (objBEF − objAFT)/objBEF (15)
(a) (b)
(c) (d)
(e) (f)
[image:20.595.71.494.226.742.2](e) Rd5. (f) Rd7.
Table 4 shows the results of objBEF, objAFT, and Δ for all instances. For each network, all of the five samples have been improved in terms of the fitness value after using LSH. In addition, Fig.10 clearly shows the distribution of Δ, which indicates the effectiveness of LSH. In the next subsection, LSH is incorporated into the evolutionary framework and validated with respect to the performance enhancement of the proposed PBIL.
(a) (b)
(c) (d)
(e) (f)
[image:21.595.82.503.243.748.2]Rd5. (f) Rd7.
5.4 Overall performance comparison
This section evaluates the overall performance of the proposed PBILs against eight state-of-the-art EAs in the literature. All algorithms for comparison are listed below.
- GA1: GA based on BLS representation [28].
Table 4 Fitness values before and after using LSH
Networks
Sample 1 Sample 2 Sample 3 Sample 4 Sample 5
objBEF objAFT Δ(%) objBEF objAFT Δ(%) objBEF objAFT Δ(%) objBEF objAFT Δ(%) objBEF objAFT Δ(%)
Fx1 554.5 514.1 7.3 540.3 523.5 3.1 503.5 492.9 2.1 492.0 481.5 2.1 487.3 476.8 2.2 Fx2 562.4 476.6 15.3 531.7 501.0 5.8 530.3 509.3 4.0 506.9 506.3 0.1 490.7 480.5 2.1 Fx3 549.5 511.1 7.0 511.1 488.5 4.4 524.8 508.4 3.1 524.6 523.6 0.2 498.7 465.5 6.7 Fx4 561.8 547.4 2.6 558.4 542.6 2.8 554.2 540.6 2.5 539.3 529.9 1.7 530.0 520.5 1.8 Rd1 633.1 586.5 7.4 629.8 602.5 4.3 623.9 602.5 3.4 606.2 604.1 0.3 565.4 523.9 7.3 Rd2 607.7 562.1 7.5 584.8 481.2 17.7 579.1 563.9 2.6 578.0 508.1 12.1 541.6 508.1 6.2 Rd3 564.9 517.2 8.4 562.6 553.8 1.6 560.0 545.8 2.5 547.9 525.6 4.1 543.5 522.7 3.8 Rd4 621.1 584.7 5.9 620.6 616.2 0.7 607.8 586.1 3.6 592.3 573.4 3.2 559.0 544.4 2.6 Rd5 696.7 599.4 14.0 652.3 635.0 2.7 650.0 606.7 6.7 597.5 587.1 1.7 583.2 580.7 0.4 Rd6 613.1 561.4 8.4 591.4 539.4 8.8 578.3 545.8 5.6 575.1 524.0 8.9 545.3 525.0 3.7 Rd7 609.8 598.4 1.9 569.3 568.5 0.1 561.5 548.5 2.3 560.8 551.3 1.7 553.8 546.7 1.3 Rd8 666.0 660.8 0.8 654.3 627.5 4.1 643.8 616.8 4.2 639.8 605.5 5.4 595.4 581.6 2.3 Rd9 632.8 581.1 8.2 630.4 627.1 0.5 628.7 584.3 7.1 594.8 581.1 2.3 586.8 581.1 1.0 Rd10 591.4 585.2 1.0 570.6 554.8 2.8 569.7 535.7 6.0 548.4 547.9 0.1 544.8 524.7 3.7
(a) (b)
Fig. 10 Quality improving coefficient from LSH. (a) Instances Fx1 to Rd3. (b) Instances Rd4 to Rd10.
- GA2: GA based on block transmission state (BTS) representation [26]. An individual (solution) X
consists of a number of binary arrays, each determining the states of the auxiliary links heading to a certain outgoing auxiliary node in the decomposed graph. For each array, once there are at least two 1’s, the
0% 5% 10% 15% 20%
Fx1 Fx2 Fx3 Fx4 Rd1 Rd2 Rd3
Sample1
Sample2
Sample3
Sample4
Sample5
0% 5% 10% 15% 20%
Rd4 Rd5 Rd6 Rd7 Rd8 Rd9 Rd10
Sample1
Sample2
Sample3
Sample4
[image:22.595.77.519.247.654.2]remaining 0’s are replaced with 1’s.
-QEA1: Quantum-inspired evolutionary algorithm (QEA) [42]. A number of quantum-bit based
individuals are maintained, each represents a probabilistic distribution model over the genotype space. Based on the BLS representation, QEA1 adopts rotation angle step (RAS) and quantum mutation probability (QMP) to update individuals, where RAS is randomly generated and QMP is based on the current fitness value of the associated chromosome.
- QEA2: QEA in [20]. Different from QEA1, QEA2 adjusts the values of RAS and QMP according
to the current and previous fitness values of the associated chromosome.
- PSO1: a binary version of particle swarm optimization (PSO) proposed by Kennedy and Eberhart
[23]. Inspired from the social behavior of bird flocking and fish schooling, PSO evolves a set of particles flying around in the search space for finding optimal solutions. We re-implement PSO1 for performance comparison purpose.
- PSO2: An improved version of PSO [33]. Different from PSO1, PSO2 utilizes a V-shaped transfer
function to map a continuous search space to a discrete search space. PSO2 has been reported to gain decent performance in discrete optimization problems. It is re-implemented for addressing the load balancing problem concerned in this paper.
- UMDA: univariate marginal distribution algorithm (UMDA) in [31]. UMDA is another estimation
of distribution algorithm (EDA) with first-order statistics only. The major difference between UMDA and PBIL is that the former uses the statistical information of the last generation to generate a new generation of samples.
- PBIL: PBIL developed for minimizing network coding resources [43].
- PBIL-BL: PBIL with the BPVCE scheme and LSH integrated into the fitness evaluation as a local
search operator.
- PBIL-BQ: PBIL with the BPVCE scheme and LSH launched after the evolution as a quality
improving operator for best solutions in EPs.
Table 5 The Parameter Setting of GA1, GA2, PBIL-BL and PBIL-BQ.
GA1 GA2 PBIL-BL PBIL-BQ
N = 20 N = 20 N = 20 N = 20
GMAX = 200 GMAX = 200 GMAX = 200 GMAX = 200
pc = 0.8 pc = 0.8 α = 0.1 α = 0.1
pm = 0.006 pm = 0.012 pm = 0.02 pm = 0.02
GIMMI = 5 GIMMI = 5
NSS = 10 NSS = 10
NEP = 5 NEP = 5
NIMMI = 1 NIMMI = 1
Table 6 Mean values (SDs) obtained by different EAs (Best results are in bold)
Networks GA1 GA2 QEA1 QEA2 PSO1 PSO2 UMDA PBIL PBIL-BL PBIL-BQ
Fx1 452.9
(38.0) 461.8 (47.2) 439.8 (3.7) 441.7 (8.8) 441.2 (4.8) 437.9 (0.1) 469.8 (25.5) 437.9 (0.1) 437.9 (0.1) 437.9 (0.1)
Fx2 438.9
(58.9) 438.6 (58.6) 416.4 (14.2) 441.0 (17.9) 436.1 (14.8) 409.8 (14.8) 438.6 (22.0) 379.0 (6.1) 373.4 (1.0) 374.5 (3.5)
Fx3 425.3
(33.1) 448.2 (47.9) 449.8 (12.3) 476.4 (16.9) 506.1 (15.5) 494.0 (22.0) 463.1 (16.0) 384.8 (12.8) 370.9 (1.3) 374.1 (4.9)
Fx4 507.1
(27.6) 541.6 (20.0) 521.2 (6.7) 531.1 (9.4) 558.4 (0.0) 556.6 (9.9) 508.8 (14.6) 450.7 (13.3) 411.8 (5.1) 418.1 (5.2)
Rd1 453.0
(55.7) 483.9 (48.7) 431.9 (15.1) 440.0 (17.7) 444.2 (15.4) 430.7 (13.7) 488.7 (26.3) 418.2 (9.4) 412.1 (10.7) 417.0 (9.9)
Rd2 406.2
(63.1) 385.0 (43.5) 388.9 (26.1) 410.6 (39.2) 396.3 (19.5) 367.8 (18.5) 433.4 (37.7) 355.8 (8.4) 348.6 (2.1) 350.4 (5.3)
Rd3 428.5
(42.0) 429.4 (44.6) 432.6 (20.1) 431.6 (18.2) 457.2 (9.2) 416.8 (14.8) 461.1 (14.2) 419.5 (18.0) 384.5 (4.6) 390.1 (6.8)
Rd4 496.9
(60.0) 497.4 (65.7) 484.2 (18.9) 490.2 (18.7) 512.2 (14.2) 474.7 (12.7) 522.7 (22.4) 475.3 (14.7) 453.1 (5.2) 454.8 (4.6)
Rd5 516.5
(75.3) 482.9 (57.9) 501.5 (23.4) 507.2 (16.3) 537.0 (13.2) 491.3 (16.1) 533.3 (16.8) 471.2 (22.3) 433.1 (10.2) 437.6 (10.7)
Rd6 508.2
(35.8) 511.8 (38.0) 497.9 (7.4) 509.6 (18.1) 501.2 (6.7) 492.9 (3.1) 522.9 (23.3) 497.1 (5.3) 491.2 (2.7) 491.8 (2.5)
Rd7 470.5
(36.8) 476.9 (34.7) 484.9 (17.4) 485.6 (13.9) 505.7 (12.0) 475.6 (12.7) 507.5 (16.9) 469.8 (12.4) 431.7 (10.0) 442.5 (11.5)
Rd8 505.1
(67.6) 515.5 (70.7) 519.6 (17.7) 540.1 (21.2) 550.5 (11.9) 521.3 (15.6) 529.9 (19.0) 491.1 (15.1) 444.6 (8.0) 453.3 (7.4)
Rd9 520.2
(43.0) 526.0 (39.5) 541.3 (13.5) 552.1 (16.5) 558.5 (9.5) 539.3 (13.2) 540.8 (13.8) 504.9 (13.1) 470.0 (7.0) 472.3 (8.4)
Rd10 466.0
(40.7) 466.8 (22.8) 477.6 (13.3) 473.2 (10.3) 496.6 (7.9) 465.7 (9.3) 478.8 (16.3) 451.3 (7.5) 430.0 (3.7) 431.0 (4.1)
[image:24.595.149.446.91.226.2] [image:24.595.86.513.278.654.2]10 algorithms on six selected instances, i.e. Fx2, Fx3, Rd1, Rd3, Rd5 and Rd7, which also demonstrates the superiority of PBIL-BL and PBIL-BQ over the others.
(a) (b)
(c) (d)
(e) (f)
Fig. 11 Box plots of 10 algorithms on six instances. (a) Fx2. (b) Fx3. (c) Rd1. (d) Rd3. (e) Rd5. (f) Rd7.
[image:25.595.58.521.122.678.2]use of the problem-specific domain knowledge, LSH further improves the quality of each selected individual in terms of load balancing. Hence, no matter where it is incorporated, this operator helps to enhance the overall optimization performance of the proposed PBILs. Between PBIL-BL and PBIL-BQ, one can easily find that the former performs better with respect to the mean value and in some instances the difference is significant, e.g. Fx2, Fx3, Rd3, Rd7 and Rd8. One the one hand, at each generation, LSH is performed on each sample and this operator helps to reinforce the local exploitation of PBIL-BL. During the evolution, LSH helps to balance global exploration and local exploitation, thus resulting into a better optimization performance. On the other hand, LSH is launched after the evolution and only used to improve the quality of the solutions in EPs in PBIL-BQ. Hence, when comparing with PBIL-BL, PBIL-BQ is weaker.
Welch’s t-test (i.e. two-sample unpooled t-test with unequal variances [38]) is conducted to compare the proposed PBILs with the other algorithms in Table 7, where fitness values of the best solutions obtained are used to reflect the optimization performance of each EA. One-tailed t-test with 58 degrees of freedom at a 0.05 level of significance is used in this paper. The result of comparison between A1↔A2 is shown as “+” or “~” when A1 is significantly better than or statistically equivalent to A2, respectively. In Table 5, PBIL-BL and PBIL-BQ are the best two algorithms considering all test instances. Regarding PBIL-BL and PBIL-BQ, one can observe that the former overwhelms the latter in six instances, namely Fx2, Fx3, Rd2, Rd3, Rd7 and Rd8, while the two algorithms are statistically identical in the remaining instances.
Table 7 Results of t-test of PBIL-BL and PBIL-BQ compared against the other algorithms
Algorithms Fx1 Fx2 Fx3 Fx4 Rd1 Rd2 Rd3 Rd4 Rd5 Rd6 Rd7 Rd8 Rd9 Rd10
PBIL-BL↔GA1
PBIL-BL↔GA2
PBIL-BL↔QEA1
PBIL-BL↔QEA2
PBIL-BL↔PSO1
PBIL-BL↔PSO2
PBIL-BL↔UMDA
PBIL-BL↔PBIL
PBIL-BL↔PBIL-BQ
PBIL-BQ↔GA1
PBIL-BQ↔GA2
PBIL-BQ↔QEA1
PBIL-BQ↔QEA2
PBIL-BQ↔PSO1
[image:26.595.91.505.533.762.2]PBIL-BQ↔UMDA
PBIL-BQ↔PBIL
Computational time is one of the important performance metrics when investigating EAs. The average computational time (ACT) is collected in Table 8, showing that PBIL-BL always has the largest ACT. LSH is computationally expensive, when integrated into the fitness evaluation in PBIL-BL, it gains a decent performance but at the cost of significant amount of additional computational time. PBIL-BQ, on the other hand, invokes a very limited number of LSH thus has a much smaller ACTs than PBIL-BL. Compared with most of the other algorithms PBIL-BQ has an acceptable performance in terms of ACT given its superior performance on all the problem instances.
Considering the overall performance including the solution quality and ACT, PBIL-BQ shows to be an outstanding candidate for optimizing the problem concerned in the paper. Although PBIL-BL incurs significant amount of computational resources, it has the potential to be used if it is implemented within a framework of parallel computation.
Table 8 ACT values obtained by different algorithms (Sec.)
Networks GA1 GA2 QEA1 QEA2 PSO1 PSO2 UMDA PBIL PBIL-BL PBIL-BQ
Fx1 2.4 2.4 5.9 3.4 2.4 3.7 3.2 2.8 14.2 2.7
Fx2 6.2 7.2 13.3 9.6 10.8 8.2 13.3 12.2 47.0 11.7
Fx3 39.2 32.6 34.9 30.3 37.0 23.1 80.0 56.5 224.7 66.1
Fx4 123.9 86.6 148.9 111.1 134.9 102.6 566.3 403.2 1162.0 392.0
Rd1 3.1 3.1 5.7 5.0 4.1 3.9 6.2 3.9 16.0 3.6
Rd2 3.1 3.8 5.5 5.1 6.5 5.1 5.9 17.3 18.6 5.2
Rd3 6.7 6.5 12.3 13.9 15.9 11.6 10.3 39.0 41.2 10.0
Rd4 7.2 7.6 15.3 20.1 15.8 13.3 10.8 42.0 48.5 11.2
Rd5 9.7 11.9 14.8 18.2 18.5 15.1 14.5 64.9 66.8 12.4
Rd6 8.7 8.1 10.7 12.5 6.2 9.8 11.1 44.0 49.2 11.6
Rd7 18.0 18.3 23.7 30.6 32.1 21.7 24.6 24.0 125.5 24.0
Rd8 22.8 19.9 25.4 22.7 43.8 19.6 50.9 33.9 151.9 31.4
Rd9 35.0 31.5 35.2 32.7 63.1 29.3 77.5 48.2 210.1 52.6
Rd10 44.8 45.8 63.7 72.3 99.1 53.5 85.9 59.5 238.7 61.2
6.
Conclusions and Future Work
[image:27.595.94.503.413.629.2]schemes, namely, the bi-probability-vector co-evolution (BPVCE) scheme and the local search heuristic (LSH). In the BPVCE scheme, two PVs evolve in parallel and independently, with periodic exchange of random immigrants. This scheme maintains a relatively high level of population diversity, thus alleviates premature evolution and enhances global exploration. LSH makes use of problem-specific domain knowledge to improve the quality of each selected individual. It operates in a greedy manner and could be launched either in the fitness evaluation as a local search operator or after the evolution as a quality-improving operator for the best-so-far solutions. When used in fitness evaluation, LSH helps strengthening the local exploitation. With the two schemes, where LSH is used at each fitness evaluation, PBIL-BL is able to strike a balance between local exploitation and global exploration, thus obtains the best
performance in terms of the solution quality compared with eight state of the art EAs. However, PBIL-BL incurs too much computational cost, making it not appropriate for real-time application. When LSH is used after the evolution, it can improve the quality of best solutions at a relatively low cost. With the BPVCE scheme and LSH launched after the evolution, PBIL-BQ gains an outstanding optimization performance and acceptable computational time consumption compared against other EAs in the literature.
As aforementioned, LSH causes significant amount of computational cost if it is involved in the evolution. Undoubtedly, this presents quite a challenging problem when deploying PBIL-BL in real-world telecommunications networks, since it is crucial to respond quickly to a NCM request; otherwise, end users suffer from large latencies. In the future work, we will consider how to reduce the computational time of PBIL-BL. Fortunately, the intrinsic parallelism in PBIL-BL means for any two individuals at the same generation, their fitness values can be evaluated completely independent of each other. Hence, parallel computing is a promising framework to deploy PBIL-BL and significantly reduce computational time by dividing a complicated and time-consuming computing task into a number of parallel workflows and executing them in different computing units simultaneously. As an efficient open source parallel computing framework, Apache Spark [51], can be used for parallelization of PBIL-BL in the future.
Acknowledgements
This work was supported in part by National Natural Science Foundation of China (No.61401374), the Project-sponsored by SRF for ROCS, SEM, P. R. China and University of Nottingham, UK.
References
[1] R. Ahlswede, N. Cai, S. Y. R. Li, R. W. Yeung, Network information flow, IEEE Transactions on
Information Theory 46 (2000) 1204-1216.
[2] C. W. Ahn, J. C. Yoo, Multi-objective evolutionary approach to coding-link cost trade-offs in network
coding, Electronics Letters 48(2012) 1595-1596.
[3] S. Baluja, Population-based incremental learning: a method for integrating genetic search based function
optimization and competitive learning, Technical Report CMU-CS-94-163, Carnegie Mellon University,
1994.
[4] A. Benslimane, Multimedia multicast on the internet. ISTE, 2007.
[5] A.M. Bernardino, E.M.Bernardino, J.M.Sanchez-Perez, J.A. Gomez-Pulido, M.A.Vega-Rodriguez, A hybrid
population-based incremental learning algorithm for load balancing in RPR, in Proc. 3th International
Symposium on Applied Sciences in Biomedical and Communication Technologies (ISABEL2010), Rome,
Italy, 2010, pp.1-5.
[6] S. Bureerat, K. Sriworamas, Simultaneous topology and sizing optimization of a water distribution network
using a hybrid multiobjective evolutionary algorithm, Applied Soft Computing 13 (2013) 3693-3702.
[7] M. Carnero, J. Hernandez, M. Sanchez, A new metaheuristic based approach for the design of sensor
networks, Computers and Chemical Engineering 55 (2013) 83-96.
[8] K. Chi, C. Yang, X. Wang, Performance of network coding based multicast, IEE Proceedings-
Communications153 (2006) 399-404.
[9] K. Fan, X, Wei, D. Long, A load-balanced route selection for network coding in wireless mesh networks, in
Proc. 28th Conference on Computer Communications (INFOCOM 2009), Dresden, Germany, 2009.
[10]K.A. Folly, Multimachine power system stabilizer design based on a simplified version of genetic
algorithms combined with learning, in Proc. 13th International Conference on Intelligent Systems
[11]S. Ghebreab, C.C. Jaffe, A.W.M. Smeulders, Population-based incremental interactive concept learning for
image retrieval by stochastic string segmentations, IEEE Transactions on Medical Imaging, 23 (2004)
676-689.
[12]A. V. Goldberg, A new max-flow algorithm, Laboratory for Computer Science, MIT, 1985.
[13]C. Gonzalez, J.A. Lozano, P. Larranaga, Analyzing the population based incremental learning algorithm by
means of discrete dynamical systems, Complex Systems 12 (2000) 465-479.
[14]T. Gosling, N. Jin, E. Tsang, Population based incremental learning with guided mutation versus genetic
algorithms: iterated prisoners dilemma, in Proc. 2005 IEEE Congress on Evolutionary Computation
(CEC2005), Edinburgh, UK, 2005.
[15]M. Hauschild, M. Pelikan, An introduction and survey of estimation of distribution algorithms, Swarm and
Evolutionary Computation 1 (2011) 111-128.
[16]S.L. Ho, S. Yang, Y. Bai, J. Huang, A robust metaheuristic combing clonal colony optimization and
population-based incremental learning methods, IEEE Transactions on Magnetics 50 (2014). DOI:
10.1109/TMAG.2013.2283886.
[17]S.L. Ho, L. Zhu, S. Yang, J. Huang, A real coded population-based incremental learning for inverse
problems in continuous space, IEEE Transactions on Magnetics 51 (2015). DOI:
10.1109/TMAG.2014.2358628.
[18]Y. Hong, S. Kwong, Y. Chang, Q. Ren, Unsupervised feature selection using clustering ensembles and
population based incremental learning algorithm, Pattern Recognition 41 (2008) 2742-2756.
[19]I.H. Hou, Y.E. Tsai, T.F.Abdelzaher, I. Gupta, AdapCode: adaptive network coding for code updates in
wireless sensor networks, in Proc. 27th Conference on Computer Communications (INFOCOM 2008),
Phoenix, USA, 2008.
[20]Y. Ji, H. Xing, A memory-storable quantum-inspired evolutionary algorithm for network coding resource
minimization, in: Kita E. (Ed.), Evolutionary Algorithm. InTech, pp.363-380, 2011.
[21]D. Jiang, Z. Xu, W. Li, Z. Chen, Network coding-based energy-efficient multicast routing algorithm for
multi-hop wireless networks, The Journal of Systems and Software 104 (2015) 152-165.
[22]Y. Jin, R. Qu, J. Atkin, A population-based incremental learning method for constrained portfolio
optimization, in Proc. 16th International Symposium on Symbolic and Numeric Algorithms for Scientific
[23]J. Kennedy, R.C. Eberhart, A discrete binary version of the particle swarm algorithm, In Proc. 1997 IEEE
International Conference on System, Man and Cybernetics (SMC1997), Piscataway, USA, pp. 4104-4108,
1997.
[24]M. Kim, V. Aggarwal, V. O. Reilly, M. Médard, W. Kim, Genetic representations for evolutionary
optimization of network coding, in Proceedings of EvoWorkshops 2007, LNCS 4448, Valencia, 2007, pp
21-31.
[25]M. Kim, C. W. Ahn, M. Médard, M Effros, On minimizing network coding resources: An evolutionary
approach, in Proceedings of Second Workshop on Network Coding, Theory, and Applications (NetCod2006),
Boston, 2006.
[26]M. Kim, M. Médard, V. Aggarwal, U. M. O. Reilly, W. Kim, C. W. Ahn, M. Effros, Evolutionary approaches
to minimizing network coding resources, in Proceedings of 26th IEEE International Conference on
Computer Communications (INFOCOM2007), Anchorage, 2007.
[27]M. Kim, M. Médard, V. Aggarwal, V. O. Reilly, On the coding-link cost tradeoff in multicast network
coding, in Proceedings of International Conference for Military Communications (MILCOM), 2007, 1-7.
[28]M. Kim, M. Médard, V. O. Reilly, Network coding and its implications on optical networking, in
Proceedings of IEEE Conference on Optical Fiber Communication (OFC), 2009, 1-3.
[29]J. H. Kim, Y. H. Kim, S. H. Choi, I. W. Park, Evolutionary multi-objective optimization in robot soccer
system for education, IEEE Computational Intelligence Magazine 4 (2009) 31-41.
[30]S. Y. R. Li, R. W. Yeung, N. Cai, Linear network coding, IEEE Transactions on Information Theory 49
(2003) 371-381.
[31]L.V. Lozada-Chang, R. Santana, Univariate marginal distribution algorithm dynamics for a class of
parametric functions with unitation constraints, Information Sciences 181 (2011) 2340-2355.
[32]K.C.J. Lin, D.N. Yang, Multicast with intraflow network coding in multirate multichannel wireless mesh
networks, IEEE Transactions on Vechicular Technology 62(2013): 3913-3927.
[33]S. Mirjalili, A. Lewis, S-shaped versus V-shaped transfer functions for binary particle swarm optimization,
Swarm and Evolutionary Computation 9 (2013)1-14.
[34]M. Mussetta, F. Grimaccia, R. E. Zich, Comparison of different optimization techniques in the design of
electromagnetic devices, in Proc. 2012 IEEE World Congress on Computational Intelligence (WCCI2012),
[35]N. Noilublao, S. Bureerat, Simultaneous topology, shape and sizing optimization of a three-dimensional
slender truss tower using multiobjective evolutionary algorithms, Computers and Structures 89 (2011)
2531-2538.
[36]N. Pholdee, S. Bureerat, Hybridisation of real-code population-based incremental learning and different
evolution for multiobjective design of trusses, Information Sciences 223 (2013) 136-152.
[37]M. Riemensberger, W. Utschick, A ploymatroid flow model for network coded multicast in wireless
networks, IEEE Transactions on Information Theory 60 (2014): 443-460.
[38]G.D. Ruxton, The unequal variance t-test is an underused alternative to Student’s t-test and the
Mann-Whitney U test, Behavioral Ecology 17 (2006): 688-690.
[39]F. Vieira, D.E. Lucani, N. Alagha, Codes and balances: multibeam satellite load balancing with coded
packets, in Proc. 2012 IEEE International Conference on Communications (ICC 2012), Ottawa, 2012.
[40]N. Wang, G. Pavlou, Traffic engineered multicast content delivery without MPLS overlay, IEEE
Transactions on Multimedia 9 (2007) 619-628.
[41]X. Wu, C. W. Ngo, Y. M. Zhu, and Q. Peng. Boosting web video categorization with contextual information
from social web, World Wide Web 15 (2012) 197-212.
[42]H. Xing, Y. Ji, L. Bai, Y. Sun, An improved quantum-inspired evolutionary algorithm for coding resource
optimization based network coding multicast scheme, AEU-International Journal of electronics and
communications 64(2010): 1105-1113.
[43]H. Xing, R. Qu, A population based incremental learning for network coding resources minimization, IEEE
Communications Letters 15 (2011) 698-700.
[44]H. Xing, R. Qu, A population based incremental learning for delay constrained network coding resource
minimization, in Proc. EvoApplications 2011, Torino, 2011, pp 51-60.
[45]H. Xing, R. Qu, A compact genetic algorithm for the network coding based resource minimization problem,
Applied Intelligence 36(2012): 809-823.
[46]H. Xing, R. Qu, A nondominated sorting genetic algorithm for bi-objective network coding based multicast
routing problems, Information Sciences, 233 (2013): 36-53.
[47]H. Xing, R. Qu, G. Kendall, R. Bai, A path-oriented encoding evolutionary algorithm for network coding
resource minimization, Journal of the Operational Research Society, 65 (2013):1261-1277.
[48]H. Xing, R. Qu, L. Bai, Y. Ji, On minimizing coding operations in network coding based multicast: an
[49]S. Yang, X. Yao, Experimental study on population-based incremental learning algorithms for dynamic
optimization problems, Soft Computing 9 (2005) 815-834.
[50]S. Yang, X. Yao, Population-based incremental learning with associative memory for dynamic environments,
IEEE Transactions on Evolutionary Computation 12 (2008) 542-561.
[51]M. Zaharia, M. Chowdhury, M.J. Franklin, S. Shenker, and I. Stoica, Spark: cluster computing with working
sets, in Proc. 2nd USENIX Workshop on Hot Topics in Cloud Computing (HotCloud’10), Boston, 2010, pp
![Fig. 2 Pseudo-code of the original PBIL [3].](https://thumb-us.123doks.com/thumbv2/123dok_us/8591371.371070/9.595.98.484.251.450/fig-pseudo-code-original-pbil.webp)
![Table 1 Test Networks and Their Parameters [45].](https://thumb-us.123doks.com/thumbv2/123dok_us/8591371.371070/17.595.112.480.319.563/table-test-networks-parameters.webp)