Reconstructing promoter activity from Lux
bioluminescent reporters
Mudassar Iqbal1¤a, Neil Doherty2, Anna M. L. Page2¤b, Saara N. A. Qazi2, Ishan Ajmera3,
Peter A. Lund4, Theodore Kypraios5, David J. Scott2, Philip J. Hill2, Dov J. Stekel1*
1 Agricultural and Environmental Sciences, School of Biosciences, University of Nottingham, Sutton
Bonington Campus, Loughborough, United Kingdom, 2 Food Sciences, School of Biosciences, University of Nottingham, Sutton Bonington Campus, Loughborough, United Kingdom, 3 Plant and Crop Sciences, School of Biosciences, University of Nottingham, Sutton Bonington Campus, Loughborough, United Kingdom,
4 School of Biosciences, University of Birmingham, Birmingham, United Kingdom, 5 School of Mathematical
Sciences, University of Nottingham, Nottingham, United Kingdom
¤a Current address: Faculty of Biology, Medicine and Health Sciences, University of Manchester, Manchester, United Kingdom
¤b Current address: Centre for Biological Sciences, University of Southampton, Southampton, United Kingdom
*dov.stekel@nottingham.ac.uk
Abstract
The bacterial Lux system is used as a gene expression reporter. It is fast, sensitive and non-destructive, enabling high frequency measurements. Originally developed for bacterial cells, it has also been adapted for eukaryotic cells, and can be used for whole cell biosen-sors, or in real time with live animals without the need for euthanasia. However, correct inter-pretation of bioluminescent data is limited: the bioluminescence is different from gene expression because of nonlinear molecular and enzyme dynamics of the Lux system. We have developed a computational approach that, for the first time, allows users of Lux assays to infer gene transcription levels from the light output. This approach is based upon a new mathematical model for Lux activity, that includes the actions of LuxAB, LuxEC and Fre, with improved mechanisms for all reactions, as well as synthesis and turn-over of Lux pro-teins. The model is calibrated with new experimental data for the LuxAB and Fre reactions from Photorhabdus luminescens—the source of modern Lux reporters—while literature data has been used for LuxEC. Importantly, the data show clear evidence for previously unreported product inhibition for the LuxAB reaction. Model simulations show that predicted bioluminescent profiles can be very different from changes in gene expression, with tran-sient peaks of light output, very similar to light output seen in some experimental data sets. By incorporating the calibrated model into a Bayesian inference scheme, we can reverse engineer promoter activity from the bioluminescence. We show examples where a decrease in bioluminescence would be better interpreted as a switching off of the promoter, or where an increase in bioluminescence would be better interpreted as a longer period of gene expression. This approach could benefit all users of Lux technology.
a1111111111 a1111111111 a1111111111 a1111111111 a1111111111 OPEN ACCESS
Citation: Iqbal M, Doherty N, Page AML, Qazi SNA,
Ajmera I, Lund PA, et al. (2017) Reconstructing promoter activity from Lux bioluminescent reporters. PLoS Comput Biol 13(9): e1005731.
https://doi.org/10.1371/journal.pcbi.1005731
Editor: Jorg Stelling, ETH Zurich, SWITZERLAND
Received: March 28, 2017
Accepted: August 19, 2017
Published: September 18, 2017
Copyright:©2017 Iqbal et al. This is an open access article distributed under the terms of the
Creative Commons Attribution License, which permits unrestricted use, distribution, and reproduction in any medium, provided the original author and source are credited.
Data Availability Statement: All data and program
code are available on Figshare at URLhttps:// figshare.com/projects/Reconstructing_promoter_ activity_from_Lux_bioluminescent_reporters/ 22774. The mathematical model is availabe at Biomodels with ID MODEL1707200000 (http:// www.ebi.ac.uk/biomodels/).
Funding: This work was supported by the
Author summary
Bioluminescent reporters are used in many areas of biology as fast, sensitive and non-destructive measures of gene expression. They have been developed for bacteria, adapted now for other kinds of organisms, and recently been used for whole cell biosensors, and for real-time live animal models for infection without the need for euthanasia. However, users of Lux technologies rely on the light output being similar to the gene expression they wish to measure. We show that this is not the case. Rather, there is a nonlinear relation-ship between the two: light output can be misleading and so limits the way that such data can be interpreted. We have developed a new computational method that, for the first time, allows users of Lux reporters to infer accurate gene transcription levels from biolu-minescent data. We show examples where a small decrease in light would be better inter-preted as promoter being switched off, or where an increase in light would be better interpreted as promoter activity for a longer time.
Introduction
The lux operon contains genes for the bacterial bioluminescent reaction [1,2]:luxAandluxB encode theαandβsubunits of the heterodimeric bacterial luciferase;luxCencodes a 54kDa fatty acid reductase;luxDencodes a 33kDa acyl transferase; andluxEencodes a 42kDa acylpro-tein synthetase. These genes, including their order (luxCDABE), are conserved in all lux sys-tems of bioluminescent bacteria. An additional gene (luxF), with homology toluxAandluxB, is located betweenluxBandluxEin some species. The light emitting reaction, catalysed by the LuxAB complex, involves the oxidation of FMNH2and the conversion of a long chain fatty
aldehyde (tetradecanalin vivo) to its cognate acid, with the emission of blue-green light. LuxC, D and E together form the fatty acid reductase complex, involved in a series of reactions that recycle the fatty acid back to aldehyde. InE. coliand other species, Fre has been shown to be the enzyme responsible for flavin reduction back to FMNH2.
Gene expression can be measured by cloning a promoter of interest upstream of the lux operon, and interpreting the bioluminescence from bacteria containing such constructs as a measure of transcription [3,4]. This provides a reporter that can measure gene expression at high frequency and with less background noise than other reporters, such as GFP [4,5], and has found great value in both bacteria [6] and eukaryotes [7], with important recent applica-tions in whole cell biosensors [8], live animal infection models [9,10] and live tumour infec-tion models [11].
However, this light is an integrated signal of transcription, mRNA half-life, translation and protein turn-over, the bioluminescence reaction kinetics and substrate availability and cycling. As a consequence, absolute transcription activity cannot be directly inferred from the data generated. This is a limitation in the current use of Lux technologies. For example, some stud-ies using Lux reporters have observed fluctuations in light output [12–16], and it is not clear whether these truly reflect promoter activity, or are artefacts of the reporter system.
In this paper we show that detailed mathematical models for bioluminescence can be used to relate bioluminescence to promoter activity. We developed a new model that addresses limi-tations of previous work [17], whose structure and parameters are informed by new data and new mechanisms. We generated new enzymatic data both for the Fre reaction and for the LuxAB reaction, usingPhotorhabdus luminescensLuxAB that we have purified. An important part of our approach is to fit the models directly to the time series experimental data, which can be thought of as a (partial) factorial experiment with varying concentrations of both FMN
funders had no role in study design, data collection and analysis, decision to publish, or preparation of the manuscript.
Competing interests: The authors have declared
and NADPH. This allows for the simultaneous inference of all parameters in complex kinetic models, which is an advantage over traditional chemical kinetics techniques that only use the maximal velocity.
Results and discussion
New experimental kinetics data for LuxAB and Fre reactions including
evidence for product inhibition
The luciferase reaction uses FMNH2as an energy source. This is an energetically transient
spe-cies with a short half-life.In vivoit is supplied to the luciferase complex for immediate con-sumption by the redox activity of the Fre enzyme, which converts NADPH and FMN to FMNH2and NADP+. We measured the kinetics of the Fre reaction (Fig 1a) by recording the
consumption of NADPH (as determined spectrophotometrically) at different starting concen-trations of the FMN acceptor component (100μM, 200μM and 400μM); in all cases, the initial NADPH concentration was 200μM. The initial velocity of the reaction increased with increased FMN, leading to different kinetics in the three curves, with the steady state being reached more rapidly with increased FMN concentration.
For the measurement of luciferase (LuxAB) kinetic reactions, we combined components of the coupled Fre-LuxAB reaction. We measured light output arising from different initial con-centrations of FMN: 10nM, 100nM, 1μM, 10μM and 100μM (Fig 1a). For all five conditions, there is an initial delay before light is produced, due to a two-step injection method. Following the lag, light is produced, initially rapidly, and then tailing off. A striking feature of these data is that maximum light production increases as FMN concentration is increased from 10nM to 1μM, but then decreases again as FMN concentration is increased further. The most likely explanation for this decrease is inhibition of the LuxAB reaction by its product, FMN, which would be competing with FMNH2for binding to the LuxAB complex. It cannot be substrate
[image:3.612.94.574.453.578.2]inhibition of Fre by FMN as the kinetics for this reaction increase up to 400uM (Fig 1a). Prod-uct inhibition has not been previously reported and represents a newly discovered element of
Fig 1. New experimental data and model fits. (a) NADPH time course for three different concentration of FMN for the Fre reaction, and (b) for
the LuxAB reaction (means and standard errors from 3 replicates). The concentration values in the above data are obtained from the absorption measurements from the spectrophotometer. The conversion is carried out by relating the concentration (C) to the measured values (A) with the formula A = K*C, where K is the proportionality constant and is estimated using initial measurement(A0) and starting concentration (C0=
200μM). The velocity of the reaction increases as FMN concentration is increased. Normalised (using max. velocity in the assay) LuxAB
reactions velocity time series for different FMN concentrations. The velocity of the reaction increases from the lowest concentrations of FMN, is greatest for FMN concentrations of 1μM, and decreases for higher concentrations of FMN. This is best explained by product inhibition of the
LuxAB reaction through competition between FMN and the substrate FMNH2. (c) Model fits for Fre, (d) LuxAB, and (e) LuxEC reactions. The
model fits to the data are good, showing that kinetic parameters for the reaction rates can be inferred. Summarized data are displayed: for Fre— NADPH concentrations at t = 10 min; for LuxAB, the maximal veclocity for each FMN concentration; for LuxEC—only the AMP time-course data are shown. The full data and fits for all three reactions are shown in Figures A, B, F and J inS1 Text. Total flavin = 88uM, O2= 550uM,
NADPH = 560uM, and ATP = 1310.
the Lux bioluminescent pathway. Structural studies have shown that both FMN and FMNH2
can form a complex with LuxAB [18], with only two residues that could act to discriminate between them (see PDB 3fgc), supporting the proposed product inhibition.
New mathematical model for the Lux system with parameters inferred
from experimental data
The new mathematical model includes three chemical reactions: the Fre reaction for flavin recycling; the LuxAB reaction for light production; and the LuxEC reaction for aldehyde recy-cling. It also contains a further equation to describe the turnover dynamics of the Lux pro-teins:
d½FMNH2
dt ¼vFreFre vLuxABLuxAB d½FMN
dt ¼ vFreFreþvLuxABLuxAB d½RCOOH
dt ¼vLuxECLuxECþvLuxABLuxAB t½RCOOH d½RCHO
dt ¼r0 vLuxABLuxABþvLuxECLuxEC t½RCHO dP
dt ¼TðtÞ gLP
½FMNH2 þ ½FMN ¼F
½RCOOH þ ½RCHO ¼R0
It is assumed that the action of LuxD counterbalances the loss of RCOOH and RCHO; thus R0is constant andρ0=τR0. Control of the bioluminescent reactions is assumed to lie with the
most rapidly turned-over protein. This is modelled by settingP(t) to represent all of the Lux proteins and using the same rate of synthesis and turn-over for all proteins. The protein pro-ductionT(t) encompasses transcription, translation and mRNA degradation and is supplied as a model input; it is assumed that theluxmRNA is at quasi steady state. The value of the protein turn-over rateγLhas been inferred from Lux data as 0.378h−1(Fig 2). Full details for the veloc-ity equations for the termsvFre,vLuxABandvLuxECare provided inS1 Text. New detailed mecha-nisms have been defined using King and Altman’s schematic method [19], with a modification to thevLuxABvelocity term to include the impact of FMNH2product inhibition.
distributions are shown in Figures B—N inS1 Textand he inferred parameters are given in Table A inS1 Text.
Model predicts a nonlinear relationship between promoter activity and
bioluminescent output
A key finding of this analysis, of particular significance for inferring levels of gene expression with lux reporters, is that there is a nonlinear relationship between promoter activity and light output (Fig 3). Bioluminescent outputs display qualitative and quantitative behaviours differ-ent from the underlying gene expression, so direct interpretation of bioluminescdiffer-ent data can be misleading. Simulations of the model for a switching on of gene expression show that for low levels of expression, bioluminescence appears more gradually with a slight delay, while for higher levels of gene expression there is a transient peak of bioluminescence followed by lower steady state. Simulations for a transient pulse of gene expression also produce bioluminescent outputs that are different from the underlying gene expression. Bioluminescence decreases more slowly than gene expression, and, for higher levels of gene expression, bioluminescence can take several hours to decrease following cessation of gene expression. The decrease in sig-nal is considerably faster than most variants of GFP, which are often stable for more than 24 hours [5,24], and comparable with engineered unstable GFP variants [25].
Inference of promoter activity from bioluminescent output
[image:5.612.191.574.75.276.2]The model can be used to reverse engineer gene expression from bioluminescence, also using an MCMC approach. We have tested this approach on three datasets: the synthetic pulse data set, where the underlying gene expression to be inferred is supplied; data from the uhpT pro-moter inS. aureus, with relatively simple light profiles; and data from an acid stress experiment inE. coli, with more complicated bioluminescent output, for the promoter of thesafA-ydeO operon in four strains following exposure to acid: wild-type, aydeOknockout, aphoP knock-out and aydeOphoPdouble knock out; both YdeO and PhoP repress this promoter [15]. Fig 2. Histogram of inferred Lux protein turnover rates. The histogram shows low variability about a mean
value of 0.378h−1.
The reverse engineering of the synthetic pulse data show accurate reproduction of the sup-plied input gene expression profile, demonstrating that our method works correctly (Fig 4). For the uhpT data (Fig 5a), the inferred promoter activity suggests both earlier gene expression and more rapid switching off of expression than would be apparent from the light output. The most profound difference in interpretation of results based solely on levels of emitted light arise from the acid stress data (Fig 5b). While the inferred gene expression is less smooth than the bioluminescence, it highlights three behaviours not apparent in the bioluminescence itself. First, there is a clear, transient pulse of gene expression following acid stress, lasting only 20 minutes in the WT, 30 minutes in the single knockout strains, and 40 minutes in the double knock-out. In the WT andydeOmutant, gene expression is completely switched off after this pulse, which cannot be seen from the bioluminescence, while in thephoPand double mutants, it is not completely switched off. Second, the increase in gene expression in the mutants rela-tive to the WT is much lower than indicated by the bioluminescence, with the increased biolu-minescence reflecting increased duration of gene expression as much as increased level. Third, the inferred gene expression appears to show pulses. These reflect the experimental protocol, in which plates were moved between the luminometer and the spectrophotometer every 15 minutes, disturbing the cells. The pulses suggest that the protocol had a more profound impact on cell activity than would be apparent from the light. The peaks of these pulses are more likely to represent gene expression level, indicative of a long term steady state gene expression, also not apparent from the bioluminescence. While the transient gene expression of thesafA-ydeO promoter is to be expected in the WT and two single mutant strains, the reason for its tran-sience in the double mutant, i.e. in the absence of the two known down-regulators of the pro-moter, is not known. The promoter is activated by the EvgA response regulator following a drop in pH, and the kinetics of turnover and dephosphorylation of this activator are unknown. They may explain the transient activation of the promoter, or there may be other feedback sys-tems operating. Other known acid responsive regulators such as GadE, GadX and GadW are not responsible, as their deletion has no affect on promoter induction kinetics [15].
Fig 3. Relationship between promoter activity and light output. Nonlinear relationship between promoter activity and light output
for a synthetic pulse or switch of gene expression at different levels. The bioluminescence displays different qualitative and
quantitative behaviours from the underlying gene expression. With the switch data, the bioluminescence has slower onset compared with gene expression, and, for high levels of gene expression, shows a transient pulse not present in the gene expression. With the pulse data, the bioluminescence shows much longer persistence than the underlying gene expression. These data show that bioluminescence alone could be a misleading measure of gene expression.
In these cases it is reasonable to associate a reduction of bioluminescence with a reduction of promoter activity. However, the Lux reporter system can also be used to assess loss of cell viability under toxic stress, including to antibiotics [26] or heavy metals [27], with a reduction of bioluminescence associated with cell death. On the other hand, with sub-lethal doses of anti-microbials, the Lux reporter system can still be a useful measure of gene expression, including of antimicrobial resistance genes [20,28]. Since the model associates changes in biolumines-cence to promoter activity, rather than viability, it is important to ensure that there is minimal loss of viability due to experimental conditions, in order that the model output can be correctly interpreted.
Conclusion
We have developed a new mathematical model to relate gene expression to light output in Lux promoter assays, that includes newly discovered experimental evidence for product inhibition of the LuxAB reaction by FMNH2. The model shows a nonlinear relationship between gene
[image:7.612.202.563.76.357.2]expression and light output. We have used the model to provide a method to infer gene expres-sion from light output that can be generally applied to experiments using Lux reporter assays. We anticipate that this approach could have valuable applications in inferring gene expression levels in a wide range of biological systems where lux reporters can be employed, including bothin vitroexperiments, and to track gene expression in animal models of bacterial infection. Program code to undertake reverse engineering of promoter activity are provided as Matlab and R functions on Figshare.
Fig 4. Reverse engineered promoter activity from light output. Here, the promoter inference is for a
simulated transient pulse experiment, showing effective and accurate recovery of the known gene expression profile. The shaded areas in the graphs represent 50 simulations resampling from the posterior distribution; they are barely visible because the posterior distribution in this case is very tight.
Materials and methods
Chemicals, media, cloning, bacterial strains
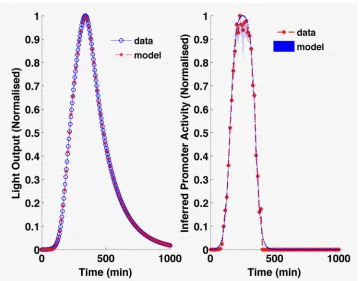
[image:8.612.200.560.80.451.2]All chemicals were purchased from Sigma-Aldrich unless indicated otherwise, and were of ultrapure quality. Routine cloning steps were carried out using standard molecular bio-logical protocols. Primary clones were selected in LB with Mach I Electrocompetent or chemicallyE. coliobtained from Thermo-Fisher Scientific. Protein expression was carried out using theE. colistrain BL21 (DE3) which had been previously transformed with the arabinose inducible plasmid pGRO7, encoding the GroES-GroEL chaperone complex (Takara Inc.). Fig 5. Reverse engineering of promoter activity from experimental data. (a) Bioluminescent data and (b)
reverse engineered gene expression from the safA-ydeO promoter in E. coli. The pattern of gene expression is very different from the light output pattern. In particular, the increased bioluminescence is partly explained by greater duration of gene expression not just level of gene expression; gene expression in the WT and yodel mutant appears to be switched off after induction, which is not apparent in the bioluminescence; and the inferred expression shows pulses which are an artefact of the experimental arrangement, in which plates were moved every 15 minutes between a spectrophotometer and a luminometer, demonstrating that the agitation has an impact upon the cells. The shaded areas in the graphs represent 50 simulations resampling from the posterior distribution.(c) Bioluminescent data and (d) reverse engineered gene expression from data from the
uhpT promoter in S. aureus showing that the peak of gene expression occurs earlier than the light output, and
Autoinduction medium was used for the protein purification steps (Overnight Express Auto-induction system 1—Novagen). See below for further details of the luciferase purification strat-egy. Antibiotic selection was carried out at the following concentrations: Chloramphenicol— 20μgml−1, Carbenicillin—100μgml−1, Kanamycin—50μgml−1.
Measurement of Fre activity
The commercially available Fre/NAD(P)H:FMN-Oxidoreductase ofP. luminescenswas obtained from Roche Diagnostics. The activity of the enzyme was determined using a continu-ous spectrophotometric rate determination method as follows: NADPH (200μM), FMN (100-400μM) and Fre (5μl of a 0.2 unit ml−1preparation per ml final reaction mix) was prepared in 50mM potassium phosphate buffer, pH 7.0. Replicate 1ml samples were prepared in sterile cuvettes, which were mixed by inversion immediately after addition of the enzyme. Fre activity was observed as a function of the loss of NADPH, measured by reduction of its characteristic absorbance value at 340nm. Experiments were conducted over a period of 30 minutes at 22˚C. All measurements were performed in triplicate.
Luciferase purification
Reconstitution of coupled luciferase assay and kinetic measurements
Purified luciferase and commercially prepared Fre were combined to form the coupled reac-tion complex as follows: Reacreac-tions were typically carried out in a final volume of 100μl con-taining purified luciferase (typically in the range 1.5-15μgml−1), NADPH (200μM), FMN (tested over the range 10nM-100μM in this study), Fre (0.2 units ml−1) and decanal (0.02%) in 50mM potassium phosphate buffer, pH 7.0. Reactions were carried out at 22˚C and monitored in either a Biospacelab Photon Imager or Tecan Genios Pro multimode microplate reader. The kinetic assays were carried out using a Tecan Genios pro fitted with injector capacity as fol-lows; all components other than decanal were combined in a final volume of 50μl per well in flat bottomed microtiter plates suitable for bioluminescence measurements. The reactions were initiated by injection of a further 50μl phosphate buffer containing 0.04% decanal. Reac-tions were monitored for 1100 milliseconds. All measurements were performed in triplicate.
Estimation of Lux turnover rates
The promoter of the Universal hexose transporter (uhpT) gene was amplified fromS. aureus and introduced into pUNK1dest along with the Gram-positive GFP-luxABCDE operon and therrnBT1T2 terminator [29] using a Multisite Gateway LR plus reaction. Transformants were selected on erythromycin and screened for expression of the reporter. This PuhpT-reporter vector was designated pSB3009.S. aureusRN4220 [pSB3009] overnight cultures were grown aerobically at 37˚C in in Tris Minimal Succinate medium (TMS, [30]) supplemented with Erythromycin (5μgml−1) for plasmid maintenance Bacterial pellets were washed once in TMS without sodium succinate (TM) and resuspended in an equal volume of TM. These were diluted 1/50 into fresh TM supplemented with filter sterilized sugars (Glucose or glucose-6-phosphate) supplemented with Erythromycin (5μgml−1).
For growth and reporter gene measurements, replicate samples (200μl) were placed into the wells of a 96-clear-bottom microtiter plate (Porvair) and incubated at 37˚C in a Tecan Genesis Pro microplate reader. Optical density (600nm), fluorescence (485ex/510em) and biolumines-cence (RLU) readings were taken at 30 min periods over the course of the experiment.
From the data generated from these experiments, we identified the curves where RLU (light read-outs, arbitrary units) decreases while cells are still in exponential phase (corresponding OD measurements). We estimate the turn-over rate for each such curve (total 18 curves used) by fitting a linear line to the log transformed data. The histogram of estimated values are shown inFig 2. The linear fits to the log-transformed data for all the 18 curves are shown in Figure O inS1 Text.
Parameter inference
In order to estimate the kinetic parameters for all three reactions, we used a similar Bayesian approach based on Markov Chain Monte Carlo (MCMC), in which a sub-model relevant to each reaction is used along-with corresponding experimental data. We used an adaptive ver-sion of Metropolis-Hasting MCMC algorithm with global scaling [31] in order to iteratively sample from the posterior distribution of the kinetic parameters. Our choice of priors and like-lihood function is described below.
We define the likelihood of the parameters, for any of the models using inEq 1, assuming homogeneous Gaussian noise. Given the current set of parameter values (θ), we simulate the species of interest (stored in vectorY0), and use the corresponding experimental data in vector
Yto give the likelihood function:
LðyÞ ¼
Y
ni¼1 t
2p
1
2exp t
2ðYi Y
0
iÞ
2
ð1Þ
A separate Gibbs step is introduced for the sampling of noise precisionτ, in case of Fre and LuxEC inference, while for LuxAB data, we estimated the noise variance from the replicates. Details on the derivation of the Gibbs step is provided inS1 Text.
Promoter inference
A Monte Carlo approach was used to infer promoter activity from light readout. The promoter input function is modelled as a series of K heights at fixed positions. A Martingale prior distri-bution is used [32], so that the prior distribution for each height at pointnis an exponential distribution with mean value equal to the current height at the previous pointn−1. At each step, a point is chosen at random, and a new height is proposed, as described in Green 1995 [33]. The likelihood function uses a Gaussian error model. For all promoter inference, light output curves for a whole experiment must be normalized to the highest light value found in that experiment.
Supporting information
S1 Text. The file S1 Text contains detailed methods of the computational modelling, including reactions mechanisms and related velocity derivations, and details for parameter estimation for all three reactions (Fre, LuxAB, and LuxEC), including relevant sub-models, additional figures for model data fits, diagnostic figures for MCMC methods, details of posterior distributions, and a table of inferred parameters.
(PDF)
Acknowledgments
We thank Tania Perehinec for microbiological technical support.
Author Contributions
Conceptualization: Philip J. Hill, Dov J. Stekel.
Funding acquisition: David J. Scott, Philip J. Hill, Dov J. Stekel.
Investigation: Mudassar Iqbal, Neil Doherty, Anna M. L. Page, Saara N. A. Qazi, Ishan
Ajmera.
Methodology: Mudassar Iqbal, Neil Doherty, Theodore Kypraios, David J. Scott, Dov J. Stekel.
Project administration: Dov J. Stekel.
Resources: Peter A. Lund, Philip J. Hill.
Software: Mudassar Iqbal, Dov J. Stekel.
Validation: Theodore Kypraios, Philip J. Hill.
Writing – original draft: Mudassar Iqbal, Neil Doherty, Dov J. Stekel.
Writing – review & editing: Peter A. Lund, Theodore Kypraios, Philip J. Hill, Dov J. Stekel.
References
1. Meighan E. Genetics of bacterial bioluminescence. Annu Rev Genet. 1994; 28:117–139.https://doi.org/ 10.1146/annurev.ge.28.120194.001001
2. Dunlap P. Biochemistry and genetics of bacterial bioluminescence. Advances in Biochemical Engineer-ing and Biotechnology. 2014; 144:37–64.
3. Szittner R, Meighen E. Nucleotide sequence, expression, and properties of luciferase coded by lux genes from a terrestrial bacterium. The Journal of Biological Chemistry. 1990; 265(27):16581–16587. PMID:2204626
4. Close D, Xu T, Smartt A, Rogers A, Crossley R, Price S, et al. The evolution of the bacterial luciferase gene cassette (lux) as a real-time bioreporter. Sensors. 2012; 12:732–752.https://doi.org/10.3390/ s120100732PMID:22368493
5. Qazi S, Harrison S, Self T, Williams P, Hill P. Real-time monitoring of intracellular Staphylococcus
aureus replication. Journal of Bacteriology. 2004; 186(4):1065–1077.https://doi.org/10.1128/JB.186.4. 1065-1077.2004PMID:14762001
6. Zaslaver A, Mayo A, Rosenberg R, Bashkin P, Sberro H, Tsalyuk M, et al. Just-in-time transcription pro-gram in metabolic pathways. Nature Genetics. 2004; 36:486–491.https://doi.org/10.1038/ng1348
PMID:15107854
7. Close D, Patterson S, Ripp S, Baek S, Sanseverino J, Sayler G. Autonomous bioluminescent expres-sion of the bacterial luciferase gene cassette (lux) in a mammalian cell line. PLoS One. 2010; 5:e12441.
https://doi.org/10.1371/journal.pone.0012441PMID:20805991
8. Brutesco C, Preveral S, Escoffier C, Descamps E, Prudent E, Cayron J, et al. Novel aspects of the acid response network of Escherichia coli K-12 are revealed by a study of transcriptional dynamics. Environ Sci Pollut Res. 2017; 24:52–65.
9. Bacconi M, Haag A, Torre A, Castagnetti A, Chiarot E, Delany I, et al. A stable luciferase reporter plas-mid for in vivo imaging in murine models of Staphylococcus aureus infections. Appl Microbial Biotech-nol. 2016; 100:3197–3206.https://doi.org/10.1007/s00253-015-7229-2
10. Shivak D, MacKenzie K, Watson N, Pasternak J, Jones B, Wang Y, et al. A modular, Tn7-based system for making bioluminescent or fluorescent Salmonella and Escherichia coli strains. Appl Environ Micro-bien. 2016; 82(16):4931–4943.https://doi.org/10.1128/AEM.01346-16
11. Cronin M, Akin A, Francis K, Tangney M. In vivo bioluminescence imaging of intratumoral bacteria. Methods Mol Biol. 2016; 1409:69–77.https://doi.org/10.1007/978-1-4939-3515-4_7PMID:26846803 12. King J, Digrazia P, Applegate B, Burlage R, Sanseverino J, Dunbar P, et al. Rapid, sensitive
biolumines-cent reporter technology for naphthalene exposure and biodegradation. Science. 1990; 249:778–781.
https://doi.org/10.1126/science.249.4970.778PMID:17756791
13. Zanzotto A, Boccazzi P, Gorret N, Van Dyk T, Sinskey A, Jensen J. In situ measurement of biolumines-cence and fluoresbiolumines-cence in an integrated microbioreactor. Biotechnology and Bioengineering. 2006; 93:40–47.https://doi.org/10.1002/bit.20708PMID:16187336
14. Qazi S, Middleton B, Muharram S, Cockayne A, Hill P, O’Shea P, et al. N-acylhomoserine lactones antagonize virulence gene expression and quorum sensing in Staphylococcus aureus. Infection and Immunity. 2006; 74(2):910–919.https://doi.org/10.1128/IAI.74.2.910-919.2006PMID:16428734 15. Burton N, Johnson M, Antczak P, Robinson A, Lund P. Novel aspects of the acid response network of
Escherichia coli K-12 are revealed by a study of transcriptional dynamics. Journal of Molecular Biology.
2010; 401(5):726–742.https://doi.org/10.1016/j.jmb.2010.06.054PMID:20603130
16. Jia K, Eltzov E, Marks R, Ionescu R. Bioluminescence enhancement through an added washing proto-col enabling a greater sensitivity to carbofuran toxicity. Ecotoxiproto-cology and Environmental Safety. 2013; 96:61–66.https://doi.org/10.1016/j.ecoenv.2013.06.013PMID:23867093
17. Welham P, Stekel D. Mathematical model of the Lux luminescence system in the terrestrial bacterium Photorhabdus luminescens. Molecular Biosystems. 2009; 5:68–76.https://doi.org/10.1039/B812094C
PMID:19081933
19. King E, Altman C. A schematic method of deriving the rate laws for enzyme-catalyzed reactions. J Phys Chem. 1956; 60(10):1375–1378.https://doi.org/10.1021/j150544a010
20. Takahashi H, Oshima T, Hobman J, Doherty N, Clayton S, Iqbal M, et al. The dynamic balanace of import and export of zinc in Escherichia coli suggests a heterogeneous population response to stress. Journal of the Royal Society Interface. 2015; 12(106).https://doi.org/10.1098/rsif.2015.0069 21. Fletcher S, Iqbal M, Jabbari S, Stekel D, Rappoport J. Analysis of occludin trafficking, demonstrating
continuous endocytosis, degradation, recycling and biosynthetic secretory trafficking. PLoS ONE. 2014; 9(11):e111176.https://doi.org/10.1371/journal.pone.0111176PMID:25422932
22. Rodriguez A, Riendeau D, Meighan E. Purification of the acyl coenzyme A reductase component from a complex responsible for the reduction of fatty acids in bioluminescent bacteria. Properties and acyl-transferase activity. The Journal of Biological Chemistry. 1983; 258(8):233–5237.
23. Rodriguez A, Nabi I, Meighan E. ATP turnover by the fatty acid reductase complex of Photobacterium
phosphoreum. Canadian Journal of Biochemistry and Cell Biology. 1985; 63(10):1106–1111.
24. Qazi S, Council E, Morrissey J, Rees C, Cockayne A, Winzer K, et al. agr expression precedes escape of internalised Staphylococcus aureus from the host endosome. Infection and Immunity. 2001; 69 (11):7074–7082.https://doi.org/10.1128/IAI.69.11.7074-7082.2001PMID:11598083
25. Allen M, Wilgus J, Chewning C, Sayler G, Simpson M. A destabilized bacterial luciferase for dynamic gene expression studies. Systems and Synthetic Biology. 2007; 1:3–9. https://doi.org/10.1007/s11693-006-9001-5PMID:19003433
26. Vocat A, Hartkoorn R, Lechartier B, Zhang M, Dhar N, Cole S, et al. Bioluminescence for assessing drug potency against nonreplicating Mycobacterium tuberculosis. Antimicrobial Agents and Chemother-apy. 2015; 59:4012–41019.https://doi.org/10.1128/AAC.00528-15PMID:25896710
27. Ivask A, Rolova T, Kahru A. A suite of recombinant luminescent bacterial strains for the quantification of bioavailable heavy metals and toxicity testing. BMC Biotechnology. 2009; 9:41.https://doi.org/10.1186/ 1472-6750-9-41PMID:19426479
28. Melamed S, Lalush C, Elad T, Yagur-Kroll S, Belkin S, Pedahzur R. A bacterial reporter panel for the detection and classification of antibiotic substances. Molecular Biotechnology. 2012; 5:536–548.
29. Perehinec T, Qazi S, Gaddipati S, Salisbury V, Rees C, Hill P. Construction and evaluation of multisite recombinatorial (gateway) cloning vectors for Gram-positive bacteria. BMC Molecular Biology. 2007; 8:80.https://doi.org/10.1186/1471-2199-8-80PMID:17880697
30. Sebulsky M, Hohnstein D, Hunter M, DE H. Identification and characterization of a membrane perme-ase involved in iron-hydroxamate transport in Staphylococcus aureus. Journal of Bacteriology. 2000; 182(16):4394–4400.https://doi.org/10.1128/JB.182.16.4394-4400.2000PMID:10913070
31. Andrieu C, Thoms J. A tutorial on adaptive MCMC. Statistics and Computing. 2008; 18(4):343–373.
https://doi.org/10.1007/s11222-008-9110-y
32. Arjas E, Gasbarra D. Nonparametric Bayesian inference from right censored survival data, using the Gibbs sampler. Statistica sinica. 1994; 4:505–524.