O R I G I N A L A R T I C L E
Journey decision making: the influence on drivers of dynamic
information presented on variable message signs
Sarah Sharples1•Sally Shalloe1•Gary Burnett1•David Crundall2
Received: 27 February 2014 / Accepted: 11 November 2015 / Published online: 9 December 2015
The Author(s) 2015. This article is published with open access at Springerlink.com
Abstract In many highways environments electronic media such as variable message signs are increasingly being used to provide drivers with up-to-date dynamic information in order to influence driving decision making during journeys. These decisions may be associated with strategic choices, such as route selection, or tactical deci-sions, such as driving at a certain speed, or altering driving style. This paper presents a study that used two methods—a scenario approach and a medium-fidelity driving simulator. Data from both methods are presented here and include decision making and driving performance data. These data provide an insight into the role of information and other contextual influences in decision making in the driving context specifically, but also has useful implications for the way in which information should be designed in other decision making contexts, such as travel using public transport, or supporting real-time complex control opera-tions. The use of multiple data collection approaches also enabled data comparisons to be made, thus improving overall confidence in conclusions. The paper highlights the role of familiarity with information wording and context, level of detail, interpreted meaning, previous experience and contextual cues on trust in information and conse-quently behaviour in response to the information presented.
Keywords ComprehensionDecision making
Information designDynamic decision supportDriving User centred design
1 Introduction
In many highways environments electronic media such as variable message signs (VMS) are increasingly being used to provide drivers with up-to-date dynamic information in order to influence driving decision making during journeys. These decisions may be associated with strategic choices, such as route selection, or tactical decisions, such as driving at a certain speed, or altering driving style. Understanding the attitudes towards such information, the basis upon which people make these decisions and the extent to which providing such information might impact upon the driving task can support the way in which information for drivers is designed and displayed.
With the increasing prevalence of mobile technologies the number of different types of ways in which drivers receive information is increasing and in the future will comprise a combination of formally provided information and other sources of information such as social media. Driving is obviously a time-critical and safety-critical task that demands that information is presented in as succinct a manner as possible, reducing potential for distraction. However, previous work has suggested (Wang et al.2005) that the wording of information can influence the response of drivers to that information.
Agencies such as those who control and monitor traffic movement can benefit from an understanding of the likely response of drivers to information—this knowledge can inform the types of media chosen to disseminate informa-tion, the wording of information messages that they
This paper is dedicated to the memory of Sally Shalloe.
& Sarah Sharples
1 Human Factors Research Group, Faculty of Engineering,
University of Nottingham, Nottingham, UK
2 Division of Psychology, School of Social Sciences,
present, and help them to anticipate the proportion of dri-vers who will respond to instructions. In England, the Highways Agency, responsible for management of all major motorways and trunk roads, communicates to drivers via smartphone applications, website sources (which are also used as the basis for radio traffic reports) and elec-tronic VMS that have the capability to present short written statements, and in some cases, also to present graphical representations of traffic routes and conditions. The goal of a well-designed sign legend should be to safely inform drivers of current traffic and travel conditions, enabling them to make journey decisions appropriate to their own goals and preferences, whilst maintaining the optimal road conditions for the majority of users. This paper presents a series of studies that were conducted to explore the way in which drivers respond to, understand and make decisions during a journey when presented with different types of messages, with the aim of supporting selection of legends for display on VMS in the short term, and providing a foundation for implementation of dynamic information in-car and via smartphone devices.
2 Background literature
2.1 Impact of VMS on driver behaviour
Previous studies have considered the impact of VMS on driver behaviour by considering aspects of perception, attention, decision making and workload, as well as the different social and cultural expectations that drivers accustomed to driving in different contexts might have. Wang et al. (2005) highlighted the role of VMS message content and format on driver behaviour. They suggested that the level of detail of relevant information and pre-sentation of information that is perceived as being appro-priate and specific can significantly affect drivers’ willingness to change behaviour. Pedic and Ezrakhovich (1999) found that if drivers can see a purpose for the dis-played information and if the information is specific, they are more likely to be affected by it. Research findings into warning design have been translated into guidelines for VMS messages in the US (CDOT 2005); however, there has been little systematic research carried out in the UK to help those responsible for the wording of VMS legends.
Research into the influence of adverse driving condition information displayed on VMS found some messages resulted in reduced driving speeds for relatively short dis-tances after the display, but they were dependent on the content of the display, the conspicuity of the sign and the ‘novelty value’ of new message types being trialled (Luoma et al.2000; Ra¨ma¨ and Kulmala2000). The safety-critical issue of the effects of messages signs on driver
speed has also been highlighted in research by Bai et al. (2010) in their study on the effectiveness of text-based message signs compared to traffic signs in reducing speed in road work zones. Their findings suggest that the use of text-based message signs alongside traditional road signs could be the most effective combination of signage to help reduce driver speed through road work zones.
This influence of level of detail on driver behaviour is reinforced by Bonsall and Palmer (1999) who found that there were differences between causes of delays in the compliance with route diversion suggestions. Where the cause was ‘ROADWORKS’ rather than ‘ACCIDENT’, compliance reduced considerably. This may suggest that drivers could regard delays due to accidents as more seri-ous than an equivalently described delay due to road works; alternatively drivers may believe that delays due to road works have been exaggerated in an attempt to dis-suade traffic from using roads on which the works were being carried out. Hidas and Awadalla (2006) also found that for some message designs, drivers were more likely to divert if ACCIDENT was displayed rather than CON-GESTION or ROADWORKS.
Decision making studies have shown that driving behaviour is often influenced by the behaviour of other drivers on the road. A UK study described by Pedic and Ezrakhovich (1999) found that VMS information was effective in reducing speed violations, but only where the majority of other drivers passing the sign complied with the speed limit shown. In a study carried out using a driving simulator where drivers were exposed to VMS information which showed the percentage of other drivers speeding, participants tended to drive more slowly and committed less speed violations when the information displayed indicated that other traffic was law-abiding (Pedic and Ezrakhovich1999).
2.2 Methods for capturing driver behaviour
The use of driving simulators offers an extremely cost-effective way of investigating many different design and evaluation issues in a safe and controlled environment (Burnett 2008). Driving simulators are often classified as low-, medium- and high-cost systems and they vary from simple single screen, PC-based laboratory instruments, to advanced graphics, wide-screen, fixed-based mock-ups to moving base versions of the latter (Young et al. 2008). Simulators use either real or mock-up driving cabs with a full range of controls, and a dynamic windscreen display is projected onto a screen beyond the windscreen. Factors such as sign conspicuity, lettering size and environmental factors can be manipulated more easily along with possible effects of secondary tasks or in-vehicle distractions (Bon-sall and Palmer1999).
There is a question as to the generalisability of results from studies using driving simulators to the real world. Dutta et al. (2004) and Young et al. (2008) discuss that driving experience influences not only the driving task itself, but also concurrent tasks other than driving, i.e. more experienced drivers are better able to carry out
multiple simultaneous tasks than novice drivers. In addi-tion, more experienced drivers may be able to use their prior knowledge in experiments where they have to interpret VMS messages. Some research has shown that people in driving simulators behave more cautiously than they might do in the real world (Dutta et al.2004; Young et al. 2008).
However, driving simulators vary considerably in sophistication and there are concerns over validity in some cases (Santos et al.2005; Burnett2008; Young et al.2008). In conducting validity research, it can be extremely diffi-cult to run road and simulator trials that are comparable in terms of participants, tasks, measures, variables, environ-ment, etc. Furthermore, as driving is a complex task which involves a substantial number of discrete physical, per-ceptual and cognitive behaviours, a simulator will only be able to allow investigation of a subset of these, e.g. speed control, headway maintenance. Consequently, there are very few driving simulator validity studies in the literature (Burnett2008). However, driving simulators do offer good relative behavioural validity for many driving performance measures (Young et al.2008; Parkes2012).
Driving performance measures have been shown that visual and cognitive distractions affect different driving performance measures with visual distraction having a greater effect on lateral control measures such as lane exceedences or standard deviation of lane position, whereas cognitive distraction affects visual scanning behaviour to a greater extent (Young et al.2008).
Scenario methods are frequently used in interaction design to elicit user requirements, opinions and preferences. They are very valuable in encouraging people to think about a wide range of situations, away from technology require-ments or limitations, and can be a very efficient way of presenting a wide range of situations in a short period of time. They can be text based or, as in the case of this study, a combination of text and pictorial information; the use of images or props can increase user engagement with the process of eliciting preferences and opinions. A limitation of the scenario approach is that it depends on the skills of the researcher to effectively and consistently communicate the scenario, either verbally or through the design of materials, and that different individuals may vary in the extent to which they engage with the scenarios.
2.3 Requirements and methods for research into VMS design
This literature provides some initial indication of issues that should be explored in VMS design, and considers different methodological approaches. Firstly, familiarity of signs is important. Within an experimental study, this can be represented to some extent by repetition of signs and can be supported by the use of a scenario in which the partic-ipant is placed, to encourage them to use their past expe-rience of such situations from the real driving context. Secondly, the level of detail presented appears to influence driver behaviour. It is useful to understand what types of detail might influence driver decisions, and whether the introduction of this additional information (and thus the additional demand on the drivers reading such information) has an effect on the primary task of driving. Finally, the interpreted meaning of the sign, usually related to the cause behind the information being presented has a role in informing decisions made. Understanding why and in which circumstances this interpreted meaning affects decisions will support the design and implementation of traffic information in the future.
The study presented here uses two methods—a scenario approach and a simulator study—to examine these issues. This provides an insight into the role of information and other contextual influences in decision making in the driving context specifically, but also has useful implica-tions for the way in which information should be designed in other decision making contexts such as travel using public transport or supporting real-time complex control operations. The use of two methods also enabled cross-study comparisons to be made, thus improving overall confidence in conclusions. The scenario approach allows a large number of designs to be considered in a relatively short space of time and requires the respondents to imagine that they are in certain situations, and anticipate their response. The simulator approach extends this by placing the participants in a vehicle and presenting different information to them within a simulated driving task; rather than asking them to imagine a situation, we ask participants to behave in the same manner as they would in the real world and capture this behaviour.
3 Study rationale
As the driving environment is safety-critical, it was not possible to evaluate real-world responses of drivers to dif-ferent VMS legend wordings. A scenario approach was adopted where drivers were presented with a driving scenario and asked to describe what they thought they would do if presented with different information. This method had the
advantage of being able to present a large number of dif-ferent signs to individual participants. Whilst inevitably such a scenario approach involves a sacrifice of ecological valid-ity, and thus means that interpretation of absolute responses cannot directly be assumed to apply in a real-world context (for example, if in our survey 30 out of 80 people said they would respond in a certain manner, we cannot assume that everyone would indeed respond in the same way in the real scenario), it provides valuable indications of the relative influence of different signs and allows for questioning of participants as to the reasoning behind their responses. The second method that was applied was asimulator study. This study required participants to drive on part of a motorway journey in a driving simulator, presented drivers with dif-ferent VMS wordings and asked them about the journey choices they would make as they passed decision points.
Three sets of legends were examined during this study. These messages were identified by the project partners, the UK Highways Agency, as being of particular importance to understanding how drivers responded to a mix of safety and information content displayed on a single sign, response to messages about traffic and weather conditions. The particular message contents were selected in con-junction with subject matter experts with knowledge of UK highways management to represent legends that were fre-quently used or around which some ambiguity or confusion had been noted.
The aims of these studies were to:
• Evaluate driver understanding of different VMS legend wordings
• Identify the predicted actions that drivers reported they would take if presented with the legends during a driving scenario, in comparison with data obtained from a driving simulator study
• Measure the impact of presenting VMS legends on driving performance
• Analyse the legend wording to link the specifics of wording to driver understanding and predicted actions • Provide initial recommendations for content of VMS
legends
4 Methods
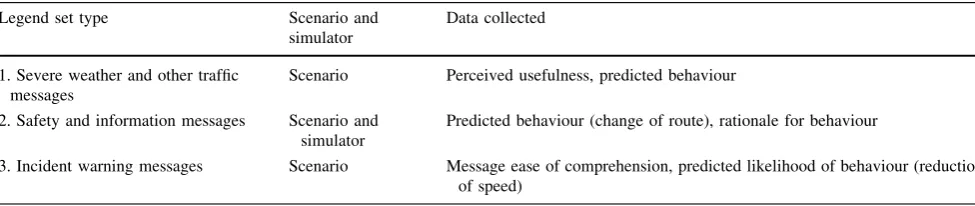
The study presented a series of different sign types and collected qualitative and quantitative data regarding sign comprehension and intended behaviour. The simulator approach did not allow as many signs to be presented in a short period of time as the scenario approach; therefore, the simulator approach was only used on a small subset of messages. Table1 shows the three legend types evaluated and data collected for each. Legends from the type 1 set are generally used to provide long- and short-term information about the status of the road network and aim to influence strategic choices of drivers. Although legend set types 2 and 3 are distinct (due to the message complexity and particular situations in which they are used on the UK highways net-work), they are similar in their goals of increasing driver awareness of the current road traffic situation and influenc-ing short-term drivinfluenc-ing behaviour. This range of message types was selected to meet the goals of the project stake-holders and to allow in-depth understanding of the useful-ness of the different methodological approaches for a range of message types. The data collected for each message set differed slightly depending on technical feasibility, time availability and priorities of the project sponsor.
4.1 Participants
Eighty-two participants were recruited (41 male, 41 female). Participants were recruited from responses to posters and emails and consisted of a mixture of staff from local businesses and organisations, University of Notting-ham staff and students. All participants held a full UK driving licence (average number of years holding licence 16 years), were aged between 21 and 65, drove at least 3000 miles per year (range 3000–25,000, average 9000 miles) and had driven on a motorway in the last 6 months (on average 1–2 days each month).
4.2 Apparatus and materials
The study took place in the University of Nottingham driving simulator. This simulator is fixed-base, of medium
fidelity, and utilises the front half of a 2001 Honda Civic (see Fig.1). The simulator provides a 270 wrap-around image of a driving scene on a curved screen via three overhead projectors, together with a back and side pro-jection (for mirrors). Drivers are able to interact with the scene using the original steering wheel, pedals and indi-cators. The simulator has a sound environment comprised of vehicle, wind and road noise, with low-frequency engine noise vibration simulated through the drivers’ seat and pedals using transducers. STISIM (http://www.system stech.com/) software provides considerable flexibility for the research team to manipulate the driving experience to investigate issues of interest.
[image:5.595.309.542.288.459.2]All signs were displayed during the scenario and simu-lator studies using the standard font as used on UK motorway VMS (see Fig.2).
Table 1 Groups of legends evaluated and data collected
Legend set type Scenario and
simulator
Data collected
1. Severe weather and other traffic messages
Scenario Perceived usefulness, predicted behaviour
2. Safety and information messages Scenario and simulator
Predicted behaviour (change of route), rationale for behaviour
3. Incident warning messages Scenario Message ease of comprehension, predicted likelihood of behaviour (reduction of speed)
Fig. 1 Driving simulator displaying VMS
[image:5.595.369.480.507.555.2] [image:5.595.52.540.612.715.2]4.3 Procedure
Participants completed a consent form before completing the study. The studies took between 1.5 and 2 h. Each participant was paid £30 to compensate for the time taken to complete the study.
The following sections discuss the specific procedure for each set of signs
4.3.1 Set 1: Severe weather and other traffic messages
Table2shows the messages presented to participants. All messages were presented the messages on a computer screen using PowerpointTM.
Participants were asked to imagine that they were driving down the motorway and saw the message on a VMS. For message 1 they were told that today’s date in the scenario was the morning of 24 January; for message 6 they were told that they were in stationary traffic.
Participants were asked the following questions about each message: (1) Do you think this message would be useful? (yes/no written response required); (2) What do you think people should do if they saw this message? (open-ended written response required); (3) What do you think you would do if you saw this message? (open-ended written response required).
4.3.2 Set 2: Safety and information messages
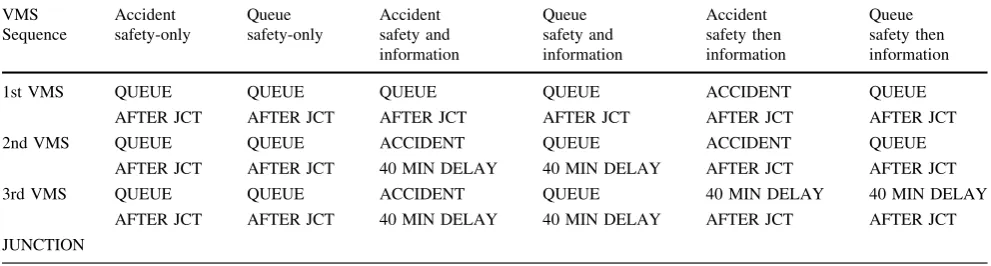
This legend set was evaluated in two ways—firstly in an offline ‘scenario study’ and secondly after a sequence of legends was presented within a driving simulator. These signs either gave a safety-only message (i.e. stating that there was queuing traffic ahead) or added information to this safety message [e.g. providing some information about the length of the delay the cause of the queue (an acci-dent)]—this information was either provided on the same sign as the safety message or a separate sign. Table3
shows the legend sets presented. The order of the signs was determined by the standard presentation protocols used on the UK highways network.
Scenario study For all five sequences of messages (safety-only, accident/queue safety and information, acci-dent/queue safety then information), participants were presented with the signs in an offline ‘scenario study’. This approach presented participants with a scenario in which they were driving to a specific location, with some pres-sures on time for their journey. They were told that turning off the motorway would result in an increase in journey length of approximately 20 miles.
Participants were then presented with a sequence of three VMS images and asked ‘How likely would you be to turn off at the next junction (which will add 20 miles to your journey)?’ They then gave the response either (a) I would definitely turn off, (b) I might turn off, (c) I am unlikely to turn off or (d) I definitely wouldn’t turn off. All participants were presented with all signs. The participants were then asked to verbally respond to the question ‘Why is that’ and the researcher noted down any responses. The order of presentation of the different message sequences was balanced for participants to prevent order effects, and all participants were presented with all five sequences.
[image:6.595.51.291.414.523.2]Driving simulator studyThe simulator journey consisted of a sequence of: signs; two junctions (after three blank signs, and after VMS 30); and concluded with a queue of Table 2 Set 1: Severe weather and other traffic messages
1. SEVERE WEATHER
WARNING ISSUED
MONDAY 24TH JAN
2. M25 J12 TO J19
HEAVY SNOW DUE
AVOID AREA
3. SNOW TODAY
AVOID AREA
4. SEVERE FLOODING
STAY IN VEHICLE
5. SERIOUS ACCIDENT
CLEARANCE IN
PROGRESS
6. HGV OVERTURNED
[image:6.595.50.546.570.703.2]TURN OFF ENGINE
Table 3 Sequence of VMS legends presented for legend set 2 (note that due to UK legend convention, the label ‘queue’ is still used in most situations well in advance of an incident, whether the incident is a queue or an accident)
VMS Sequence
Accident safety-only
Queue safety-only
Accident safety and information
Queue safety and information
Accident safety then information
Queue safety then information
1st VMS QUEUE
AFTER JCT
QUEUE
AFTER JCT
QUEUE
AFTER JCT
QUEUE
AFTER JCT
ACCIDENT
AFTER JCT
QUEUE
AFTER JCT
2nd VMS QUEUE
AFTER JCT
QUEUE
AFTER JCT
ACCIDENT
40 MIN DELAY
QUEUE
40 MIN DELAY
ACCIDENT
AFTER JCT
QUEUE
AFTER JCT
3rd VMS QUEUE
AFTER JCT
QUEUE
AFTER JCT
ACCIDENT
40 MIN DELAY
QUEUE
40 MIN DELAY
40 MIN DELAY
AFTER JCT
40 MIN DELAY
AFTER JCT
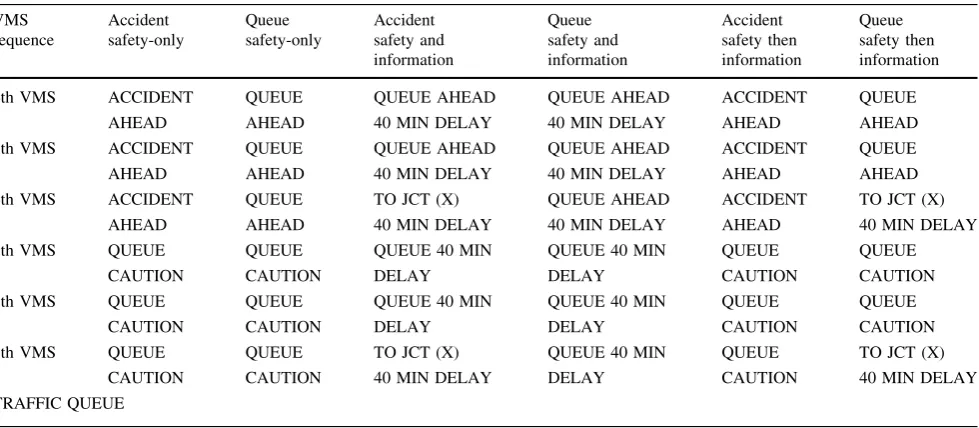
stationary traffic before which participants were required to brake. Participants were presented with a subset of the same series of traffic safety and information signs as used in the scenario study set 2 during a simulated drive in the Human Factors Driving Simulator at the University of Nottingham. After this sequence of signs, participants were asked to state their likelihood of turning off in the same manner as the question that was asked for legend set type 2. Table4 shows the contents of the final six VMS legends that were displayed to simulator participants. All partici-pants were presented with two sets of signs on separate drives, with an additional condition for some participants where all signs were blank. Each combination of signs was viewed by 24 participants (although as the queue and accident safety-only sign set was identical this condition includes data from 48 participants).
Participants were asked during the driving scenarios how likely they would be to turn off at the next junction they came to. The question was asked half a mile before the junction, after viewing VMS 3. Participants responded using one of the following responses on a scale of 1–4: ‘I would definitely turn off’, ‘I might turn off’, ‘I am unli-kely to turn off’, ‘I definitely wouldn’t turn off’ to the question ‘How likely would you be to turn off at the next junction’. Performance variables collected from the driving simulator included: SD (Standard Deviation) of lane position[a measure of variability of the driver’s lane position, considered to be a sensitive measure of visual distraction (Burnett 2008)]; SD of speed [a measure of variability of driver’s speed, considered to be a sensitive measure of driver workload, as drivers typically slow down when workload increases (Burnett2008)];Headway
(the distance between the front of the participant’s vehicle and the back of the vehicle they were instructed to fol-low); and Speed profile (variation in speed over a set journey section).
4.3.3 Set 3: Incident warning messages
The third set of messages consisted of a set of signs cur-rently used on the UK road network to inform road users of incidents or congestion ahead on the road. Ten different sign wordings were presented to all participants after they took part in the simulator study: CONGESTION SLOW DOWN; CONGESTION AFTER JCT; QUEUE CAU-TION; DELAYS AFTER JCT; LONG DELAYS AFTER JCT; INCIDENT SLOW DOWN; ACCIDENT SLOW DOWN; CONGESTION CAUTION; QUEUE AFTER JCT; QUEUE AHEAD. In these signs, the abbreviation JCT is routinely used to mean ‘junction’.
Participants were asked to rank the messages firstly in order of how easy they were to understand and secondly in order of how likely the sign would be to make them slow down. The ranking approach was selected to ensure a forced choice and avoid any central tendency bias.
4.4 Data analysis
[image:7.595.55.545.89.303.2]The data collected comprised quantitative and qualitative data. The quantitative participant response data were con-sidered to be ordinal, and thus nonparametric statistical tools were applied. The quantitative simulator data were ratio and met parametric statistics requirements; therefore, ttests and ANOVA were applied. In all cases the relevant Table 4Additional VMS displayed to simulator participants, after
legends listed in Table3 (NB even for the ‘accident’ scenario, the later messages that preceded the traffic queue used the word ‘queue’
rather than ‘accident’ as sign words were selected to fit on a VMS with a maximum number of letters per row of 12)
VMS sequence Accident safety-only Queue safety-only Accident safety and information Queue safety and information Accident safety then information Queue safety then information
4th VMS ACCIDENT
AHEAD
QUEUE
AHEAD
QUEUE AHEAD
40 MIN DELAY
QUEUE AHEAD
40 MIN DELAY
ACCIDENT
AHEAD
QUEUE
AHEAD
5th VMS ACCIDENT
AHEAD
QUEUE
AHEAD
QUEUE AHEAD
40 MIN DELAY
QUEUE AHEAD
40 MIN DELAY
ACCIDENT
AHEAD
QUEUE
AHEAD
6th VMS ACCIDENT
AHEAD
QUEUE
AHEAD
TO JCT (X)
40 MIN DELAY
QUEUE AHEAD
40 MIN DELAY
ACCIDENT
AHEAD
TO JCT (X)
40 MIN DELAY
7th VMS QUEUE
CAUTION
QUEUE
CAUTION
QUEUE 40 MIN
DELAY
QUEUE 40 MIN
DELAY
QUEUE
CAUTION
QUEUE
CAUTION
8th VMS QUEUE
CAUTION
QUEUE
CAUTION
QUEUE 40 MIN
DELAY
QUEUE 40 MIN
DELAY
QUEUE
CAUTION
QUEUE
CAUTION
9th VMS QUEUE
CAUTION
QUEUE
CAUTION
TO JCT (X)
40 MIN DELAY
QUEUE 40 MIN
DELAY
QUEUE
CAUTION
TO JCT (X)
40 MIN DELAY
statistics, degrees of freedom/N and level of significance are reported. Qualitative data were analysed using theme-based content analysis (Neale and Nichols 2001), which aims to group participant responses into relevant themes, whilst retaining the raw data to represent the prevalence of different themes within the overall data set.
5 Results and discussion
5.1 Set 1: Severe weather and other traffic messages
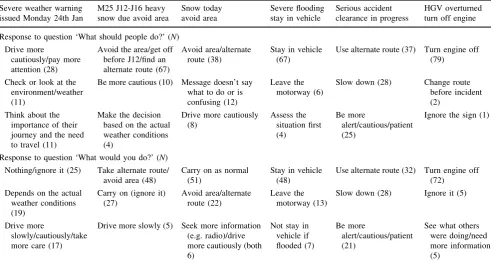
Participants thought that the most useful messages would be ‘HGV Overturned Turn Off Engine’ (N in agreement=74), ‘M25 Jct 12–J16 Heavy Snow Due Avoid Area’ (N=72) and ‘Serious Accident Clearance In Progress’ (N=68). Fifty-four people felt that the message ‘Severe flooding, stay in vehicle’ was useful and there was an exact 50:50 spilt of people who thought that the ‘Severe Weather Warning Issued Mon 24th Jan’ (N=41) message was or was not useful. The message that participants felt was the least useful was ‘Snow Today Avoid Area’ (N=35).
The qualitative data collected (from participant respon-ses to the questions: ‘What do you think people should do if they saw this message?’ and ‘What do you think you would do if you saw this message?’) were analysed using theme-based content analysis (Neale and Nichols 2001). Participants were asked both about their own and others’ potential actions, but no prompts were given to participants
to find out whether there were any other actions other than the ones they had given. In this way, it is hoped that the most salient actions for each individual were verbalised, but this does mean that we cannot state that if an action was not mentioned by a driver, then they would not carry it out. In addition, many participants cited more than one action that either they would do or that they thought others should do.
These data appear to suggest that people use a combi-nation of the information on the sign, other sources of information (such as radio weather reports, visual inspec-tion of the scene, observing behaviour of other drivers) and a judgement of the risk associated with actions (e.g. con-tinuing to drive in snowy conditions, being unwilling to stay in vehicle during flooding) when making decisions about their actions (Table5).
5.2 Set 2: Safety and information messages
5.2.1 Scenario study results
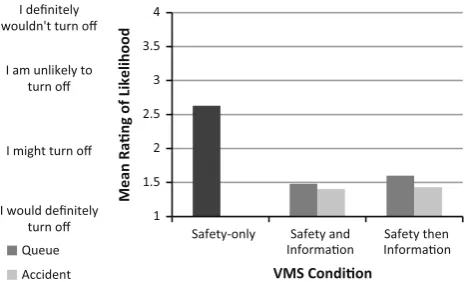
[image:8.595.52.544.449.713.2]Figure3 illustrates that participants were least likely to turn off when presented with the safety-only messages (Queue After Jct, Queue After Jct, Queue After Jct) (vs. safety and info, queue: W =80, N=69, p\0.001; vs. safety and info, accident: W =54.5, N=71, p\0.001; vs. safety then info, queue:W=21.5,N=63,p\0.001; vs. safety then info, accident: W=41, N=41, p\0.001). Participants were also found to be significantly
Table 5 Three most frequently mentioned responses in response to presentation of each severe weather or other traffic message
Severe weather warning issued Monday 24th Jan
M25 J12-J16 heavy snow due avoid area
Snow today avoid area
Severe flooding stay in vehicle
Serious accident clearance in progress
HGV overturned turn off engine
Response to question ‘What should people do?’ (N)
Drive more
cautiously/pay more attention (28)
Avoid the area/get off before J12/find an alternate route (67)
Avoid area/alternate route (38)
Stay in vehicle (67)
Use alternate route (37) Turn engine off (79)
Check or look at the environment/weather (11)
Be more cautious (10) Message doesn’t say what to do or is confusing (12)
Leave the motorway (6)
Slow down (28) Change route
before incident (2)
Think about the importance of their journey and the need to travel (11)
Make the decision based on the actual weather conditions (4)
Drive more cautiously (8)
Assess the situation first (4)
Be more
alert/cautious/patient (25)
Ignore the sign (1)
Response to question ‘What would you do?’ (N)
Nothing/ignore it (25) Take alternate route/ avoid area (48)
Carry on as normal (51)
Stay in vehicle (48)
Use alternate route (32) Turn engine off (72)
Depends on the actual weather conditions (19)
Carry on (ignore it) (27)
Avoid area/alternate route (22)
Leave the motorway (13)
Slow down (28) Ignore it (5)
Drive more
slowly/cautiously/take more care (17)
Drive more slowly (5) Seek more information (e.g. radio)/drive more cautiously (both 6)
Not stay in vehicle if flooded (7)
Be more
alert/cautious/patient (21)
less likely to turn off when presented with the queue, safety then info pattern (Queue After Jct, Queue After Jct, 40 Min Delay After Jct) compared with accident safety and info (Queue After Jct, Accident 40 Min Delay, Accident 40 Min Delay) (W =115,N=29,p\0.001) and accident, safety then info (Accident After Jct, Accident After Jct, 40 Min Delay After Jct) (W =131, N=29, p\0.05). No other differences were statistically significant.
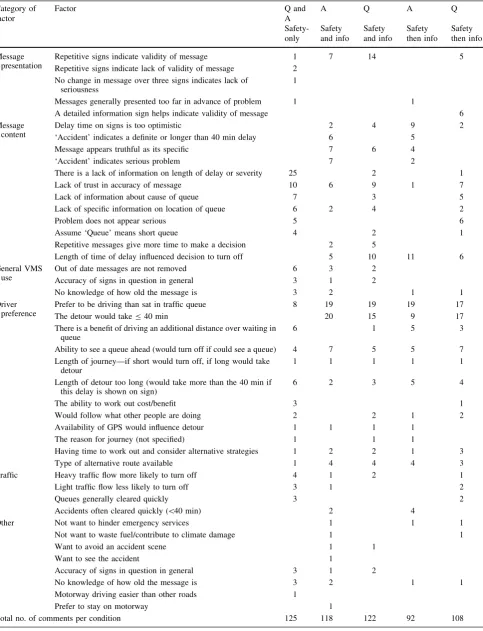
The qualitative data collected were analysed using theme-based content analysis, and the results are shown in Table6below. The factors participants gave for influenc-ing their likelihood or not to turn off were categorised into main themes. The number of times each factor was cited is shown in columns relating to each message sequence. It can be seen that issues highlighted as particularly of importance included the influence of repetition on per-ceived validity of message, concerns about lack of infor-mation in message and influence of specific inforinfor-mation such as length of delay. In addition, the role of factors that cannot be influenced by VMS design, but need to be understood by those implementing VMS, is indicated— particularly personal factors such as preference to be driving rather than stationary in a queue or ability to see a queue ahead of the current driving position.
These results suggest that there is a preference for more information to be displayed where possible and for that information to be quantified (e.g. length of delay). Influ-ences on the extent to which people trust the messages include their perceptions of whether the message is out of date or old—this suggests that people may form a mental model of the message source or the mechanism used to produce the message [e.g. whether it is based on automatic road sensors or based on direct reports or views of current traffic status (such as from police reports or CCTV)]. This mental model will then combine with other factors such as personal preference, detail of information within the sign
and availability of other information, such as visual inspection of the current traffic status, or use of other sources to assess time costs of alternative routes, to influ-ence the driving decisions made.
5.2.2 Simulator study results: journey decision making
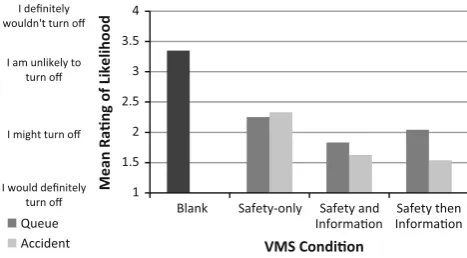
Figure4 shows the responses to the question ‘How likely would you be to turn off?’ administered during the simu-lator trial. There was a significant overall effect of message condition (regardless of whether it was the accident or queue scenario) (X2=37.61;df=3; p\0.001). Partici-pants were more likely to turn when presented with a VMS message than with a blank VMS. Further investigation revealed that all VMS pattern conditions were significantly different from each other, with the exception of safety and information versus safety then information, see Table7
below. There were no significant differences between the data from the accident and queue scenarios.
Mann–WhitneyUtests (see Table7) were conducted to identify the source of any overall effect of message pattern and obtain individual comparisons of scenario (queue vs. accident) for each message pattern. The effect of scenario (whether accident or queue) was also examined. No dif-ference was found between the two scenarios for any of the three VMS patterns.
It is interesting to note that there was no difference between responses to the accident and queue signs in the simulator study, in contrast to the indicated difference obtained within the scenario study (where accident appeared to be more likely to influence individuals to turn off in comparison with queue). This may demonstrate the value of the higher power that is obtained by using more participants in the scenario study (where it was possible to show all signs to all participants) compared with the time-limited simulator study, where only a small number of signs could realistically be shown to participants within an individual journey.
5.2.3 Simulator study data: driving performance
Driving performance data were analysed for the journey as a whole, and then, for a subset of drivers, specific responses to individual elements of the driving journey.
Figure5shows the mean and SD of lane position for the different experimental conditions. Analysis of the SD of lane position (reciprocal transformation applied) revealed an overall effect of VMS pattern (F =2.778, df=3160, p\0.05). The source of this significance appears to be a higher standard deviation with the safety and information VMS pattern compared to safety-only messages (Tukey HSD=0.1733, p=0.058). Although this is the largest difference between conditions, it is not significant at 1
1.5 2 2.5 3 3.5 4
Safety-only Safety and
Informaon
Safety then Informaon
Mean Rang of Likelihood
VMS Condion Queue
Accident I definitely wouldn't turn off
I am unlikely to turn off
I might turn off
I would definitely turn off
[image:9.595.54.289.58.199.2]Table 6 Factors given that affected alternative route choice decisions (S=safety, I=information; A=accident, Q=queue)
Category of factor
Factor Q and
A
A Q A Q
Safety-only
Safety and info
Safety and info
Safety then info
Safety then info
Message presentation
Repetitive signs indicate validity of message 1 7 14 5
Repetitive signs indicate lack of validity of message 2 No change in message over three signs indicates lack of
seriousness
1
Messages generally presented too far in advance of problem 1 1
A detailed information sign helps indicate validity of message 6
Message content
Delay time on signs is too optimistic 2 4 9 2
‘Accident’ indicates a definite or longer than 40 min delay 6 5
Message appears truthful as its specific 7 6 4
‘Accident’ indicates serious problem 7 2
There is a lack of information on length of delay or severity 25 2 1
Lack of trust in accuracy of message 10 6 9 1 7
Lack of information about cause of queue 7 3 5
Lack of specific information on location of queue 6 2 4 2
Problem does not appear serious 5 6
Assume ‘Queue’ means short queue 4 2 1
Repetitive messages give more time to make a decision 2 5
Length of time of delay influenced decision to turn off 5 10 11 6
General VMS use
Out of date messages are not removed 6 3 2
Accuracy of signs in question in general 3 1 2
No knowledge of how old the message is 3 2 1 1
Driver preference
Prefer to be driving than sat in traffic queue 8 19 19 19 17
The detour would takeB40 min 20 15 9 17
There is a benefit of driving an additional distance over waiting in queue
6 1 5 3
Ability to see a queue ahead (would turn off if could see a queue) 4 7 5 5 7
Length of journey—if short would turn off, if long would take detour
1 1 1 1 1
Length of detour too long (would take more than the 40 min if this delay is shown on sign)
6 2 3 5 4
The ability to work out cost/benefit 3 1
Would follow what other people are doing 2 2 1 2
Availability of GPS would influence detour 1 1 1 1
The reason for journey (not specified) 1 1 1
Having time to work out and consider alternative strategies 1 2 2 1 3
Type of alternative route available 1 4 4 4 3
Traffic Heavy traffic flow more likely to turn off 4 1 2 1
Light traffic flow less likely to turn off 3 1 2
Queues generally cleared quickly 3 2
Accidents often cleared quickly (\40 min) 2 4
Other Not want to hinder emergency services 1 1 1
Not want to waste fuel/contribute to climate damage 1 1
Want to avoid an accident scene 1 1
Want to see the accident 1
Accuracy of signs in question in general 3 1 2
No knowledge of how old the message is 3 2 1 1
Motorway driving easier than other roads 1
Prefer to stay on motorway 1
p\0.05, possibly due to the assumptions associated with ANOVA still being violated, despite reciprocal transfor-mations having been applied. There was no significant difference between the accident and queue scenarios (safety-only: t=1.731, df=37.92, p[0.05; safety and information: t=0.283, df=46, p[0.05; safety then information:t=1.086, df=46,p[0.05).
Figure6 shows the data obtained for the SD of speed throughout the journey. A one-way ANOVA to examine effect of VMS pattern revealed no significant differences (F=0.957, df=3160, p[0.05). There was also no significant effect of queue or accident scenario (safety-only:t=1.502, df=27.429, p[0.05; safety and infor-mation: t=0.528, df=46, p[0.05; safety then infor-mation:t=0.610, df=46,p[0.05).
Figure7shows the speed profile for drivers through the distraction zone for VMS4 (QUEUE AFTER JCT) in the Accident—Safety and Information Condition (n=23). The data show that driver speed generally reduced during the distraction zone (700 ft before and 300 ft after the VMS) by approximately 2 mph. This can be seen by the trend line (in black on the graph) which shows a decrease in speed. There were, however, clearly large individual differences between drivers as can be seen by the spread of driver speeds on the graph.
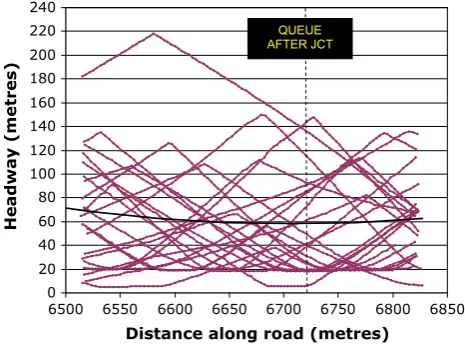
The headway profile for drivers through the distraction zone for VMS4 (Queue After Jct) in Fig.8 shows that
headway was not particularly affected through the dis-traction zone for VMS 4 (as shown by the close to hori-zontal black trend line), but there are considerable individual differences. Some people adopted headway positions of\10 m through the zone, whereas one adopted a headway in excess of 200 m.
The analysis of the simulator performance data in gen-eral indicated that there was no difference in performance for the different VMS message patterns (blank, safety-only, safety and info or safety then info) and scenarios (accident or queue). This suggests that the presence of VMS does not overall cause any change, positive or negative, in key aspects of driving behaviour, and that drivers are able to maintain performance whilst attending to the differing VMS examined in this study. In many cases, the effects of individual differences were greater than any effects due to the VMS content. This demonstrates that the presence of VMS content related to information need not be detri-mental to driver performance in acting on the presence of a traffic queue ahead. Again, there was no difference between the performance measures in the accident and queue scenarios. It is worth noting that the resolution of the simulator did mean that the time period for which the signs were legible was less than would be seen in the real-world condition, so caution must be used if transferring these 1
1.5 2 2.5 3 3.5 4
Blank Safety-only Safety and
Informaon
Safety then Informaon
Mean Rang of Likelihood
VMS Condion Queue
Accident I definitely wouldn't turn off
I am unlikely to turn off
I might turn off
I would definitely turn off
[image:11.595.52.286.58.187.2]Fig. 4 Participant responses to question ‘How likely would you be to turn off’ administered during simulator study
Table 7 Effect of VMS pattern on reported likelihood of turning off (NS signifies a non-significant result)
Comparison U N1 N2 p
Blank versus safety-only 214 20 48 \0.001
Blank versus safety and information 114.5 20 48 \0.001
Blank versus safety then information 127 20 48 \0.001
Safety-only versus safety and information 752 48 48 \0.005
Safety-only versus safety then information 792 48 48 \0.01
Safety and information versus safety then information 1108 48 48 [0.05 (NS)
0 0.2 0.4 0.6 0.8 1 1.2
Blank Safety-only Safety and info
Safety then info
Mean of SD of lane position
Queue
Accident
[image:11.595.310.543.58.201.2] [image:11.595.180.544.588.688.2]results directly to the real world; as with many simulator studies, it is appropriate to make inferences for relative measures (i.e. presence or absence of differences between conditions) but less appropriate to make absolute infer-ences (i.e. assuming that the actual speed in the driving simulator would be the same as seen in the real world). Overall, the lack of significant differences between the conditions implies that there was no effect of VMS sign on driving performance. Drivers did not differ in their ability to maintain a smooth driving profile.
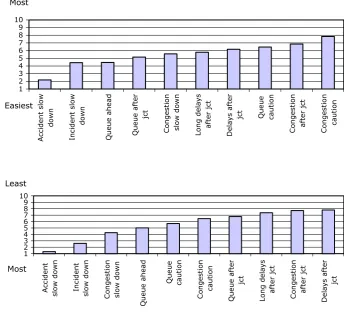
5.3 Set 3: Incident warning messages
Participants were asked to rank the 10 VMS messages in order from easiest to most difficult to understand. Figure9 shows the order of rankings obtained (N=81). A series of Wilcoxon tests were applied to identify which of the signs were statistically equivalent in terms of the ranked ease of understanding, and the following were found to be equivalent (i.e. not signifi-cantly different from each other at p\0.05: homoge-neous subsets): Group 1: Accident Slow Down (significantly easier to understand than all other signs); Group 2: Incident Slow Down, Queue Ahead, Queue After Jct; Group 3: Queue After Jct, Congestion Slow Down, Long Delays After Jct; Group 4: Long Delays After Jct, Delays After Jct, Queue Caution; Group 5: Queue Caution, Congestion After Jct; Group 6: Congestion Caution (significantly more difficult to understand than all other signs).
Figure10 shows the mean ranking in response to the question ‘Which message would be most likely to make you slow down?’ A series of Wilcoxon tests (N=82) were applied to identify which of the signs were sta-tistically equivalent in terms of the ranked likelihood of slowing down, and the following were found to be equivalent (i.e. not significantly different from each other at p\0.05: homogeneous subsets): Group 1: Long Delays After Jct, Congestion After Jct, Delays After Jct; Group 2: Congestion Caution, Queue After Jct. All other messages were statistically significantly different from each other. It can be seen that, unsur-prisingly, the messages most likely to make drivers slow down are those that include the specific instruction ‘slow down’. It is interesting to note that the four messages that were least likely to encourage drivers to slow down included the phrase ‘after jct’—this suggests that non-specific location (or some distance down-stream) of the delays, congestion or queue may not be particularly effective at encouraging drivers to reduce 0
1 2 3 4 5 6
Blank Safety-only Safety and info
Safety then info
Mean of SD of speed (mph)
Queue
Accident
Fig. 6 Mean and SD of standard deviation of speed for different VMS patterns and scenarios
60 62 64 66 68 70 72 74
6500 6550 6600 6650 6700 6750 6800 6850
QUEUE AFTER JCT
Distance along road (metres)
Speed (mph)
Fig. 7 Speed profile for drivers through distraction zone for VMS 4 (Queue After Jct) (vertical dotted linedenotes the position of the sign on the road)
0 20 40 60 80 100 120 140 160 180 200 220 240
6500 6550 6600 6650 6700 6750 6800 6850
QUEUE AFTER JCT
Distance along road (metres)
Headway (metres)
[image:12.595.53.288.58.201.2] [image:12.595.54.287.252.400.2] [image:12.595.53.286.466.638.2]their speed. The data therefore suggest that specific instructions and avoidance of ambiguous location information (such as the phrase ‘after jct’) will result in an increased likelihood to change behaviour after viewing the VMS. This may be due to an increased trust in information due to lower ambiguity or may indicate that people consider the situation to be more serious or dangerous when the phrase ‘slow down’ is included and therefore are more likely to follow the instruction.
6 Conclusions
A number of findings from the study reinforced findings that had previously been reported in the literature and demonstrate some issues that are particularly important in the UK motorway network context. Firstly, the value of repetition is clear. This is a finding that has not emerged strongly in past research, but the results from the analysis of the legends in set two demonstrated that drivers reported that they would be more likely to slow down if a legend was repeated. Qualitative data reinforced this, where par-ticipants reported that the repetition of signs was an indi-cation of validity, and thus implicitly they would be more likely to trust them and change their behaviour as
necessary. Therefore, in designing information to be pre-sented to influence decision making, our data suggest that repetition will influence trust; it is likely that this influence would be even stronger if the information that is repeated is perceived to come from different sources (e.g. formally provided information from an official body and informa-tion obtained from crowd sourcing or social media).
The inclusion of additional information about the traffic conditions ahead also had an influence on behaviour, consistent with previous findings from Bonsall and Palmer (1999), Wardman et al. (1997), Hidas and Awadalla (2006) and Schroeder and Demetsky (2010). The set two legends demonstrated that the inclusion of information about the length of delay resulted in participants reporting that they would be more likely to change their route and divert compared with information that merely stated that there was a queue after the junction.
The meaningfulness of the incident also appears to have an effect—set three data suggest that reporting an ‘acci-dent’ is more likely to encourage drivers to slow down compared to an ‘incident’ or ‘congestion’. This may be because the specific nature of the information encourages drivers to believe it, or may be that drivers perceive that an accident is more serious than congestion. This, in addition to the preference for the instructional words ‘slow down’ rather than the advisory words ‘caution’ or ‘after jct’,
1 2 3 4 5 6 7 8 9 10
Accident slow
down
Incident slow
down
Queue ahead Queue after
jct
Congestion slow down Long delays after jct Delays after
jct Queue caution
Congestion after jct Congestion
caution
Easiest Most Fig. 9 Mean ranking of ease of
understanding of VMS content
1 2 3 4 5 6 7 8 9 10
Accident slow down Incident
slow down Congestion slow down
Queue ahead
Queue caution
Congestion
caution
Queue after
jct
Long delays
after jct
Congestion after jct Delays after
jct
Most Least Fig. 10 Mean ranking of
[image:13.595.199.544.61.373.2]supports the preference for specific content in legends, as found by Wang et al. (2005) and Pedic and Ezrakhovich (1999). A recommendation from these data would be to provide specific information wherever possible to reinforce trust in the data.
Finally, sets one and two particularly highlighted the role of contextual information in decision making. As in all areas of interaction design, it is critical that we do not consider information or interface design in isolation of the context in which it is implemented. This builds on the previous findings by Bonsall and Palmer (1999) related to the role of personal experience of the network in driver behaviour and decision making, but brings in additional factors. In the context of driving presented here, contextual information is represented by previous experience of dri-vers, but also knowledge and expectation of drivers (e.g. anticipation of what might happen if they do in fact remain in their car during flooding) and awareness of behaviour of other drivers on the road. In other travelling contexts, these variables might also apply—experience of a public trans-port route or observation of behaviour of other passengers. Therefore, we can make the following recommendations regarding sign design:
• Where possible, repeat information—drivers appear to trust repeated information more, and repetition of signs up to three times does not seem to adversely affect trust or annoy drivers excessively
• Give instructions if a change in behaviour is required— if drivers are required to slow down, it is better to explicitly instruct this action, rather than simply to warn drivers of the presence of the upcoming conges-tion/incident.
• Include detail where space allows—this improves trust and thus makes drivers more likely to follow instruc-tions/consider alternative routes
• Provide instructions that are consistent with expected behaviours—drivers are more likely to follow advice that seems sensible; this may therefore require a programme of education about what a ‘sensible’ behaviour in situations such as flooding might be • Be specific and meaningful—if possible, provide
information about the cause of congestion. The pres-ence of this information encourages drivers to trust it and follow any advice.
The study presented here also demonstrates the value of applying different methods (the scenario context and the simulator study) and comparing results obtained from each. Of course, if we are able to implement changes in a real-world context, then we are provided with the ultimate benchmark of behaviour, but in time-critical and safety-critical contexts such as travel this is often neither practi-cable nor safe. The absence of a negative effect on driving
behaviour in the simulator performance data is reassuring, but the need for caution in implementing particularly com-plex or engaging signs in a driving context remains, and it is important to continue to explore methods for evaluating the impact of introducing such information into a highways context. In addition, the number of signs used within this study was limited and the motorway scenario presented was quite simple; it may be the case that if such VMS or information is implemented in different types of traffic contexts, where perhaps more alternative routes are avail-able, the impact of VMS on behaviour would be different.
The increasing use of sensor-based technology to record individual and journey-specific information, however, does mean that collection of large-scale movement data is beginning to become easier; in addition, the source of data to inform decision making is increasingly varied, ranging from formally delivered information from agencies such as the Highways Agency to information propagated via social media. Future sign content and presentation research need to take account of these developments and ensure that information is designed to influence decision making to enhance road user satisfaction and enable efficient man-agement of highway congestion.
Acknowledgments The views expressed in this paper are solely those of the authors and do not necessarily represent the views of the Highways Agency or Mott MacDonald. The work presented in this paper was funded by the Project Support Framework and conducted in partnership with Mott MacDonald for the UK Highways Agency. The authors would particularly like to thank Damian Morris, Paul Whitehead, Bob Meekums and Andy Poole for their support in the work presented in this paper.
Open Access This article is distributed under the terms of the Creative Commons Attribution 4.0 International License (http://crea tivecommons.org/licenses/by/4.0/), which permits unrestricted use, distribution, and reproduction in any medium, provided you give appropriate credit to the original author(s) and the source, provide a link to the Creative Commons license, and indicate if changes were made.
References
Bai Y, Finger K, Li Y (2010) Analyzing motorists’ responses to temporary signage in highway work zones. Saf Sci 48:215–221 Bonsall PW, Palmer IA (1999) Route choice in response to variable message signs: factors affecting compliance. In: Emmerink R, Nijkamp P (eds) Behavioural and network impacts of driver information systems. Ashgate, Aldershot
Burnett GE (2008) Designing and evaluating in-car user-interfaces. In: Lumsden J (ed) Handbook of research on user-interface design and evaluation for mobile technology. Idea Group Inc, Hershey CDOT (2005) CDOT guidelines on variable message signs (VMS).
Dutta A, Fisher, DL, Noyce DA (2004) Use of a driving simulator to evaluate and optimize factors affecting understandability of variable message signs. Transp Res Part F Traffic Psychol Behav 7:209–227
Hidas P, Awadalla E (2006) Modelling driver response to variable message signs for incident management. Road Transp Res 12(2):15–30(ARRB, Australia)
Luoma J, Ra¨ma¨ P, Penttinen M, Anttila V (2000) Effects of variable message signs for slippery road conditions on reported driver behaviour. Transp Res Part F 3:75–84
Neale H, Nichols S (2001) Theme-based content analysis: a flexible method for virtual environment evaluation. Int J Hum Comput Stud 55(2):167–189
Parkes A (2012) The essential realism of driving simulators for research and training. In: Gkikas N (ed) Automotive Ergo-nomics-Driver-Vehicle Interaction. CRC Press, London Pedic F, Ezrakhovich A (1999) A literature review: the content
characteristics of effective VMS. Road Transp Res 8(2):3–11 Ra¨ma¨ P, Kulmala R (2000) Effects of variable message signs for
slippery road conditions on driving speeds and headways. Transp Res Part F 3:85–94
Santos J, Merat N, Mouta S, Brookhuis, K, de Waared D (2005) The interaction between driving and in-vehicle information systems: comparison of results from laboratory, simulator and real-world studies. Transp Res Part F Traffic Psychol Behav 8:135–146 Schroeder JL, Demetsky MJ (2010) Evaluation of driver reactions for
effective use of dynamic message signs in Richmond, Virginia. Final report VTRC 10-R16, Virginia Transportation Research Council, Virginia, USA
Wang J-H, Collyer CE, Yang C-M (2005) Enhancing driving safety through proper message design on variable message signs. URITC Project no. 000052, September 2005, prepared for University of Rhode Island, Transportation Research Centre, Kingston, Rhode Island, USA
Wardman M, Bonsall PW, Shires JD (1997) Driver response to variable message signs: a stated preference investigation. Transp Res Part C 5(6):389–405