Experimental investigation on the dynamic response of
1
RC flat slabs after a sudden column loss
2
J.M. Russella,∗, J.S Owena, I. Hajirasoulihab
3
aFaculty of Engineering, The University of Nottingham, UK
4
bDepartment of Civil and Structural Engineering, The University of Sheffield, UK
5
Abstract
6
To prevent disproportionate collapse under an extreme loading event, a sudden
7
column loss scenario is often used to ensure the structure has suitable robustness.
8
This study aims to investigate experimentally the dynamic response of reinforced
9
concrete flat slabs after a sudden column loss. Seven 1/3 scale reinforced concrete
10
flat slabs were tested under static load increases or dynamic column removal cases
11
with different supports removed. Reaction forces and deflections were recorded
12
throughout, along with reinforcement strains and concrete cracking patterns.
Dur-13
ing dynamic tests, a high speed camera was used to capture the dynamic motion.
14
The experiments demonstrated that flat slabs, in general, are able to redistribute
15
their loading effectively after a column loss. Although large levels of damage were
16
observed, collapse due to flexural failure did not occur. However, punching shear
17
was shown to be an issue due to the additional vertical loading on the adjacent
18
supports. The inclusion of continuous bottom reinforcement through a column
19
did not significantly improve the capacity, as the new load path is not primarily
20
through the removed column location. The results also indicate that the dynamic
21
effects due to a sudden column loss can be significant as deflections of up to 1.5
22
times the static case were measured within the elastic range. It is also shown that
the Dynamic Amplification Factor (DAF) reduces when nonlinear damaging
ef-24
fects are included, which implies conventional code-based design methods for flat
25
slab structures may be over conservative. Additionally, the increase in material
26
strength due the strain rates is not viewed to be significant.
27
Keywords: Progressive Collapse, Column Loss, RC Flat Slab, Punching Shear,
28
Dynamic Amplification
29
1. Introduction
30
The issue of protecting structures against progressive failure has been a key
31
part of design considerations since the collapse of Ronan Point tower block in
32
1968, where a relatively small gas explosion on the 18th floor led to the collapse
33
of a corner of the structure resulting in several deaths [1]. The issue arose again
34
after the bombing of a federal building in Oklahoma, involving a car bomb
dam-35
aging an external column that was supporting a transfer beam. The partial collapse
36
killed 168 people, the majority due to the collapse progressing through the
struc-37
ture, rather than in the direct blast area [2, 3]. Progressive failure, mainly due
38
to punching shear, has also occurred on flat slab structures, including the Pipers
39
Row car park (1997) [4] and Sampoon Department store (1995) [5]. As a result
40
of these events, design codes usually require consideration of the potential for
41
progressive collapse. This is commonly achieved by ensuring that the structure
42
can survive the accidental removal of an individual member without experiencing
43
disproportionate damage [6].
44
This situation has been investigated by a number of authors to determine the
45
failure mechanisms and ultimate capacity of Reinforced Concrete (RC) frames
46
after a column loss event. These have included experimental tests on Reinforced
Concrete (RC) frames [7–9]. Sasani et al. has conducted a number of tests on real
48
structures to investigate the global response and potential for progressive failure
49
of RC structures [10–13]. The importance of nonlinear effects, both material and
50
geometric, has been highlighted in providing additional capacity and preventing
51
progressive failures. However, sufficient ductility is required to allow yielding and
52
the development of catenary action, otherwise brittle failures may occur.
53
Further consideration has been given to the presence of slab elements, which
54
have been shown to increase the capacity of a structure after a column loss [14,
55
15]. RC slabs have complicated behaviour at high deflections due to their two
56
dimensional nature allowing formation of tensile and compressive membranes
57
[16–19]. Furthermore, their susceptibility to brittle mechanisms such as punching
58
shear [20–23] may potentially lead to progressive collapse.
59
The general behaviour of reinforced concrete slab elements is well known,
60
however, there has been only limited investigations into their performance against
61
progressive collapse. Hawkins and Mitchell [24], Mitchell and Cook [25] and
62
Yagob et al. [26] have addressed some of the issues and Yi et al. [27] recently
63
conducted limited tests to study the quasi-static response. Their results provide
64
valuable insights into the nonlinear behaviour but further tests are still required.
65
Progressive collapse is also a dynamic issue and suitable account needs to be
66
taken of the inertial effects involved after a sudden damaging event [28, 29]. This
67
can be done by conducting a full dynamic analysis of the structure; however this
68
is time consuming and requires detailed information in order to achieve accurate
69
results. Alternatively, an equivalent static case can be considered with a Dynamic
70
Amplification Factor (DAF) applied to the loading. Current design
recommenda-71
tions usually suggest a DAF of 2.0 [30]. The suitability of this value has been
studied for some structural types, with some authors suggesting it is over
conser-73
vative [31–34]. However, further investigation is needed for flat slab structures.
74
This study aims to provide much needed experimental evidence for the
be-75
haviour of flat slabs after a sudden column loss, especially considering the
nonlin-76
ear and dynamic effects. Scaled slab models were investigated to simulate the
dy-77
namic response of flat slab elements in different column loss scenarios. Dynamic
78
results under different levels of loading were compared to static tests to assess the
79
additional damage sustained due to inertial effects. Although it is recognised that
80
the simplifications involved in the experimental programme do not completely
81
replicate real structures, the set up is better suited for future modelling with finite
82
element software. Additionally, the key aspects involved can still be considered,
83
allowing future work to focus on the important factors. In particular the details
84
regarding the redistribution of forces and the damage patterns after an extreme
85
event provide an indication of the potential for collapse of a structure. The results
86
from this work will later be used to validate further numerical investigations into
87
this issue.
88
2. Experimental Procedure
89
To investigate the behaviour of in-situ RC flat slab structures, seven 1/3 scale
90
simplified substructures were constructed, as shown in Figure 1. These allowed
91
simulation of the removal of a corner, penultimate edge or an internal edge
col-92
umn. Additionally, different reinforcement layouts were considered. Two types of
93
tests were conducted, an increase in static loading and a sudden dynamic column
94
removal. Under the static case, the slab was placed on the supports and the
col-95
umn position under investigation was removed. A uniform load was then imposed
across the entire sample by means of sand and gravel bags. Support reactions,
97
deflections, strains and cracking patterns were recorded throughout. Under the
98
dynamic removal, a similarly designed slab cast at the same time as the static, was
99
loaded whilst fully supported. Once the required UDL was achieved, the chosen
100
support was removed and the system allowed to deform and either reach a new
101
equilibrium or experience total failure. During the test the response was recorded
102
with load cells, strain gauges, LVDTs and a high speed camera.
103
3. Test setup
104
3.1. Comparison to real structures
105
The substructures constructed were based on a typical structural arrangement
106
but with simplifications which made it easier to conduct the experiments and to
107
compare the results to numerical models. Rather than replicate the partial
rota-108
tional and translational restraint that slab-column connections provide, simplified
109
supports were used. Although it is known that this does not represent conditions
110
found in real structures, these assumptions are easier to model for later numerical
111
analysis in order to validate material and mechanical behaviours. Additionally,
112
under a penultimate edge column removal condition, the immediate section of
113
slab is laterally unrestrained, as described by Dat and Hai [18], and therefore the
114
use of such supports is not considered to affect significantly the ability of the slab
115
to form mechanisms such as compressive rings for membrane action.
116
The scaled models were designed to have an equivalent demand to capacity
117
ratio as a full size prototype based on the method presented by Kai and Li [32].
118
For third scale tests, span and depth values were reduced by factor of 3, UDL by
119
constant. The span to depth ratio of all the specimens was 25, which is within the
121
range of values for typical flat slab structures.
122
3.2. Slab design
123
All the slabs were designed to Eurocode 2 [35]. Along with the slab
self-124
weight, the design considered additional finishes of 1kN/m2and a variable action
125
of 2.5kN/m2. The characteristic cube strength used in the design was 30MPa.
De-126
tails of the test specimens are given in Table 1 along with concrete cube strengths
127
taken from samples on the day of testing. Some variation in the concrete strength
128
can be seen between the tests, and the concrete is below its target strength for tests
129
C-S and C-D. However, for the majority of the discussion, comparisons are only
130
made between tests with similar strengths.
131
For the first six tests, a 2x1 bay subsection of a flat slab structure was
con-132
structed. The specimens were 4100mm x 2100mm in plan with a thickness of
133
80mm. Each sample included two A142 meshes providing 6mm bars at 200mm
134
spacing for both top and bottom reinforcement (ρ=0.18%). Additional 6mm bars
135
were added over internal supports in the column strip to meet requirements for the
136
hogging moment (ρ = 0.21%). No shear reinforcement was included as the
con-137
crete alone provided enough capacity for a fully supported condition according
138
to Eurocode requirements. This set up was used to replicate both the corner (C)
139
and the penultimate (P) column loss as shown in Figure 1(a). The reinforcement
140
design provided the minimum reinforcement area for both top and bottom steel
141
according to Eurocode 2 [35], a condition that governed in the middle strips. For
142
comparison purposes an equivalent series of tests were conducted without bottom
143
rebar through the column location for the penultimate location tests, designated
144
PC and PR, where C indicates continuous and R indicates reduced.
The final test considered a middle (M) column removal using a 4x1 bay
sys-146
tem, constructed in the same manner, with a total length of 8100mm (Figure 1(b)).
147
3.3. Support details
148
The supports were 135mm square steel plates, 25mm thick, on hemispherical
149
bearings to allow rotations. The supports were considered to be pinned, free to
ro-150
tate in any direction and allow the slab to uplift, see Figure 1(c). For the dynamic
151
tests, a temporary support that could be quickly removed was constructed. The
152
temporary support was designed based on a vertical steel bar between two steel
153
plates. The bottom plate rested on a load cell and steel rollers to allow the
sup-154
port to move easily. The removal process used is shown in Figure 2. During the
155
pre-loading period, chocks were placed to prevent lateral movement and a clamp
156
placed around the bar to ensure it remained upright; see Figure 2(a) for details.
157
Once the required loading was reached, and the laboratory area around the test
158
had been cleared, the temporary supports and clamps were removed to create an
159
unstable condition (Figure 2(b)). Finally, a rope attached to the bar was pulled
160
sharply, causing the support base to move and the bar to disengage with the slab,
161
as in Figure 2(c). This system did not cause a true instantaneous removal,
how-162
ever, as the purpose of these tests is to provide information to validate a numerical
163
model, this limitation will be addressed in later work.
164
An example of the test set up is given in Figure 3 showing a fully loaded
165
sample prior to the sudden removal of the front middle support.
166
3.4. Instrumentation
167
Each support included a load cell to measure the vertical reactions, see Figure
168
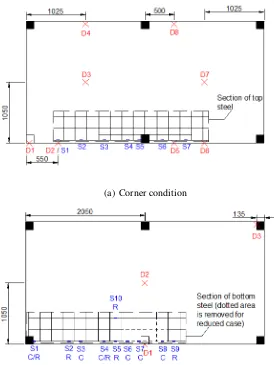
(a) Corner and penultimate removal conditions
(b) Middle removal condition
[image:8.612.163.447.132.281.2](c) Support details
(a) Fully supported (b) Unstable condition (c) Support being removed
Figure 2: Diagram showing the process of removing the temporary support for dynamic tests
Table 1: Test details and IDs
Slab ID Removal Position Reinforcement Test Type Cube Strength (MPa)
C-S Corner Static 24.4
C-D Corner Dynamic 26.7
PC-S Penultimate Continuous Static 33.9
PC-D Penultimate Continuous Dynamic 37.1
PR-S Penultimate Reduced Static 33.8
PR-D Penultimate Reduced Dynamic 35.2
[image:9.612.111.513.456.639.2]Figure 3: a) Photograph of slab PC-D before dynamic testing; b) Cameras for visual monitoring
50N per load cell, leading to total uncertainties of 0.25, 0.30, 0.45 and 0.5kN for
170
configurations using 5, 6, 9 and 10 load cells respectively. Measuring support
171
reactions before column removal allowed the slab to be balanced correctly. Once
172
a column had been removed, the changes in reactions at the remaining supports
173
allowed the redistribution of forces to be determined. Measurements taken during
174
the tests showed changes in demand to each support as the specimen experienced
175
damage.
176
An array of Linear Variable Displacement Transducers (LVDTs), sampled at
177
250Hz, were placed under each specimen to measure vertical deflections. Around
178
the column loss location, Digital Image Correlation (DIC) techniques were also
179
used to monitor deformations. Camera footage combined with video gauge
soft-180
ware [36] measured the static deflections at points across the sample. The
[image:10.612.159.450.123.347.2]tions of the presented measurement points for tests C, PC and PR are given in
182
Figure 4. For the dynamic tests, a Phantom v12.1 high speed camera was utilised
183
to capture the behaviour in the short time period during and after the column
184
removal (see Figure 3(b)). Images were recorded at 2500fps with an exposure
185
of 300µs and then processed by the video gauge software to obtain deflection
186
readings and to estimate the column removal time. Based on the size of the
vi-187
sual targets, distance of the camera and processing software used, an accuracy of
188
±0.1mm was achieved. The high speed footage was also used to identify crack
189
propagation patterns. Throughout each test, strain gauges were used to determine
190
the stress distributions with the aim of providing information on the critical areas
191
and potential for failure. The locations of the strain gauges on the reinforcing steel
192
that gave usable data are also shown in Figure 4.
193
4. Experimental Results
194
For the dynamic removal tests, the high speed footage was analysed to
esti-195
mate the time taken for the support to be removed. This was based on the period
196
between the rope attached to the support becoming taught with the bar starting to
197
move and the moment that either the bar was clearly disengaged with the support
198
plate, or the plate was no longer in contact with the slab. This method is likely to
199
overestimate the removal time, as it does not take account of the condition where
200
the support plate and slab remain in contact, moving vertically at the same rate
201
whilst not transferring forces. A summary of removal times for each test is given
202
in Table 2.
(a) Corner condition
[image:12.612.160.434.179.544.2](b) Penultimate removal conditions - Continuous (C) and Reduced (R)
Table 2: Estimated column removal times for each test
Slab ID Loading Level (kN/m2) Estimated time (ms)
C-D
3.0 53.2
6.8 57.0
7.7 50
PC-D 2.5 40
5.6 50
PR-D 2.3 52.5
5.7 39
M-D
3.1 33.7
6.7 49.2
8.5 42.6
Average 46.7
(a) Vertical reaction to each support (b) Percent of total load to each support
Figure 6: Mean change in distribution of forces to each support after corner column loss - Tests
C-S and C-D
4.1. Corner position
204
4.1.1. Static loading test
205
Figure 5(a) shows the vertical reactions at the supports during the corner static
206
test (C-S) (see Table 1). As it was expected, the reaction forces increased linearly
207
by increasing the total load in the elastic range. However, beyond 46.2kN total
208
load (5.4kN/m2) there was a change in distribution (label 1) until approximately
209
55kN (6.4kN/m2), coinciding with the formation of cracking across the element.
210
Past this phase (label 2) there is a linear increase of reactions again, though with
211
a larger deviation from the trend line. The relative distribution of forces to each
212
support given in Figure 5(b), suggests that the relative demand stayed constant in
213
the elastic and final ranges. Between labels 1 and 2 there was again a noticeable
214
change as redistribution of forces occurred due to extensive crack formation.
Con-215
sidering, however, the entire range, suggests that a linear model could be used to
216
describe the relationship.
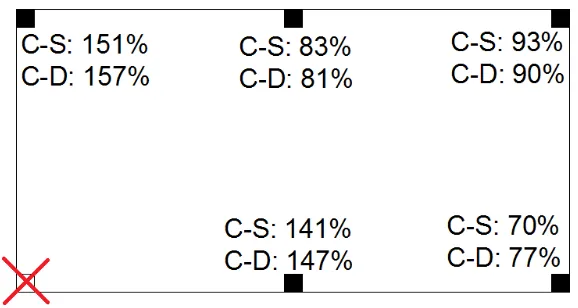
Comparison between the averaged reaction forces for fully supported and
218
damaged conditions (see Figure 6) indicates that the two orthogonally adjacent
219
supports experienced a 41-57% increase in their vertical reaction while all other
220
supports had a decrease in demand. It should be noted that C-S and C-D showed
221
similar ratios, indicating dynamic removal did not change the final distribution of
222
reaction forces.
223
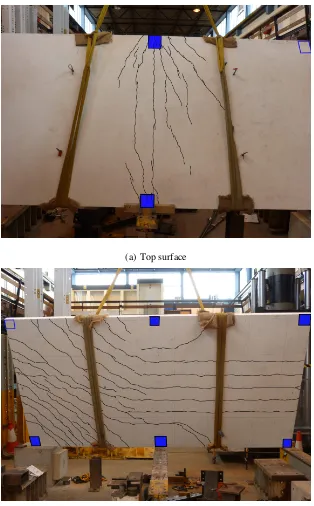
At higher levels of loading, significant flexural cracks formed due to the large
224
increase in hogging moments in both tests, initially on the top surface over the
ad-225
jacent support (Figure 7(a)). Sagging flexural cracks also formed on the underside
226
as the slab now spanned diagonally between the two supports nearest the removal
227
location (Figure 7(b)). The location of permanent supports (solid boxes) and the
228
removed support (outline) are annotated in this figure.
229
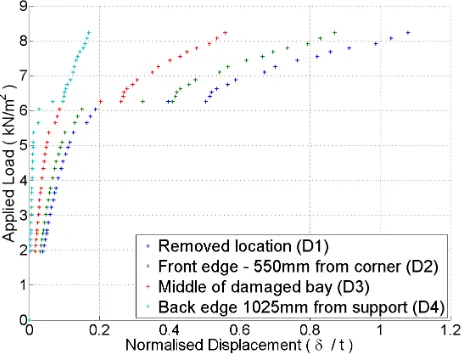
The plot of normalised displacements, deflection (δ)/slab thickness (t), against
230
load in the damaged bay area (Figure 8(a)) shows an initial linear response.
How-231
ever, after a load of 4.6kN/m2flexural cracks start to form resulting in a decrease in
232
stiffness to around 57% of the initial value. At 6.0kN/m2, when the peak
displace-233
ment equals 0.19 times the slab depth, there is a discontinuity due to significant
234
cracking over the adjacent support along with yielding of the reinforcement. This
235
led to an increase in displacements across the entire sample, with the maximum
236
exceeding half the slab depth. After this, there was a brief stiffening phase
be-237
fore a final softening with a relative stiffness of 6% of the elastic range. The slab
238
continued to carry additional load until the test was aborted at 8.2kN/m2. In the
239
adjacent bay, shown in Figure 8(b), once damage occurred there was a jump in
re-240
sponse observed in the middle (point D7, Figure 4(a)) due to the flexural sagging
241
cracks in that area. The high deflections in the damaged area also led to a relative
(a) Top surface
[image:16.612.149.463.121.627.2](b) Bottom surface
(a) Displacements in the damaged bay
[image:17.612.190.421.172.349.2](b) Displacements in the adjacent bay
uplift due to the large rotation around the central support (point D5). The
discon-243
tinuous response corresponds to the changes in reaction forces seen in Figure 5,
244
as discussed in the previously.
245
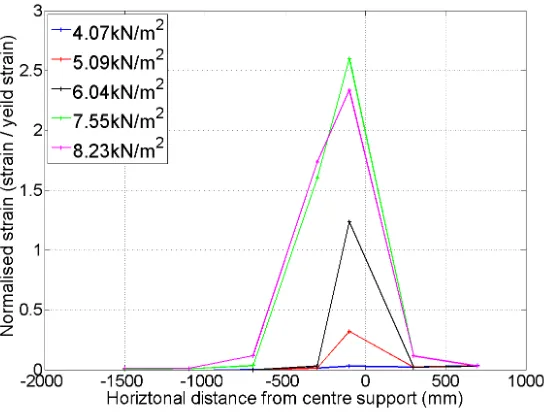
The strain data in Figure 9 provides a further understanding of the damage
246
profile. Strain readings have been corrected against the fully loaded condition
247
under the slab’s own self weight, i.e. the results demonstrate the change from
248
the starting condition, and then normalised against the yield strain. Below a load
249
of 4.1kN/m2, strains on the steel over the central column were relatively low.
250
However, after the formation of flexural cracking there was a peak in strain on the
251
damaged side of the support at 6.04kN/m2, corresponding to the large increase in
252
displacements seen in Figure 8(a). As loading increased there was local yielding
253
of the reinforcement in this area, while other areas remain well below the yield
254
strain.
255
4.1.2. Dynamic removal test
256
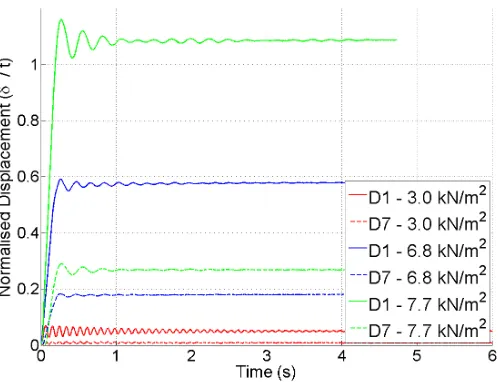
The normalised displacements (displacement/slab thickness) for dynamic
re-257
moval at three different levels of loading are plotted in Figure 10 for the removal
258
location and the middle of the adjacent bay (Points D1 and D7 in Figure 4(a)).
259
Peak displacements, damped natural frequency and damping ratio results for these
260
tests are compared in Table 3.
261
At 3.0kN/m2 the structure was within the elastic range resulting in small
de-262
flections (7% and 5% of slab depth for peak and final displacements respectively).
263
The low total mass resulted in a high frequency response, and as no damage
oc-264
curred there was little dissipation of the energy. The low damping ratio (ζ= 0.01)
265
caused the system to take several seconds to return to its static equilibrium
posi-266
tion.
Figure 9: Normalised strain against position for top reinforcement bars - Test C-S
The specimen was then reset to the starting position and the static load
in-268
creased to 6.8kN/m2, just within the plastic region from the earlier static
condi-269
tion. Much higher deflections, peaking at almost 60% of the slab depth, were
270
measured. Thin hogging cracks were observed, which resulted in a higher energy
271
dissipation and a larger damping ratio (ζ = 0.24), however overall damage was
272
not extensive.
273
For the final case the load was increased to 7.7kN/m2 and the test repeated.
274
Figure 11 shows the power density spectrum from a Fourier transform of
dis-275
placement readings following a corner column loss at different load levels. The
276
results indicate that for the slab in the plastic region (i.e. 7.7kN/m2), the large
de-277
flections and resulting damage created a different response to the single dominant
278
frequency peaks seen before. As cracks had already formed during the 6.8kN/m2
Figure 10: Normalised displacement against time after column removal at different positions and
loading - Test C-D
test and subsequently widened in the next case, the friction at the crack face was
280
reduced resulting in the smaller damping ratio observed at 7.7kN/m2 (Table 3).
281
Additionally, the pre-existing damage may have been a factor for the two
fre-282
quency response seen. At this loading, peak deflections exceeded 110% of the
283
slab depth but did not lead to complete failure.
284
Within the elastic range, the amplitude between the first peak and first dip is
285
60.7% of the maximum displacement, indicating the structure returns relatively
286
close to its initial state. Once permanent damage had occurred both these ratios
287
drop considerably as seen in Table 3.
288
The strain data collected during a dynamic removal also allowed estimation
289
of the strain rates, ˙ε(t). The tensile strain rates against time for the top steel are
290
presented in Figure 12 for the three loading levels. Each line shows the maximum
Figure 11: Power spectral density of displacement following corner column loss at different load
levels - Test C-D
Table 3: Results from dynamic removal - Test C-D
Loading (kN/m2) 3.0 6.8 7.7
Normalised Peak 0.07 0.59 1.16
Amplitude/Peak (%) 60.7 7.36 11.91
Peak/Final Displacement 1.42 1.02 1.07
Damped Natural Frequency (Hz) 11.0 5.41 3.54/4.21
[image:21.612.153.452.495.635.2]strain rate that occurred at any monitored position, at each time step.
292
Strain gauge S5, positioned next to the central support, see Figure 4(a),
ex-293
perienced a much higher strain rate for each loading level. Since the graph only
294
presents the maximum value, the response of the other gauges is hidden.
There-295
fore, a second line is plotted excluding this sensor. Additionally, the key strain
296
data with time, adjusted against the strain readings at the fully support condition,
297
is also plotted on the second vertical axis to allow further comparisons.
298
In Figure 12(a), the elastic case, most the sensors on the top steel show very
299
low levels of strain rates, with only sensor S5 showing a strong peak. However, it
300
is clear that the peak strain occurs a period of time after the peak strain rate. This
301
is significant in considering the influence of strain rate effects in increasing the
302
material tensile capacity during sudden column losses. At 6.8kN/m2 of loading,
303
shown in Figure 12(b), a similar pattern is seen, however there is still a reasonable
304
peak at other locations. Overall, high strain rates are observed here with a
max-305
imum rate of 0.153s−1 occurring just before the maximum strain. The change in
306
maximum strain from the fully supported case suggests that the steel has yielded
307
in this area; this may explain the localised high strain rate and also affect the final
308
results.
309
The final loading case presented in Figure 12(c) shows a different response.
310
The largest strain rate does again comes from sensor S5 (next to the central
sup-311
port), the rates and change in strains are smaller than the previous case. This is
312
most likely due to the plastic deformations that occurred. Of further interest is
313
sensor S3, see Figure 4(a) for its location. As this position was previously closer
314
to the middle of the span, it was under a compressive condition and then changed
315
to a tensile state due to the column loss. This change demonstrated itself by a
Table 4: Details of shear failures
Slab ID Max
loading
(kN/m2)
Max
dis-placement
(δ/t)
Shear
failure
Loading
type at
failure
Initial location Further failure
C-S 8.2 1.08 No
C-D >7.7 1.54 Yes Static push
downa
Back left corner Bottom middle
PC-S 6.4 2.23 No
PC-D 6.8 1.71 Yes Staticb Front left corner
PR-S 6.7 1.67 Yes Static Front left corner Front right corner
PR-D 5.7 2.12 Yes Dynamic Front right corner Front left corner
M-D 9.2 0.74 No
aAfter the final dynamic test a large load was applied over the removed corner to
cause complete failure.
bAfter the final dynamic test, loading changed to a static UDL.
delay in response before the large tensile deformations occurred leading to large
317
permanent strains. The peak rates were 0.031 and 0.034s−1.
318
Finally the sample was loaded to failure, which occurred due to punching shear
319
at the two adjacent supports as shown in Figure 13. Table 4 gives the shear failure
320
details of all the slabs tested.
(a) 3.0 kN/m2loading
(b) 6.8 kN/m2loading
[image:24.612.137.474.131.720.2]Figure 13: Final state of corner removal case after shear failure - Test C-D
(a) Vertical reaction to each support - Tests PC-S
and PR-S
(b) Percent of total load to each support - Test
PR-S
[image:25.612.130.483.447.572.2]4.2. Penultimate position
322
4.2.1. Static loading test
323
The load increase to each support for two Penultimate removal cases with
324
static loading are shown in Figure 14(a). Similar responses are observed for the
325
two conditions with nearly all points showing a simple linear relationship at low
326
loading at equivalent rates. The back middle support takes the highest proportion
327
of loading, followed by the front corners.
328
Flexural cracking occurred at 35kN and 30kN of total load, for PC-S and PR-S
329
respectively, which was followed by a period of redistribution of reaction forces
330
across the samples until approximately 45kN, between labels (1) and (2). After
331
this stage the distribution remains reasonably constant until failure.
332
The change in support reaction distribution occurred principally due to uplift at
333
the back two corners, as a result of the large downward deflection in the middle.
334
What little load those supports had been carrying was then taken by the other
335
supports (Figure 14(b)), primarily the back middle.
336
The bottom left location in PC-S shows a more dramatic change. This was due
337
to the load cell rotating at higher deflections, an issue that was corrected for in
338
other tests by stabilising the load cell horizontally, and does not indicate a change
339
in loading on the support.
340
Deflections of PC-S and PR-S are given in Figure 15 for the positions
identi-341
fied in Figure 4(b). It is shown that there is a clear linear response across all parts
342
of the slab before cracking occurs. Additionally, the initial stiffness of the two
re-343
inforcement cases was identical. Both cases started to crack at similar points, with
344
a slight reduction in stiffness observed after 3.4kN/m2. This corresponds to a peak
345
normalised displacements of 0.1. However, after peak displacement of 0.13 times
Figure 15: Load against normalised displacement for PC-S and PR-S
the depth there is a significant reduction in stiffness due to more extensive flexural
347
cracking. After this point there was a linear trend for the remaining data, though
348
the new stiffnesses were less than 5% of the initial values. In the corner removal
349
case there was a large increase in displacements as cracking formed, which does
350
not occur here. The geometry of these tests meant that sagging cracks were the
351
most significant form of damage and these were spread out across the midspans
352
and so did not cause the sudden drop in stiffness observed from the very localised
353
hogging cracks in the previous test. The results also demonstrate the uplift
ef-354
fect experienced at the back support (point D3 in Figure 4(b)), as shown by the
355
negative displacement.
356
The reduced case experienced a sudden shear crack of the front left support
357
at 6.7kN/m2 with an approximate shear force of 15.1kN. The corner sections had
358
(a) Continuous reinforcement - Test PC-S (b) Reduced reinforcement - Test PR-S
Figure 16: Normalised strain against position for bottom reinforcement bars
failure occurred, the second front corner support also failed by shear (see Table
360
4). Test PC-S was ended due to safety concerns at a lower loading than the level
361
that caused shear failure in PR-S, although the design shear capacity had already
362
been exceed. Had the test been continued it is likely that a similar failure would
363
occur. The rotation of the load cells, and therefore support conditions, for the
364
continuous reinforcement test also resulted in the higher deflected profile without
365
causing shear failure.
366
Figure 16 shows the strain profiles of the bottom reinforcement bars for tests
367
PC-S and PR-S. The location of the strain gauges are shown in Figure 4(b)). For
368
the continuous reinforcement case (Figure 16(a)), the middle area (±500mmfrom
369
the removed column) had the highest strain for loading less than 4.5kN/m2.
How-370
ever, once cracking started there was a significant change in the stress distribution
371
and yielding occurred across much of the length of the monitored bar. The drops
372
in values can be explained by local variation in stress due to the effect of concrete
373
de-bonding around the steel. Removing the central bottom flexural steel from the
Figure 17: Failure of slab PR-D captured from high speed camera - a) Flexural cracking; b) Shear
crack
column location (±400mmfrom the centre) resulted in a different response (see
375
Figure 16(b)). Note that for loading greater than 4.5kN/m2 the strain gauge at
376
500mm (gauge S9R) failed and its values have been removed. Due to the
non-377
continuous state of the reinforcement, smaller strain was observed at equivalent
378
loading and positions compared to PC-S, and none of the steel bars yielded.
How-379
ever, an extra gauge (S10R)at -500mm horizontal distance and 450mm away from
380
the edge, is included (marked with o’s). This sensor was on the first bar that is
381
continuous along the length and did yield. Strain gauges on the top surface of the
382
concrete, along with visual inspections, revealed that the concrete never
under-383
went crushing.
Figure 18: Displacement against time for PR-D at 5.7kN/m2
4.2.2. Dynamic removal test
385
The failure of the reduced reinforcement condition under dynamic removal
386
with 5.7kN/m2of loading is shown in Figure 17, captured by the high speed
cam-387
era. A wide flexural crack initially occurred due to the lack of tensile
reinforce-388
ment, before a final shear crack formed leading to complete shear failure, see
389
Figure 17(a) and (b) respectively.
390
The normalised deflections against slab thickness for this test are plotted in
391
Figure 18, along with the static case at equivalent loading to demonstrate the
in-392
crease in deflections experienced due to the dynamic effects. In the dynamic case
393
there was a peak displacement of 2.12 times the slab depth, before the shear crack
394
formed at 0.47 seconds. Comparing the results to the static test gives a dynamic
395
displacement amplification ratio of 2.14. However, due to the nonlinear
ship this value is not useful. Extrapolating beyond values from the static force
397
displacement line (Figure 15) gives an equivalent force DAF of only 1.35, based
398
on the assumption that shear failure does not occur. The reduction in stiffness
399
caused by the initial flexural damage might have caused the much higher
deflec-400
tions observed. Furthermore, the maximum vertical reaction at adjacent supports
401
occurred as the slab reaches a temporary static condition at its maximum
deflec-402
tion, this delayed the shear crack forming and allowed higher deflections to be
403
reached. For further comparisons, details of shear failures are given in Table 4.
404
Considering the strain rate data for the two tests, shown in Figures 19 and 20,
405
demonstrates that moderately high strain rates occurred after the sudden column
406
loss at the higher loadings, in the order of 0.2-0.3s−1. However, as was seen in the
407
corner loss case, the peak strain, and therefore highest stress, in the material occurs
408
after the maximum strain rate. Additionally, at this point, the rate was close to its
409
minimum as the sample was at a temporary rest position between oscillations.
410
Test PC-D in Figure 19 shows that the strain rates in the elastic test are relatively
411
small, around 0.02s−1. Furthermore, most of the monitored points also had small
412
strain rates even at the higher loading. However, strain gauge S3, see Figure 4(b),
413
did show much higher values. This is to be expected from comparing to the static
414
case in Figure 16(a) as that location clearly undergoes yielding. Of further interest
415
is strain gauge S7, which was positioned at the support that was removed. This
416
location quickly switched from a compressive, hogging state, to a sagging, tensile
417
condition, which explains its high strain rate immediately after removal. However,
418
this area became less critical due to further damage occurring across the slab.
419
Figure 20, showing strain rate data from test PR-D, gives a comparison
be-420
tween maximum strain rates and maximum strain. Additionally, the vertical line
Figure 19: Maximum steel strain rates against time. Also showing changes in strain against time.
- Test PC-D
indicates the time at which the shear crack formed. Considering strain positions
422
S3 and S7, it can be seen that the sample had reached its maximum defection and
423
strain and was about to continue its oscillation when the slab failed due to shear.
424
At this time the strain rates were very low at all points across the slab.
425
The flexural cracks on the underside of the test specimens are shown in
Fig-426
ure 21, Permanent supports (solid boxes) and the removed support (outline) are
427
shown. In both cases there were primary cracks spreading perpendicular to the
428
new support arrangement. The position of the bottom reinforcement mesh is also
429
indicated to show that the orthogonal cracks in the middle area follow the steel
po-430
sitions. This is especially pronounced in PC-D, where the diagonal cracks reach
431
right to the centre line. Whereas for the reduced case (PR-D) it is shown in Figure
432
21(b) that the cracks were non-continuous at the column loss location and
Figure 20: Maximum strain rates against time at 5.7kN/m2. Also showing changes in strain against
time - Test PR-D
agated around the edge of column area, following the reinforcement lines, rather
434
than exploiting the lack of tensile reinforcement in the central area (c.f. Figure
435
21(a)). However, these cracks were wider and deeper than at other locations and
436
in other tests. For all penultimate removal tests, there was only minimal hogging
437
cracking on the top side running down the centre line, which was followed by
438
shear failures on one or both of the front corner supports (see Table 4).
439
4.3. Middle position
440
Test M-D was a 4x1 bay continuous slab with a middle column dynamically
441
removed. The change in support reactions from fully supported to the damaged
442
case are shown in Figure 22. Similar to the previous tests, the largest increase
443
in reaction occurred at the supports immediately adjacent to the removal point,
(a) Continuous reinforcement - Test PC-D
[image:34.612.149.462.122.628.2](b) Reduced reinforcement - Test PR-D
Figure 22: Mean change in distribution of forces to each support after corner column loss - Test
M-D
force.
446
Dynamic removal tests were conducted at different loadings and normalised
447
deflections were calculated using images captured from the high speed camera.
448
Figure 23 compares displacement at the removal location in test M-D for different
449
load levels. Although this arrangement in general shows the same behaviour as
450
the previous tests, there was a significant reduction in the normalised
displace-451
ments. Comparing the key results given in Table 5 with the equivalent loading for
452
the corner removal case (Table 3), gives a reduction of 55% for the peak
displace-453
ment in elastic cases. Additionally, at the next loading level (6.8/6.9kN/m2), the
454
continuous slab peak displacement was only 0.09 times the slab depth, compared
455
to 0.59 in test C-D. As this set up caused a stiffer structure compared to the corner
456
removal tests, displacements are expected to be smaller. Furthermore this also
Figure 23: Displacements against time at the removal location for different loadings - Test M-D
meant that the damage, and therefore reduction in stiffness, occurred at a higher
458
level of loading for this case.
459
At lower levels of load, the bays adjacent to the damaged area experienced
460
a slight uplift, as shown by the negative displacements in Figure 24, due to the
461
slab rotating inwards towards the removed support. Initially, after the column
462
was removed in the 8.5kN/m2 test, there was a brief uplift (label (A) in Figure
463
24), however, the damage sustained across the slab resulted in a final downward
464
motion.
465
Cracking of both the top and bottom surfaces of the concrete led to large plastic
466
deformations and the drift observed in Figures 23 and 24. However, collapse due
467
to total flexural failure did not seem likely and shear cracks did not form within
468
the levels of loads tested (see Table 4).
Figure 24: Displacements against time at the center of the adjacent bay for different loadings Test
M-D
Based on experimental results, Table 5 gives the values of dynamic effects for
470
three loading levels. In the elastic range (i.e. 3.1kN/m2) there was a higher natural
471
frequency and a smaller damping ratio. For this the influence of inertial effects
472
on a lightly loaded slab can be seen, resulting in a high peak to final displacement
473
ratio of 1.54. Again increasing the load decreased the frequency of oscillation
474
and increased the damping ratio. For the higher load cases there was an initial
475
dynamic behaviour then, as the major dynamic motion was damped out, the slab
476
underwent further downward deflections under its own self-weight. These
dis-477
placements became larger than the initial dynamic peak and resulted in further
478
deflections as the slab returned to a static condition. This caused the peak to
fi-479
nal displacement ratios of less than 1 presented in Table 5. This behaviour was
480
a result of the damage, and therefore reduction in stiffness, sustained during the
Table 5: Results from dynamic removal - Test M-D
Loading (kN/m2) 3.1 6.9 8.5
Normalised Peak 0.05 0.09 0.24
Amplitude/Peak (%) 67.31 15.98 5.82
Peak/Final Displacement 1.54 <0.92 <0.90
Damped Natural Frequency (Hz) 13.4 8.55 6.00
Damping Ratio 0.017 0.219 0.204
dynamic response. However, after the period of recording the slab came to rest
482
and complete failure did not occur.
483
Figure 25 shows a photograph of the underside of slab M-D after the test was
484
completed with the cracks annotated. The primary cracking pattern is shown in
485
black. In this specimen the two-way spanning nature of a slab structure after a
486
column loss is clear by the diagonal cracks. The red lines are secondary flexural
487
cracks that follow the reinforcement lines. As the slab was not continuous in both
488
directions these cracks were more extensive than would be expected in a typical
489
structure. The top cracking due to the increased hogging moments over the
adja-490
cent supports was almost identical to the corner removal case shown previously
491
in Figure 7. These cracks followed the same pattern as seen in Figure 21, though
492
were less extensive due to the smaller deflections and the influence of adjacent
493
bays.
Figure 25: Annotated underside cracking pattern for continuous slab Test M-D
5. Discussion
495
These tests sought to simulate the effect of a column loss on a flat slab system.
496
The measured reactions forces indicate that each slab was balanced suitably at the
497
start of each test and that the loading was applied evenly across its surface.
Anal-498
ysis of the high speed footage shows that the support was typically completely
499
removed within 50ms. Although this is slower than a true instantaneous column
500
loss scenario caused by an explosion [3, 37], similar removal rates were achieved
501
for all tests allowing comparisons to be made. Furthermore the results still
demon-502
strate the effects of a quick removal. A quicker removal scenario may increase the
503
dynamic effects slightly and will be considered in later numerical analysis.
504
5.1. Force redistribution
505
The reaction force distribution and the cracking patterns shown in Figures 6, 7,
506
14, 21, 22 and 25 give a good indication of the change in load paths that a damaged
truly two-dimensional, with new spans primarily acting diagonally between the
509
nearest supports. The change in spanning arrangement means that the supports
510
closest to the removal location take up the loads that were previously taken from
511
the lost support and a higher proportion of the load on the alternate bay, as shown
512
by the decrease in forces at the further locations in Figures 6 and 22. This increase,
513
potentially more than 50%, might therefore exceed the shear capacity of the slab
514
and lead to a catastrophic failure. Furthermore, simple techniques for analysing
515
moment distributions for flat slabs, such as the equivalent frame method, can not
516
be applied after a column loss.
517
Increased loading, leading to further damage, does change the distribution of
518
forces slightly due to large rotations, changes in effective span lengths and a local
519
reduction in stiffness after cracking. However, with continuous slabs and restraint
520
provided by columns, these effects will be less significant and so static conditions
521
with small loading may provide suitable information to predict the final demand
522
on the supports.
523
5.2. Whole slab behaviour
524
The damage profiles, and results from the two penultimate cases, suggest that
525
the inclusion of continuous reinforcement through a column location does change
526
the distribution of stresses around the removed location. However, there is not
527
a significant difference in ultimate capacity. This is due to the change in load
528
paths away from the removed column. The static tests show that even after
crack-529
ing has occurred in the concrete and the reinforcement has yielded, the structure
530
can maintain its integrity and show a ductile behaviour. This is partly due to the
531
strain hardening in the steel reinforcement along with geometric nonlinearity as
532
the slab forms a tensile membrane at higher deflections, typically when the peak
displacement exceeds half the slab depth. However, the tests emphasised that
534
brittle mechanisms need to be avoided. A particular weakness of flat slab
sys-535
tems appears to be shear failure at corner supports. The additional demand placed
536
on these locations when a neighbouring column is lost, combined with their small
537
shear perimeter, makes them susceptible to progressive failures. Increasing
punch-538
ing shear capacity and ensuring surrounding supports have sufficient ductility can
539
therefore prevent progressive collapse.
540
Furthermore, although it seems that continuous bottom reinforcement through
541
a column may not be significant for flexural capacity, previous research has
demon-542
strated its efficiency in increasing the post-punching shear capacity of the
sur-543
rounding supports [23]. Therefore, its inclusion will aid in preventing progressive
544
shear failures.
545
For a flat slab structure, the global response of the surrounding elements plays
546
a key role as loads are redistributed due to the damage in the slab elements. In
547
these test the adjacent bays acted to counterbalance the damaged area leading
548
to lower deflections. Additionally, the continuous slab condition in tests C-S,
549
C-D and M-D allowed the formation of plastic hinges, which dissipated energy
550
from the system. However, in some cases plastic deformations continued after
551
the test, as shown by peak to final displacement ratios less than 1, which could
552
potentially lead to a later collapse. As the aim of these tests was to investigate the
553
general behaviour of slab elements to validate more detailed numerical modelling,
554
the inclusion of simple supports and non-fixed edges is not considered to be an
555
issue. However, further testing on realistic structural arrangements, including the
556
restraint provided by columns, is required.
5.3. Dynamic effects
558
The dynamic effects involved in suddenly removing a support can play a
sig-559
nificant role in the structural performance of flat slab structures. At low levels
560
of loading, within the elastic limits, there is typically a strong peak in deflections
561
followed by high frequency oscillations until the slab returns to rest after 3 or
562
4 seconds. At larger levels of loading, the additional mass increases the inertial
563
effect leading to a higher peak and more damage than from a static equivalent.
564
However, the damage also dissipates energy from the system via crack
forma-565
tions and plastic deformations of the steel, resulting in a lower frequency response
566
which is damped out within a second or two. Furthermore, after a sudden removal,
567
forces are not redistributed to surrounding supports instantaneously, with the peak
568
demand occurring as the structure comes to a temporary rest position between
os-569
cillations. Therefore, flexural damage may occur before a potential shear failure
570
and create a different response to the static loading case.
571
Typically in design cases, a factor of 2.0 is applied to the loading in the bays
572
around the removed column during a static analysis to account for dynamic
ef-573
fects. This is based on the behaviour of a linear elastic system with no damping
574
and instantaneous removal and theoretically represents the worst case scenario.
575
However, as all real structures experience some level of damping, it is clear this
576
amplification factor does not reflect a realistic condition. Furthermore, after
crack-577
ing occurs in the slab there is a reduction in its stiffness creating a nonlinear
re-578
sponse. Therefore, at common levels of loading, there is not a direct relationship
579
between the load applied and the level of displacement or damage. This is
sig-580
nificant because all observed force factors were considerably less than 2, though
581
further investigations are required to quantify this for typical structures.
The rate of the straining of the steel reinforcement from all the tests indicates
583
that the maximum strain rate is less than 0.35s−1. However, this only occurs at very
584
localised points, which were undergoing significant plastic deformations already,
585
generally the strain rates in the steel were much less than this. High strain rates
586
change the material properties, most significantly increasing the tensile capacity
587
of concrete. To account for this the current Model Code [38], recommends a two
588
phase model, with a higher sensitivity after 10s−1, for calculating the Dynamic
589
Increase Factor (DIF) for concrete due to fast loading.
590
Using the measured strain rates, the peak DIF the Model Code is 1.26,
how-591
ever, the results demonstrate that at the time of high strains, and therefore stresses,
592
the strain rate is fairly low. This is similar to the results from Yu et al. [39] in their
593
experimental investigation of RC beams under a sudden column loss. They
mea-594
sured strain rates of between 10−2 to 10−1/s, and concluded that this only gives a
595
small increase in material strength and can be conservatively ignored. This
sug-596
gests that the DIF for concrete may not be critical in providing additional flexural
597
capacity.
598
6. Conclusions
599
From the above results and discussion, the follow key conclusions can be
600
drawn.
601
• The sudden column loss idealisation can be reproduced on an
experimen-602
tal substructure of a flat slab floor. The use of a high speed camera with
603
image tracking can monitor deflections for the areas of interest during a
dy-604
namic removal condition and capture the formation of cracking. Although
a suitable substructure can provide useful information into the key
perfor-607
mance parameters.
608
• The ability of flat slab structures to efficiently span in two directions
pro-609
vides effective alternative load paths after a single column loss. Flexural
610
cracking was observed, both in the sagging areas and hogging over adjacent
611
columns, however, this did not lead to ultimate failure. All observed failures
612
were due to punching shear, usually at corner locations. Progressive shear
613
failures also occurred.
614
• A reduction in the stiffness of the flat slabs was observed at peak deflections
615
between 0.1 and 0.15 times the slab depth. However, beyond their elastic
616
limit, slab elements can still have significant additional capacity due to
ma-617
terial and geometric nonlinearities. As they enter the nonlinear range, there
618
is also a change in the response of the system. Force distributions change
619
and the damage alters the dynamic response of the system. Therefore, to
620
assess the true potential for a progressive failure these effects must be
con-621
sidered.
622
• The column loss event is inherently dynamic and the level of loading changes
623
the response of the system. This is due to two effects; the increase in mass
624
changes the natural frequency of the system and higher loading results in
625
damage to the structure. When damage occurs the dissipation of energy
626
affects the peak displacement and level of damping, as well as reducing
627
the stiffness, and therefore natural frequency. Additionally, a maximum
628
increase in displacements of 50% more than the static case was observed
629
during elastic tests due to inertial effects. This may therefore cause
age to a structure near its limit, however this effect is less pronounced as
631
the structure experiences permanent damage. Common design
recommen-632
dations of a load increase of 2.0 appear to be conservative, especially
con-633
sidering the nonlinear relationship between force and displacements after
634
cracking. Furthermore, although high strain rates are known to increase the
635
material strength, the extent of straining and the time profile mean these
636
effects are less significant in assessing the progressive collapse potential.
637
Acknowledgements
638
The authors would like to acknowledge the Early Career Research and
Knowl-639
edge Transfer grant awarded by the University of Nottingham to Dr. Hajirasouliha
640
that funded the project.
641
References
642
[1] C. Pearson, N. Delatte, Ronan point apartment tower collapse and its
ef-643
fect on building codes, Journal of Performance of Constructed Facilities 19
644
(2005) 172–177.
645
[2] J. D. Osteraas, Murrah building bombing revisited: A qualitative
assess-646
ment of blast damage and collapse patterns, Journal of Performance of
Con-647
structed Facilities 20 (2006) 330–335.
648
[3] M. Byfield, S. Paramasivam, Murrah Building Collapse: Reassessment of
649
the Transfer Girder, Journal of Performance of Constructed Facilities 26
650
(2012) 371–376.
[4] J. G. M. Wood, Pipers Row car park collapse: Identifying risk, Concrete
652
(London) 37 (2003) 3.
653
[5] T. W. Park, Inspection of collapse cause of Sampoong Department Store,
654
Forensic Science International 217 (2012) 119–126.
655
[6] EN 1990, BS EN 1990: Eurocode 0 - Basis of structural design, 2002.
656
[7] W. J. Yi, Q. F. He, Y. Xiao, S. K. Kunnath, Experimental study on
progres-657
sive collapse-resistant behavior of reinforced concrete frame structures, ACI
658
Structural Journal 105 (2008) 433–439.
659
[8] S. L. Yap, B. Li, Experimental Investigation of Reinforced Concrete Exterior
660
Beam-Column Subassemblages for Progressive Collapse, ACI Structural
661
Journal 108 (2011) 542–552.
662
[9] K. Qian, B. Li, Experimental Study of Drop-Panel Effects on Response of
663
Reinforced Concrete Flat Slabs after Loss of Corner Column, ACI Structural
664
Journal 110 (2013) 319–329.
665
[10] M. Sasani, M. Bazan, S. Sagiroglu, Experimental and analytical progressive
666
collapse evaluation of actual reinforced concrete structure, ACI Structural
667
Journal 104 (2007) 731–739.
668
[11] M. Sasani, S. Sagiroglu, Progressive collapse resistance of Hotel San Diego,
669
Journal of Structural Engineering-ASCE 134 (2008) 478–488.
670
[12] M. Sasani, S. Sagiroglu, Gravity Load Redistribution and Progressive
Col-671
lapse Resistance of 20-Story Reinforced Concrete Structure following Loss
672
of Interior Column, ACI Structural Journal 107 (2010) 636–644.
[13] M. Sasani, A. Kazemi, S. Sagiroglu, S. Forest, Progressive Collapse
Resis-674
tance of an Actual 11-Story Structure Subjected to Severe Initial Damage,
675
Journal of Structural Engineering-ASCE 137 (2011) 893–902.
676
[14] K. Qian, B. Li, Slab Effects on Response of Reinforced Concrete
Substruc-677
tures after Loss of Corner Column, ACI Structural Journal 109 (2012) 845–
678
855.
679
[15] K. Qian, B. Li, Performance of Three-Dimensional Reinforced Concrete
680
Beam-Column Substructures under Loss of a Corner Column Scenario,
Jour-681
nal of Structural Engineering-ASCE 139 (2013) 584–594.
682
[16] Y. Zheng, D. Robinson, S. Taylor, D. Cleland, A. Shaat, Analysis of
com-683
pressive membrane action in concrete slabs, Bridge Engineering 161 (2008)
684
2131.
685
[17] B. Punton, M. P. Byfield, P. P. Smith, Load Redistribution using
Compres-686
sive Membrane Action in Reinforced Concrete Buildings, Performance,
Pro-687
tection and Strengthening of Structures under Extreme Loading 82 (2011)
688
272–277.
689
[18] P. X. Dat, T. K. Hai, Membrane actions of RC slabs in mitigating progressive
690
collapse of building structures, Engineering Structures 55 (2013) 107–115.
691
[19] L. Keyvani, M. Sasani, Y. Mirzaei, Compressive membrane action in
pro-692
gressive collapse resistance of RC flat plates, Engineering Structures 59
693
(2014) 554–564.
694
[20] Y. C. Loo, H. Guan, Cracking and punching shear failure analysis of RC flat
[21] R. L. Vollum, M. A. Eder, A. Y. Elghazouli, T. Abdel-Fattah, Modelling and
697
experimental assessment of punching shear in flat slabs with shearheads,
698
Engineering Structures 32 (2010) 3911–3924.
699
[22] J. W. Choi, J. H. J. Kim, Experimental Investigations on Moment
Redistri-700
bution and Punching Shear of Flat Plates, ACI Structural Journal 109 (2012)
701
329–337.
702
[23] Y. Mirzaei, M. Sasani, Progressive collapse resistance of flat slabs: modeling
703
post-punching behavior, Computers and Concrete 12 (2013) 351–375.
704
[24] N. M. Hawkins, D. Mitchell, Progressive Collapse of Flat-Plate Structures,
705
Journal of the American Concrete Institute 76 (1979) 775–808.
706
[25] D. Mitchell, W. D. Cook, Preventing Progressive Collapse of Slab
Struc-707
tures, Journal of Structural Engineering-ASCE 110 (1984) 1513–1532.
708
[26] O. Yagob, K. Galal, N. Naumoski, Progressive collapse of reinforced
con-709
crete structures, Structural Engineering and Mechanics 32 (2009) 771–786.
710
[27] W. Yi, F. Zhang, S. Kunnath, Progressive Collapse Performance of RC Flat
711
Plate Frame Structures, Journal of Structural Engineering 140 (2014).
712
[28] A. J. Pretlove, M. Ramsden, A. G. Atkins, Dynamic Effects in Progressive
713
Failure of Structures, International Journal of Impact Engineering 11 (1991)
714
539–546.
715
[29] H. S. Kim, J. Kim, D. W. An, Development of integrated system for
pro-716
gressive collapse analysis of building structures considering dynamic effects,
717
Advances in Engineering Software 40 (2009) 1–8.
[30] O. A. Mohamed, Progressive collapse of structures: Annotated bibliography
719
and comparison of codes and standards, Journal of Performance of
Con-720
structed Facilities 20 (2006) 418–425.
721
[31] L. Kwasniewski, Nonlinear dynamic simulations of progressive collapse for
722
a multistory building, Engineering Structures 32 (2010) 1223–1235.
723
[32] Q. Kai, B. Li, Dynamic performance of RC beam-column substructures
724
under the scenario of the loss of a corner column-Experimental results,
En-725
gineering Structures 42 (2012) 154–167.
726
[33] S. Pujol, J. P. Smith-Pardo, A new perspective on the effects of abrupt
col-727
umn removal, Engineering Structures 31 (2009) 869–874.
728
[34] M. H. Tsai, An analytical methodology for the dynamic amplification factor
729
in progressive collapse evaluation of building structures, Mechanics
Re-730
search Communications 37 (2010) 61–66.
731
[35] E. 1992, BS EN 1992: Eurocode 2 - Design of concrete structures - Part 1-1:
732
General rules and rules for buildings, 2004.
733
[36] 2014. URL:http://www.imetrum.com/.
734
[37] D. Cormie, G. Mays, P. D. Smith, Blast effects on buildings / edited by
735
David Cormie, GeoffMays and Peter Smith, Thomas Telford, 2009. Includes
736
bibliographical references and index.
737
[38] F´ed´eration Internationale du B´eton, Model code 2010 : final draft, Bulletin
738
/ Federation Internationale du Beton ; 65-66, International Federation for
Structural Concrete (fib), 2012. Prepared by fib Special Activity Group 5,
740
New Model Code.
741
[39] J. Yu, T. Rinder, A. Stolz, K. Tan, W. Riedel, Dynamic Progressive Collapse
742
of an RC Assemblage Induced by Contact Detonation, Journal of Structural
743
Engineering 140 (2014).