TMS SMART – Scalp Mapping of Annoyance Ratings and Twitches caused byTranscranial Magnetic Stimulation
Lotte Meteyard a Nicholas Holmes b
a
School of Psychology and Clinical Language Sciences, University of Reading, Whiteknights, RG6 6AL, United Kingdom. l.meteyard@reading.ac.uk
b
School of psychology, University Park, University of Nottingham, Nottingham, NG7 2RD, United Kingdo. Nicholas.Holmes@nottingham.ac.uk
The raw data are available at www.tms-smart.info and https://osf.io/f49vn/
Acknowledgements
We would like to thank Arran Reader, Nergis Yüksel and Ainara Jauregi for help with experiment preparation, data collection and literature searches. We would also like to thank Elisabeth Volke for help with data collation and preparation. We would like to thank previous reviewers of the manuscript for robust comments that have improved and extended our analyses. This project was funded by the Research Group Pump Priming scheme (Language & Cognition, Perception & Action) awarded to the authors from the University of Reading School of Psychology and Clinical Language Sciences.
Abstract
Background: The magnetic pulse generated during transcranial magnetic stimulation (TMS) also stimulates cutaneous nerves and muscle fibres, with the most commonly reported side effect being muscle twitches and sometimes painful sensations. These sensations affect behaviour during experimental tasks, presenting a potential confound for ‘online’ TMS studies.
New method: Our objective was to systematically map the degree of disturbance (ratings of annoyance, pain, and muscle twitches) caused by TMS at 43 locations across the scalp. Ten participants provided ratings whilst completing a choice reaction time task, and ten different participants provided ratings whilst completing a 'flanker' reaction time task.
Results: TMS over frontal and inferior regions resulted in the highest ratings of annoyance, pain, and muscle twitches caused by TMS. We predicted the difference in reaction times (RT) under TMS by scalp location and subjective ratings. Frontal and inferior scalp locations showed the greatest cost to RTs under TMS (i.e., slowing), with midline sites showing no or minimal slowing. Increases in subjective ratings of disturbance predicted longer RTs under TMS. Critically, ratings were a better predictor of the cost of TMS than scalp location or scalp-to-cortex distance. The more difficult ‘flanker’ task showed a greater effect of subjective disturbance.
Comparison with existing methods: We provide the data as an online resource (www.tms-smart.info) so that researchers can select control sites that account for the level of general interference in task performance caused by online single-pulse TMS.
Conclusions: The peripheral sensations and discomfort caused by TMS pulses significantly and systematically influence RTs during single-pulse, online TMS experiments.
1.0 Introduction
A transcranial magnetic stimulation (TMS) machine produces a rapidly-changing magnetic field which, when positioned on the scalp, can be used to temporarily disrupt function in a specific brain area (Sparing & Mottaghy, 2008; Wagner et al., 2007; Walsh & Cowey, 2000). This provides a non-invasive means to draw inferences about the contribution of specific brain regions to a given behavioural task. (Bolognini & Ro, 2010; Ruff et al., 2009).
TMS causes peripheral auditory and cutaneous sensations (Bestmann et al., 2005; Borckardt et al., 2006; Nikouline et al., 1999; Starck et al., 1996; Wasserman, 1998). Tension headaches and scalp discomfort are frequently reported side-effects of undergoing TMS (Anderson et al., 2006; Benninger et al., 2011; Maizey et al., 2013; O’Reardon, and et al., 2007; VonLoh et al., 2013).
Anecdotal evidence (i.e., researcher experience) suggests individual variation in the peripheral sensations elicited by TMS, and researchers often use small changes in coil placement and orientation to alleviate discomfort. In addition, participants habituate to stimulation over time. Principally, these peripheral sensations differ by scalp location. On average, TMS is more disturbing over prefrontal cortex than over parietal cortex (Abler et al., 2005). Crying has been reported as an adverse effect for participants in speech studies that stimulated left prefrontal areas (Wassermann, 1998). Greater discomfort over frontal sites is likely due to a greater density of muscles and nerves in these scalp regions (Maizey et al., 2013; Wassermann, 1998; Machii et al., 2006; Loo et al., 2008). Individual differences in the distribution of muscle and nerve fibres may explain some of the variation in peripheral sensations seen across participants. The level of discomfort is related to the intensity and frequency of stimulation, but even single-pulse TMS can cause discomfort, especially with participants naïve to TMS (Maizey et al., 2013). Notably, ratings of scalp discomfort caused by TMS positively correlate with the number of errors made on a delayed match to sample task (Abler et al., 2005).
Duecker & Sack (2015) provided a review of sham TMS, for which a number of conditions and devices have been evaluated and developed (e.g., Arana et al., 2008; Rossi et al., 2007; Sommer et al., 2006). Sham TMS is designed to mimic the sound and sometimes the peripheral sensations of TMS, without changing cortical activity (Borckardt et al., 2013; Duecker & Sack, 2015). It is possible to create a sham condition under which participants cannot reliably judge whether they received sham or real rTMS (Duecker & Sack, 2015; Herwig et al., 2010). However, sham TMS has to deliver high intensity cutaneous sensations (70% of participant’s maximum pain tolerance) to be matched to real TMS (Arana et al., 2008).
The best-practice in TMS studies may be to have more than one control condition, with multiple stimulation sites or stimulation time points (e.g., Duecker & Sack, 2105; Miall et al.,. 2008; Tamè &
Holmes, 2016) and a control task (e.g., Sandrini et al., 2011). Control locations for TMS should attempt to control for peripheral sensations, yet to our knowledge, this control is not often implemented. Ideally, a selected control site should give the same level of comfort or discomfort as the experimental site. The vertex (Cz, at the top of the head) is often used, under the assumption that the brain tissue is deeper under the scalp, attenuating cortical stimulation (e.g., Kalbe et al., 2010; Sandrini et al., 2011; Silvanto et al., 2008; Whitney et al., 2010; Vetter et al., 2015; but see Fox et al., 1997; Jung et al., 2016; Loo et al., 2000). It is not clear that this location controls well for cutaneous sensations and discomfort, particularly when the experimental site is frontal and, on average, more painful (Wasserman, 1998).
The aim of the study reported here is to map the subjective discomfort of TMS across the scalp. Rather than comparing a small number of sites, we aimed for coverage of the entire scalp in order to create a detailed map of the frequency of muscle twitches, and participant ratings of annoyance and pain (extending the studies of Abler et al., 2005; Arana et al., 2008; Loo et al., 2000). We used two tasks that differed slightly in difficulty to test whether greater TMS-related discomfort would interact with task difficulty. Together with an accompanying website (http://www.tms-smart.info), the data provides a resource that researchers can use to control for the peripheral sensations caused by TMS.
2.0 Method
2.1 Participants
Twenty individuals took part. Ten completed a choice reaction time (CRT) ask and ten completed a ‘flanker’ task. All participants provided written informed consent and underwent screening in line with the TMS Rules of Operation at the Centre for Integrative Neuroscience and Neurodynamics, University of Reading. This excluded individuals unsuitable for TMS (presence of: cochlear implant, metal in the head shoulders or neck, implanted neurostimulator, medication infusion device, pacemaker, history of epilepsy or seizure, history of brain lesion, history of any neurological conditions including migraine, chronic fatigue/ME, history of sleep apnoea or narcolepsy, history of fainting spells or syncope, history of neurosurgical procedures, head trauma, hearing problems, medications with known risk for TMS, currently elevated levels of stress or fatigue, history of heart conditions or low blood pressure). The study received a favourable opinion for conduct from the University of Reading Research Ethics Committee (UREC Project 13/03).
For the choice RT task, mean age was 31.6 years (SD=5.5), 6 were female and all were right handed by self-report. Mean resting motor threshold, examined by visual inspection of muscle twitches in the hand, was 51.9% (SD=7.7%) of maximum stimulator output. For the flanker task, mean age was 25.2 years (SD=3.5 years), 6 were female and 8 were right handed by self-report. Their mean resting motor threshold was 48.5% (SD=6.4%) of maximum stimulator output (Rossini et al., 1994). All participants completed the ratings task. No participants or other data were excluded from the final dataset prior to analysis.
2.2 TMS equipment
2.3 Scalp locations
Figure 1: Locations of cortical sites stimulated with TMS and axes of stimulation.
2.4 Coil orientations
To measure the influence of coil orientation we used a cardinal reference system with North taken as the direction faced by the participant. This was preferable to any allocentric (e.g., superior, inferior, anterior, posterior) or neuraxis-centred (e.g., ventral, dorsal, rostral, caudal) reference system, since the coil orientation label did not change as the coil moved along the scalp. 'South' was always with the handle pointing along the surface of the scalp, parallel with the mid-sagittal line between nasion and inion; 'East' was always with the handle pointing along the surface of the scalp towards the right ear, parallel with the line between left and right ears. Each location was stimulated biphasically using four coil orientations that mapped 45 degree rotations around a circle. Orientations were North-South (along the midline), North East-South West (45° going clockwise), East-West (along the ear-to-ear axis, 90°), and North West-South East (135°, see Figure 1). The TMS coil handle was aligned to the above axes, with the handle usually oriented towards the back of the participant’s head and away from the face. The handle was rotated to lie in the opposite direction along the axis if this position was not possible (e.g., if the shoulder was in the way for inferior and lateral sites).
2.5 TMS intensity
We kept the intensity constant at 50% of the maximum stimulator output (MSO). This is the
approximate mean intensity for eliciting visible muscle contractions with this equipment in our
laboratory. Researchers using TMS often change the intensity of stimulation on a
participant-by-participant basis, for example, by setting the intensity to a fixed proportion of the resting (RMT) or
active motor threshold (AMT). This approach is appropriate when stimulating over motor cortex in
order to affect or elicit motor-evoked potentials in a contralateral muscle. A similar approach may be
useful for eliciting phosphenes by stimulating over occipital cortex (Siniatchkin et al., 2011). Less is
known about the relationship between TMS intensity and cortical activation for other brain areas (e.g.
Peurala et al., 2008), although the literature from combined TMS-neuroimaging studies shows
(Bestmann et al., 2008). We chose 50% intensity to provide a realistic level of stimulation (at or above
approximate RMT) that is within the typical range for a TMS study, and would therefore reflect a
typical level of discomfort. Previous studies in our laboratory found the mean±SD RMT to be 43±5%
of the maximum stimulator output when measured with electromyography (EMG, Tamè & Holmes,
2016), meaning that 50% is likely higher than approximately 90% of participants' RMT. This level of
stimulation is likely to have stimulated the cortex of many, if not all of the sites used in our experiment.
However, due to differences in scalp to brain distance between participants and sites (Table 1), the
intensity of cortical stimulation likely differed across sites. We had two options for setting TMS
intensity: 1) adjusted for each participant and site, or 2) kept constant across participants and sites.
We could have attempted to set the TMS intensity to obtain approximately the same level of cortical
stimulation across all participants and sites. For example using MEPs as an output variable,
systematically mapping over the motor cortex to find the site and coil orientation that induced MEPs at
the lowest intensity, then found the RMT and AMT for each participant, then decreased the intensity
so that no effect of TMS was visible on the EMG. Using this ineffectual TMS intensity (but see
Bestmann et al., 2008), we could then have applied a scalp to brain distance adjustment (Stokes et
al., 2007) to adjust the TMS intensity for all remaining TMS sites. This method would have the
advantage of being less likely to have stimulated the cortex, but it would have likely resulted in TMS
intensities of 20-30% MSO, much lower than typically used in experiments. Most importantly, this
method of TMS intensity adjustment per participant and site would have confounded the purpose of
the experiment: to measure the relative annoyance of TMS between scalp sites at levels of stimulation
typically used in experiments. In addition, different TMS intensities at different scalp locations would
render the ratings of annoyance, pain and twitches meaningless for further analysis. In order to
systematically map the difference in subjective discomfort across scalp sites, TMS intensity needed to
be constant whilst we differed scalp location.
Thus, we maintained TMS intensity constant, at 50% MSO. Ours is a study of the scalp, not of the
brain. We accept, of course, that stimulation of the underlying cortex was very likely for many, if not all
scalp locations and participants. Nevertheless, it is parsimonious to assume that our results relate
not targeted and with variable-intensity TMS. We also completed post-hoc analyses to control for
scalp-to-brain distance (see below).
Since 50% of maximal stimulator output is below the stimulation strength used in many TMS studies,
our data may provide an underestimate of the eventual discomfort related effects seen in these other
studies. Appendix C provides preliminary data for how ratings of annoyance, pain and twitches
increase as TMS intensity increases.
2.6 Tasks and stimuli
All stimuli were presented using Matlab and Psychtoolbox 3 (Brainard, 1997) in black text on a white background, font size 20, screen resolution 1920 x 1080 pixels. Stimuli were presented using a CRT monitor with 75 Hz refresh rate.
2.6.1 Choice reaction time task
correct, and size of congruency effect, see Appendix A), these three participants' data were included in the final analysis. Removing these data points and re-analysing did not change the conclusions drawn.
2.6.2 Flanker task (Eriksen & Eriksen, 1974)
Stimuli were the left and right chevrons (< and >). Three chevrons were presented centrally, and faced left (<<<) or right (>>>). Flanker chevrons facing left or right were presented either side, displaced 100 pixels horizontally from the centre of the screen. Therefore, there were two congruent conditions (<<< <<< <<<, >>> >>> >>>) and two incongruent conditions (<<< >>> <<<, >>> <<< >>>). Participants were instructed to press the C key with one finger if the central chevrons pointed left, and N with another finger if they pointed right. Speed and accuracy were both encouraged.
2.6.3 Ratings Task
2.7 Design and procedure
The Lycra cap with scalp locations was fitted to the participant with the Cz marker aligned to their vertex, and periodically checked during the experiment. Resting motor threshold was first established for each participant (Rossini et al., 1994). We identified the approximate location of M1 by measuring 5cm lateral and 1cm anterior from vertex for the hemisphere to be tested (right or left). Participants rested their ipsilateral hand on the desk, clearly visible to the experimenters. Test TMS pulses were delivered around this location until a visible twitch was seen in the thumb, index, or middle fingers (typically originating from the 1st or 2nd dorsal interosseous, adductor pollicis, or opponens pollicis muscles). Stimulator intensity was varied until a visible twitch was seen on 5 out of 10 consecutive pulses, delivered at approximately 0.2Hz. This stimulator intensity was recorded as the resting motor threshold (RMT).
For the behavioural experiment, stimulation strength was set at 50% MSO (biphasic). As confirmed by our data, this level was selected to be approximately at RMT. Single-pulse TMS studies typically stimulate at 110-140% RMT. However, since RMT assessed visually (as we did) is likely to be 11% higher than RMT assessed with EMG (Westin et al., 2014), this intensity of stimulation was likely above threshold for stimulating cortex. One hemisphere per participant was stimulated at all scalp locations during the experiment. The order of testing Scalp Location was fully randomised for each participant. Coil orientation was nested within location and then randomised (i.e., a randomly selected permutation of all possible orders of the four coil orientations was selected once location had been selected). Half of the participants had their left, and half their right hemisphere stimulated. This between-subjects manipulation of hemisphere was a pragmatic decision that allowed data collection to be completed in one two-hour session (partly to meet the requirements of our local ethics committee). To account for any potential confound from this manipulation, data analyses included Hemisphere and the interaction between Hemisphere and Scalp Location as predictors of interest.
Each task had identical timings and trial and block structure. Participants completed 60 practice trials with no TMS (coil disabled, away from head; 3 blocks of 20 trials, with each block split into 4 mini-blocks of 5 trials to reflect the actual experiment). They were then introduced to the rating task and response scales. To explain the rating procedure, participants were asked to remember the TMS pulses delivered during the RMT procedure and consider the sensations (annoyance, pain, and twitches) that they may have experienced. Thus, these pulses acted as reference pulses for participants' ratings of annoyance, pain, and twitches. During the experiment, participants completed 5 experimental trials for each combination of coil orientation and scalp location. The experiment was structured so that a location was randomly selected, and then each of 4 randomly-ordered coil orientations was completed for that location (4 blocks of 5 trials for each location; 20 trials per location). In each block of 5 trials, a fixation cross appeared for a randomly selected duration between 500 and 1000ms, followed by the imperative stimulus. A single TMS pulse was delivered at the same time as the imperative stimulus appeared on screen. Stimuli appeared on screen until the participant responded or until 2 seconds, whichever was sooner. There was an inter-trial-interval of 2 seconds. In each block of 5 trials, participants saw one of each trial type (congruent left, incongruent left, congruent right, incongruent right) and a randomly selected 5th trial. After completing the 5 trials of the task, they were asked to give ratings for the annoyance, pain, and twitches caused by the preceding 5 TMS pulses. Participants were asked to provide ratings after 5 trials to allow them to complete the behavioural task whilst experiencing more than one pulse at that location and with that coil orientation. The total number of trials per participant was 480 (5 trials x 4 orientations x 24 locations). In between each block of 5 trials, participants were able to take a break for as long as they wished.
2.8 Analysis
variables (all correlation coefficients>=0.9), and was therefore used in further analyses as a fixed effect predictor.
RTs were taken from correct trials only. We used RTs from correct practice trials for baseline RT (the first 20 trials were discarded as true practice trials - we assumed that RT would be stable after these initial trials). The mean practice RT was taken for each trial type (congruent left, incongruent left, congruent right, incongruent right) and this was subtracted from the RT for that trial type during the TMS experiment, on a trial-by-trial basis. This gave us the difference in RT for a specific trial type, when the participant was undergoing TMS. Therefore, all analyses of RTs looked at how the predictor variables changed the impact of TMS on RTs. Inspection of initial linear mixed-effects models showed that residuals were not normally distributed, caused by a rightward skew typical in reaction time data (Baayen & Milin, 2010; Ratcliff, 1993). Following Baayen & Milin (2010), data trimming and transformations, followed by model inspection, were explored to best normalize residuals for the models (based on visual inspection of residual plots). The best results were achieved with a single cut-off value, excluding all reaction time differences longer than 400ms (the minimum reaction time difference was -389ms, so an upper cut-off was selected to mirror the minimum value). This removed 2.9% of the data.
To allow analysis of Scalp Location as a within subjects variable, we coded homologous scalp locations across left and right hemispheres together to look at the effect of scalp location on RT. For example, FP1 (left) and FP2 (right) were coded together, the two ATL sites were coded together, and so on.
and a facility to find suggested control sites for each TMS location (10:20 system) and for individual MNI coordinates.
3.0 Results
3.1 Task performance
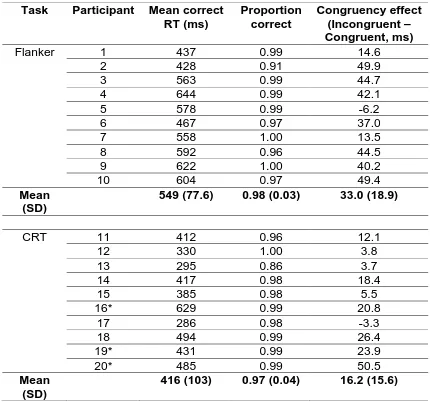
We compared error rates between Flanker and CRT tasks and found no significant difference (median errors Flanker=5 (range 0-44), median errors CRT=5.5 (range 0-66); Kruskal-Wallis=0.0230, df=1, p-value=0.879). Within task (Wilcoxon signed ranks test), there was no significant difference between congruent and incongruent conditions for the Flanker task (median errors congruent=1.5 (range 0-6), median errors incongruent=2 (range 0-41); W=35, p=0.264) and no significant difference for the CRT task (median errors congruent=3 (range 0-29), median errors incongruent=2.5 (range 0-37); W=49.5, p>0.900).
3.2 Scalp mapping of annoyance ratings and twitches
Median ratings of twitch intensity (Figure 2, upper panels) varied from 0 (at superior sites on or adjacent to the midline) to 7 out of 10 (inferior frontal and anterior temporal sites). Ratings were symmetrical across the midline, and included four peaks – over the left and right anterior temporal/inferior frontal cortices, and over the left and right lateral occipital cortices.
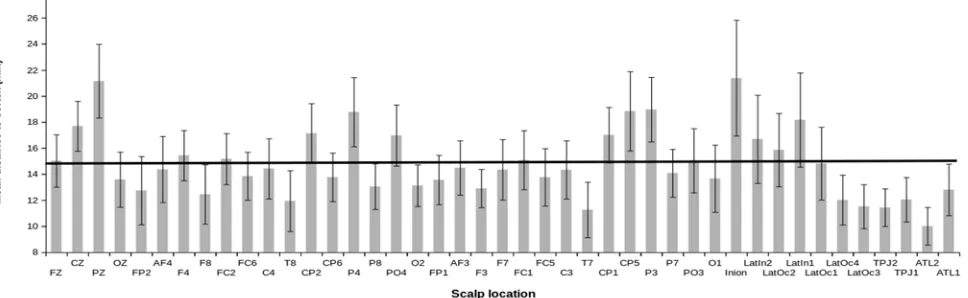
Mean effects of TMS on RT (Figure 2, lower panels) showed a broadly comparable distribution across the scalp, with the largest impairments in RT (up to 181ms) seen at inferior frontal, anterior temporal, and lateral occipital sites. The smallest changes in RT occurred along and adjacent to the superior midline, while TMS-related improvements in RT (up to 61ms) were seen at superior parietal and occipital sites in the left hemisphere. The following section assesses the relationships between participant ratings and the effects of TMS on behaviour.
3.3 Predicting reaction times by scalp location and coil orientation
t=12.57, p<0.001). The main effect of Task improved model fit (X2=4.443, df=1, p=0.035), the Flanker task showed a marginally greater impact of TMS on RT than the CRT task (estimate=34.97ms, SE=16.99, df=17, t=2.06, p=0.055). The main effect of Congruence was not significant (p=0.366) nor did it improve model fit (X2=0.8785, df=1, p=0.35). There was no significant interaction between Task and Congruence (p>0.1) and the interaction term did not improve model fit (X2=1.92, df=2, p=0.38). The effect of Coil Orientation was not significant and did not improve model fit (X2=4.86, df=3, p=0.18); there were no significant differences between any TMS coil orientations (Tukey Contrasts all p>0.6). Coil Orientation and Congruence were not included as fixed effects predictors in the final model. With random effects noted as re(), the final model that best explained the data was:
RT Difference under TMS ~ Scalp Location + Scalp Location x Hemisphere + Task + Previous RT + re(Participant) + re(Location x Participant) + re(Coil Orientation x Participant) + re(Congruence x Participant) + re(Trial x Participant)
The fixed effects alone had an R2 of 0.14, and the full model had an R2 of 0.43 (effect size of 0.80; Champely, 2016; Cohen et al., 2003; Selya et al., 2012; Lefcheck, 2015).
against Cz/vertex (est. mean=-36.69ms, SE=18.56ms, t(380)=-1.977, p=0.048). Figure 4 presents the RT difference in milliseconds for each scalp location (TMS RT – No TMS RT).
Figure 3: Effect of TMS by Scalp Location. Legend/Key: A positive difference means slower RT under TMS, a negative difference means faster RT under TMS. Error bars are 95% confidence intervals.
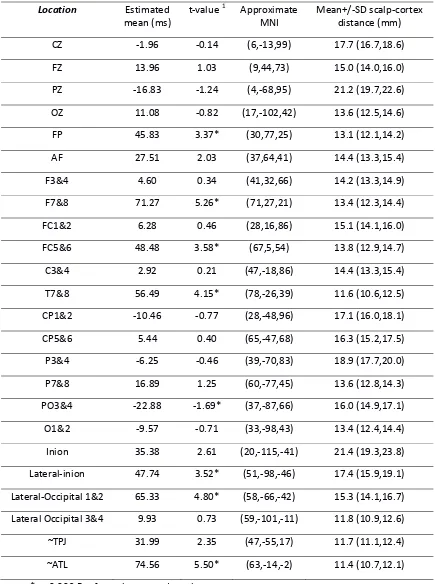
Table 1: Least squares estimated means1 for the effect of TMS on reaction times (ms) by scalp location with approximate MNI co-ordinates (mean of left and right hemispheres, with absolute X coordinates)
Location
Estimated
mean (ms)
t‐value 1 Approximate
MNI
Mean+/‐SD scalp‐cortex
distance (mm)
CZ ‐1.96 ‐0.14 (6,‐13,99) 17.7 (16.7,18.6)
FZ 13.96 1.03 (9,44,73) 15.0 (14.0,16.0)
PZ ‐16.83 ‐1.24 (4,‐68,95) 21.2 (19.7,22.6)
OZ 11.08 ‐0.82 (17,‐102,42) 13.6 (12.5,14.6)
FP 45.83 3.37* (30,77,25) 13.1 (12.1,14.2)
AF 27.51 2.03 (37,64,41) 14.4 (13.3,15.4)
F3&4 4.60 0.34 (41,32,66) 14.2 (13.3,14.9)
F7&8 71.27 5.26* (71,27,21) 13.4 (12.3,14.4)
FC1&2 6.28 0.46 (28,16,86) 15.1 (14.1,16.0)
FC5&6 48.48 3.58* (67,5,54) 13.8 (12.9,14.7)
C3&4 2.92 0.21 (47,‐18,86) 14.4 (13.3,15.4)
T7&8 56.49 4.15* (78,‐26,39) 11.6 (10.6,12.5)
CP1&2 ‐10.46 ‐0.77 (28,‐48,96) 17.1 (16.0,18.1)
CP5&6 5.44 0.40 (65,‐47,68) 16.3 (15.2,17.5)
P3&4 ‐6.25 ‐0.46 (39,‐70,83) 18.9 (17.7,20.0)
P7&8 16.89 1.25 (60,‐77,45) 13.6 (12.8,14.3)
PO3&4 ‐22.88 ‐1.69* (37,‐87,66) 16.0 (14.9,17.1)
O1&2 ‐9.57 ‐0.71 (33,‐98,43) 13.4 (12.4,14.4)
Inion 35.38 2.61 (20,‐115,‐41) 21.4 (19.3,23.8)
Lateral‐inion 47.74 3.52* (51,‐98,‐46) 17.4 (15.9,19.1)
Lateral‐Occipital 1&2 65.33 4.80* (58,‐66,‐42) 15.3 (14.1,16.7)
Lateral Occipital 3&4 9.93 0.73 (59,‐101,‐11) 11.8 (10.9,12.6)
~TPJ 31.99 2.35 (47,‐55,17) 11.7 (11.1,12.4)
~ATL 74.56 5.50* (63,‐14,‐2) 11.4 (10.7,12.1)
1 Least squares means testing whether RT difference (TMS‐No TMS) for each scalp location is significantly different to zero. Positive numbers indicate slower reaction times under TMS, negative
numbers indicate faster reaction times under TMS. Least squares means have been calculated for a
model that includes Scalp Location X Hemisphere, Task and Trial as predictors.
2 Measured in a separate group of 20 participants for whom we had an MRI scan available. The brain
and TMS locations used in the main experiment were registered to each of 19 other brain scans, and
mean scalp‐brain distance was estimated using FSLView. 95% Confidence intervals were obtained by
bootstrapping. Details in Appendix D.
3.4 Predicting reaction times by ratings of annoyance, pain, twitches, and by visible twitches
Figure 4: Reaction time difference (TMS – No TMS) by subjective rating of Twitch intensity for CRT and Flanker Tasks.
Legend/Key: A positive value on the y axis means slower RTs under TMS. Error bars are 95%
confidence intervals.
Once Twitch Rating was included in the model, the significant variation in RT as predicted by Scalp Location was substantially reduced. In this model, only one Scalp Location showed a significant difference to Cz. This was P03&4 (est. mean=-39.77, SE=18.49, df=381, t=-2.150, p=.032), which retained significantly speeded RT under TMS relative to Cz. All Scalp Locations which had shown slowing under TMS relative to CZ in the previous model were no longer significant. For this model, the fixed effects had an R2 of 0.14 (effect size 0.15) and the full model (i.e., both fixed
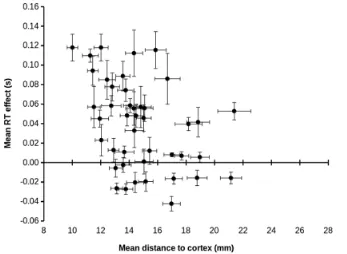
Appendix D provides details of a parallel analysis that uses scalp to brain distance instead of Scalp Location, where we found identical results. Thus, when subjective discomfort is taken into account (i.e., the inclusion of Twitch Ratings as a predictor), neither Scalp Location nor scalp to brain distance predict the cost of TMS on RT.
To check whether individual variation in resting motor threshold (RMT) influenced the results, we added each participant’s RMT as a predictor to this model, both as a main effect (i.e., does a higher or lower RMT change how much TMS influences overall RTs in the task?) and with an interaction between RMT and Scalp Location (i.e., does the influence of TMS on RT change for particular scalp locations when the participant has a higher or lower RMT?). It could be argued that individuals with lower RMT would be more likely to experience cortical stimulation from TMS (fixed at 50% of MSO). We might find that a lower RMT would lead to greater changes in RT under TMS (a main effect) or that particular cortical locations would show greater RT changes under TMS for individuals with lower RMT (an interaction). We found no such effects. That is, there was no significant main effect of RMT and no interaction between RMT and Scalp Location.
4.0 Discussion
When mapped across the scalp, subjective ratings and differences in reaction times showed minimal changes along the midline but high interference from TMS at inferior frontal, anterior temporal, and lateral occipital sites. This confirms previous reports that TMS is, on average, more uncomfortable over frontal than over other scalp locations (Abler et al., 2005; Loo et al., 2008; Machii et al., 2006; Maizey et al., 2013; Wassermann, 1998). Our experiment is the first to provide data that
systematically maps these effects across the scalp.
scalp locations (e.g., FZ, FC1&2, C3&4, see Table 1). However Cz/Vertex will only control for limited dimensions of TMS (e.g., the audible click, presence of the experimenter) when compared against scalp locations that are more uncomfortable under TMS (e.g., Lateral-Occipital, ATL, T7&8).
We found that subjective ratings of annoyance, pain, and twitches were highly correlated; this is perhaps unsurprising given that participants provided these ratings consecutively. It does, however, support previous findings that the discomfort caused by TMS is primarily due to the effect of the TMS pulse on the skin, nerves, and muscle of the scalp (Abler et al., 2005; Arana et al., 2008; Loo et al., 2000). Once ratings of muscle twitches were added as a predictor variable, the effect of Scalp Location disappeared for all areas where TMS caused longer RT. This means that the increase in RT seen for many Scalp Locations under TMS is due to the fact that these locations are more
uncomfortable under TMS. This finding did not change when we included scalp-to-cortex distance rather than scalp location. Abler and colleagues (2005) found a positive correlation between the number of errors on a task and subjective ratings of discomfort caused by TMS. Our data provides further support for the relationship between discomfort under TMS and changes in behavioural performance.
One question that we have been asked is “How do you know it wasn’t brain stimulation that caused the differences in behavioural response times?” It is likely that cortical stimulation did occur at most TMS sites and in most participants. However, the degree of cortical stimulation across different locations was, at best, poorly controlled due to varying scalp to brain distances (Stokes et al., 2005; Sack et al., 2009). When compared against other methods of localising cortical sites for stimulation (i.e., fMRI guided, MRI guided, and Talairach coordinates) the 10:20 anatomical system shows the smallest effect size for effects of TMS (versus sham) on RT (Sack et al., 2009). We found no effect of scalp to brain distance and no effect of resting motor threshold on RT once subjective discomfort was accounted for. The most parsimonious explanation for the cause of the clear and consistent effects of TMS on RT that we report, is peripheral stimulation and discomfort.
explained by cortical stimulation broadly enhancing visual attention or orienting during the task. Interestingly, for the parietal sites with faster RT under TMS (PO3&4) median ratings of annoyance, pain, and twitches were close to zero. Therefore, at these sites the TMS pulse at stimulus onset may have acted as a general alerting signal that reduced RT (Drager et al., 2004; Duecker et al., 2013; Duecker & Sack, 2013; Marzi et al., 1998; Nikouline et al., 1999; Sawaki et al., 1999). Our data is not able to distinguish between these two explanations.
The data also showed that greater discomfort (i.e., subjective ratings) produced a greater cost on task performance, and this cost differed by task. For every unit increase in annoyance there was a 14ms increase in RTs for the CRT task, and a 21ms increase in RTs for the Eriksen flanker task. Thus, more difficult tasks were affected more by the TMS-induced discomfort. Models explained ~45% of the variance in RTs. This is comparable, for example, to the size of the effect of scalp to brain distance on resting motor threshold (Stokes et al., 2007). Because of this relationship, control tasks need to be carefully matched to experimental tasks in TMS experiments in order for these confounds to be managed (Rossi et al., 2009). We should stress that our findings apply only to online single pulse TMS studies (i.e., the conditions that we tested), where the TMS pulse is delivered during task performance, close to stimulus presentation and the preparation and execution of a behavioural response. Whilst online and offline rTMS, paired-pulse, quadripulse, and other TMS protocols are all likely to induce similar scalp sensations, their influence on task performance needs to be determined.
We did not measure the participant’s ratings of auditory or visual interference of TMS at each site (although participants wore ear-plugs to mitigate this auditory interference). For sites close to the ears, the TMS-related sounds would have been louder and more lateralized than sites further away. For sites close to the eyes, participants' peripheral vision would have been partly occluded by the TMS coil. These variables may have explained additional variance in the data, and should be studied further.
to have more than one control condition for a reliable, specific effect of TMS (Sandrini et al., 2011). Our data provides a tool to select control sites for on-line TMS experiments (www.tms-smart.info) when researchers want to control for annoyance, pain, and twitches. In an ideal case, the control site will be a different brain region or scalp location, selected to match either for subjective ratings (annoyance, pain, or twitches), or for the effect on RT. For example, if the experimental TMS site is over the right TPJ with the coil handle oriented approximately 45 degrees behind the inter-aural axis (SE-NW, median rating of twitches=3), suitable control sites using the same coil orientation, include the right lateral inion (7.9cm away, median twitches=3), the right lateral occipital 2 (6.8cm away, median twitches=3), or FC6 (6.8cm away, median twitches=2.5).
Once target and control sites have been selected, we would then recommend a systematic pilot exploration of the effects of TMS intensity and coil orientation on participant-reported levels of annoyance, twitches, and pain, and on RT. We have provided an example of such a systematic exploration that could be used to select appropriate TMS intensities for different sites (Appendix C). Interestingly, for scalp locations shown to be the most annoying from our initial data, the effect of TMS intensity on ratings was linear (see Appendix C). Our data provides a tool to select control sites for on-line TMS experiments (www.tms-smart.info) when researchers want to control for annoyance, pain, and twitches. The tools on the website allow you to customise the search for control locations using all our available data, the 10:20 system, and/or MNI co-ordinates. We hope this data and the online resource will be useful for future TMS studies to properly control for the peripheral effects of TMS, particularly when those peripheral effects are extremely annoying.
References
Anderson, B., Mishory, A., Nahas, Z., Borckardt, J. J., Yamanaka, K., Rastogi, K., & George, M. S. (2006). Tolerability and safety of high daily doses of repetitive transcranial magnetic stimulation in healthy young men. Journal of ECT, 22(1), 49-53.
Arana, A. B., Borckardt, J. J., Ricci, R., Anderson, B., Li, X., Linder, K. J., Long, J. M., Sackeim, H. A., & George, M. S. (2008). Focal electrical stimulation as a sham control for repetitive transcranial magnetic stimulation: Does it truly mimic the cutaneous sensation and pain of active prefrontal repetitive transcranial magnetic stimulation? Brain Stimulation, 1(1), 44-51. doi:
10.1016/j.brs.2007.08.006
Baayen, R. H., & Milin, P. (2010). Analyzing reaction times. International Journal of Psychological Research, 3(2), 12-28.
Bates, D., Maechler, M., Bolker, B., & Walker, S. (2014) lme4: Linear mixed-effects models using Eigen and S4. R package version 1.1-6. http://CRAN.R-project.org/package=lme4
Barr, D. J., Levy, R., Scheepers, C., & Tily, H. J. (2013). Random effects structure for confirmatory hypothesis testing: Keep it maximal. Journal of Memory and Language, 68(3), 255-278. Bestmann, S., Baudewig, J., Siebner, H. R., Rothwell, J. C., & Frahm, J. (2005). BOLD MRI
responses to repetitive TMS over human dorsal premotor cortex. NeuroImage, 28(1), 22-29. doi: 10.1016/j.neuroimage.2005.05.027
Bestmann, S., Ruff, C. C., Blankenburg, F., Weiskopf, N., Driver, J., & Rothwell, J. C. (2008). Mapping causal interregional influences with concurrent TMS–fMRI. Experimental Brain
Research, 191(4), 383. doi: 10.1007/s00221-008-1601-8.
Benninger, D. H., Berman, B. D., Houdayer, E., Pal, N., Luckenbaugh, D.A., Schneider, L., Miranda, S., & Hallett, M. (2011). Intermittent theta-burst transcranial magnetic stimulation for treatment of Parkinson disease. Neurology, 76(7), 601-609. doi: 10.1212/WNL.0b013e31820ce6bb Bolognini, N., & Ro, T. (2010). Transcranial magnetic stimulation: disrupting neural activity to alter and
assess brain function. Journal of Neuroscience, 30(29), 9647-9650. doi: 10.1523/JNEUROSCI.1990-10.2010
Borckardt, J. J., Nahas, Z. H., Teal, J., Lisanby, S. H., McDonald, W. M., Avery, D., Durkalski, V., Pavlicova, M., Long, J. M., Sackeim, H. A., & George, M.S. (2013). The painfulness of active, but not sham, transcranial magnetic stimulation decreases rapidly over time: results from the double-blind phase of the opt-tms trial. Brain Stimulation, 6(6), 925-928. doi:
10.1016/j.brs.2013.04.009
Brainard, D. H. (1997). The psychophysics toolbox. Spatial Vision, 10(4), 433-436. doi: 10.1163/156856897X00357
Champely, S. (2016). pwr: Basic Functions for Power Analysis. R package version 1.2-0. http://CRAN.R-project.org/package=pwr
Chambers, C. D., & Heinen, K. (2010). TMS and the functional neuroanatomy of attention. Cortex, 46(1), 114-117.
Cohen, J., Cohen, P., West, S. G., & Aiken, L. S. (2003). Applied Multiple Regression/correlation Analysis for the Behavioral Sciences. 3rd Edition, Routledge.
Drager, B., Breitenstein, C., Helmkei U., Kamping, S., & Knecht, S. (2004). Specific and nonspecific effects of transcranial magnetic stimulation on picture-word verification. European Journal of Neuroscience, 20(6), 1681-1687. doi: 10.1111/j.1460-9568.2004.03623.x
Duecker, F., de Graaf, T. A., Jacobs, C., & Sack, A. T. (2013). Time-and task-dependent non-neural effects of real and sham TMS. PloS ONE, 8(9), e73813. doi: 10.1371/journal.pone.0073813 Duecker, F., & Sack, A. T. (2013). Pre-stimulus sham TMS facilitates target detection. PLoS
ONE, 8(3), e57765. doi: 10.1371/journal.pone.0057765
Duecker, F., & Sack, A. T. (2015). Rethinking the role of sham TMS. Frontiers in Psychology, 6, 210. Eriksen, B. A., & Eriksen, C. W. (1974). Effects of noise letters upon the identification of a target in a
nonsearch task. Perception & Psychophysics, 16(1), 143-149. doi: 10.3758/BF03203267 Fox, P., Ingham, R., George, M. S., Mayberg, H., Ingham, J., Roby, J., Martin, C., & Jerabek, P.
(1997). Imaging human intra-cerebral connectivity by PET during TMS. NeuroReport, 8(12), 2787-2791.
Herwig, U., Satrapi, P., & Schönfeldt-Lecuona, C. (2003). Using the international 10-20 EEG system for positioning of transcranial magnetic stimulation. Brain Topography, 16(2), 95-99.
Homan, R. W., Herman, J., & Purdy, P. (1987). Cerebral location of international 10–20 system electrode placement. Electroencephalography and Clinical Neurophysiology, 66(4), 376-382. Hothorn, T., Bretz, F., & Westfall, P. (2008). Simultaneous inference in general parametric models.
Biometrical Journal, 50(3), 346-363. doi: 10.1002/bimj.200810425
Jung, J., Bungert, A., Bowtell, R., & Jackson, S. R. (2016). Vertex stimulation as a control site for transcranial magnetic stimulation: A concurrent TMS/fMRI study. Brain Stimulation, 9(1), 58-64. doi: 10.1016/j.brs.2015.09.008
Kalbe, E., Schlegel, M., Sack, A.T., Nowak, D.A., Dafotakis, M., Bangard, C., Brand, M., Shamay-Tsoory, S., Onur, O.A. and Kessler, J., (2010) Dissociating cognitive from affective theory of mind: a TMS study. Cortex, 46(6), pp.769-780.
Kuznetsova, A., Brockhoff, P. B., & Bojesen, R. H. (2014) lmerTest: Tests for random and fixed effects for linear mixed effect models (lmer objects of lme4 package). R package version 2.0-6. http://CRAN.R-project.org/package=lmerTest
Lefcheck, J. S. (2015) piecewiseSEM: Piecewise structural equation modeling in
R for ecology, evolution, and systematics. Methods in Ecology and Evolution. 7(5): 573-579. DOI: 10.1111/2041-210X.12512
Loo, C. K., Taylor, J. L., Gandevia, S. C., McDarmont, B. N., Mitchell, P. B., & Sachdev, P. S. (2000). Transcranial magnetic stimulation (TMS) in controlled treatment studies: Are some “sham” forms active? Biological Psychiatry, 47(4), 325–331. doi: 10.1016/S0006-3223(99)00285-1 Loo, C. K., McFarquhar, T. F., & Mitchell, P. B. (2008). A review of the safety of repetitive transcranial
magnetic stimulation as a clinical treatment for depression. International Journal of Neuropsychopharmacology, 11(1), 131-147.
Machii, K., Cohen, D., Ramos-Estebanez, C., & Pascual-Leone, A. (2006). Safety of rTMS to non-motor cortical areas in healthy participants and patients. Clinical Neurophysiology, 117(2), 455-471. doi: 10.1016/j.clinph.2005.10.014
adverse effects to transcranial magnetic stimulation. Clinical Neurophysiology, 124(3), 536-544. doi: 10.1016/j.clinph.2012.07.024
Marzi, C. A., Miniussi, C., Maravita, A., Bertolasi, L., Rothwell, J. C., Sanes, J. N., & Zanette, G. (1998). Transcranial magnetic stimulation selectively impairs interhemispheric transfer of visuo-motor information in humans. Experimental Brain Research, 118(3), 435-438. doi:
10.1007/s002210050299
Melzack, R., & Casey, K. L. (1968). Chapter: 20. Sensory, motivational, and central control
determinants of pain: A new conceptual model. In Kenshalo, D., R. (Ed). The Skin Senses, pp. 423-439. Charles C Thomas, Springfield.
Miall, R. C., Christensen, L. O. D., Cain, O., & Stanley, J. (2008). Disruption of state estimation in the human lateral cerebellum. PLoS Biology, 5(11), e316. doi: 10.1371/journal.pbio.0050316 Nikouline, V., Ruohonen, J., & Ilmoniemi, R. J. (1999). The role of the coil click in TMS assessed with
simultaneous EEG. Clinical Neurophysiology, 110(8), 1325-1328. doi: 10.1016/S1388-2457(99)00070-X
O’Reardon, J. P., Solvason, H. B., Janicak, P. G., Sampson, S., Isenberg, K. E., Nahas, Z.,
McDonald, W. M., Avery, D. H., Fitzgerald, P. B., Loo, C. K., Demitrack, M. A., George, M. S., & Sackeim, H. A. (2007). Efficacy and safety of transcranial magnetic stimulation in the acute treatment of major depression: A multsite randomized controlled trial. Biological Psychiatry, 62(11), 1208-1216. doi: 10.1016/j.biopsych.2007.01.018
Peurala, S. H., Müller-Dahlhaus, J. F. M., Arai, N., & Ziemann, U. (2008). Interference of short-interval intracortical inhibition (SICI) and short-interval intracortical facilitation (SICF). Clinical
Neurophysiology, 119(10):2291-2297. doi. 10.1016/j.clinph.2008.05.031
R Core Team (2014). R: A language and environment for statistical computing. R Foundation for Statistical Computing, Vienna, Austria, 2012.
Ratcliff, R. (1993). Methods for dealing with reaction time outliers. Psychological Bulletin, 114(3), 510. doi: 10.1037/0033-2909.114.3.510
Rossi, S., Ferro, M., Cincotta, M., Ulivelli, M., Bartalini, S., Miniussi, C., Giovannelli, F., & Passero, S. (2007). A real electro-magnetic placebo (REMP) device for sham transcranial magnetic stimulation (TMS). Clinical Neurophysiology, 118(3), 709-716. doi:
10.1016/j.clinph.2006.11.005
Rossini, P. M., Barker, A. T., Berardelli, A., Caramia, M. D., Caruso, G., Cracco, R. Q., Dimitrijevic, M. R., Hallett, M., Katayama, Y., Lucking, C. H., Maertens de Nordhout, A. L., Marsden, C. D., Murray, N. M. F., Rothwell, J. C., Swash, M., & Tomberg, C. (1994). Non-invasive electrical and magnetic stimulation of the brain, spinal cord and roots: basic principles and procedures for routine clinical application. Report of an IFCN committee. Electroencephalography and Clinical Neurophysiology, 91(2), 79-92.
Ruff, C. C., Driver, J., & Bestmann, S. (2009). Combining TMS and fMRI: from ‘virtual lesions’ to functional-network accounts of cognition. Cortex, 45(9), 1043-1049. doi:
10.1016/j.cortex.2008.10.012
Sack, A. T., Kadosh, R. C., Schuhmann, T., Moerel, M., Walsh, V., & Goebel, R. (2009). Optimizing functional accuracy of TMS in cognitive studies: a comparison of methods. Journal of Cognitive Neuroscience, 21(2), 207-221. doi: 10.1162/jocn.2009.21126
Sandrini, M., Umiltà, C., & Rusconi, E. (2011). The use of transcranial magnetic stimulation in cognitive neuroscience: a new synthesis of methodological issues. Neuroscience & Biobehavioral Reviews, 35(3), 516-536. doi: 10.1016/j.neubiorev.2010.06.005 Sawaki, L., Okita, T., Fujiwara, M., & Mizuno, K. (1999). Specific and non-specific effects of
transcranial magnetic stimulation on simple and go/no-go reaction time. Experimental Brain Research, 127(4), 402-408. doi: 10.1007/s002210050808
Selya, A. S., Rose, J. S., Dierker, L. C., Hedeker, D., & Mermelstein, R. J. (2012). A practical guide to calculating Cohen’s f2, a measure of local effect size, from PROC MIXED. Frontiers in
Psychology, 3, 111.
Siniatchkin, M., Schlicke, C., Stephani, U. (2011). Transcranial magnetic stimulation reveals high test–retest reliability for phosphenes but not for suppression of visual perception. Clinical Neurophysiology, 122(12):2475-2481. doi: 10.1016/j.clinph.2011.05.003
Sommer, J., Jansen, A., Dräger, B., Steinsträter, O., Breitenstein, C., Deppe, M., & Knecht, S. (2006). Transcranial magnetic stimulation—a sandwich coil design for a better sham. Clinical
Neurophysiology, 117(2), 440-446. doi: 10.1016/j.clinph.2005.09.025
Sparing, R., & Mottaghy, F. M. (2008). Noninvasive brain stimulation with transcranial magnetic or direct current stimulation (TMS/tDCS)—from insights into human memory to therapy of its dysfunction. Methods, 44(4), 329-337. doi: 10.1016/j.ymeth.2007.02.001
Starck, J., Rimpiläinen, I., Pyykkö, I., & Esko, T. (1996). The noise level in magnetic stimulation. Scandinavian audiology, 25(4), 223-226.
Stokes, M. G., Chambers, C. D., Gould, I. C., Henderson, T. R., Janko, N. E., Allen, N. B., & Mattingley, J. B. (2005). Simple metric for scaling motor threshold based on scalp-cortex distance: application to studies using transcranial magnetic stimulation. Journal of neurophysiology, 94(6), 4520-4527.
Stokes, M. G., Chambers, C. D., Gould, I. C., English, T., McNaught, E., McDonald, O., & Mattingley, J. B. (2007) Distance-adjusted motor threshold for transcranial magnetic stimulation. Clinical Neurophysiology, 118(7):1617-1625. doi: 10.1016/j.clinph.2007.04.004
Taylor, P. C. J., & Thut, G. (2012). Brain activity underlying visual perception and attention as inferred from TMS–EEG: A review. Brain Stimulation, 5(2), 124-129. doi: 10.1016/j.brs.2012.03.003 Tamè, L., Holmes, N. P. (2016). Involvement of human primary somatosensory cortex in vibrotactile
detection depends on task demand. NeuroImage, 138, 184-196. doi: 10.1016/j.neuroimage.2016.05.056
Vetter, P., Grosbras, M. H., & Muckli, L. (2015). TMS over V5 disrupts motion prediction. Cerebral Cortex, 25(4), 1052-1059. doi: 10.1093/cercor/bht297
VonLoh, M., Chen, R., & Kluger, B. (2013). Safety of transcranial magnetic stimulation in Parkinson’s disease: A review of the literature. Parkinsonism and Related Disorders, 19, 573-585. doi: 10.1016/j.parkreldis.2013.01.007
Wagner, T., Valero-Cabre, A., & Pascual-Leone, A. (2007). Noninvasive human brain stimulation. Annual Review of Biomedical Engineering, 9, 527-565. doi:
10.1146/annurev.bioeng.9.061206.133100
Wassermann, E.M. (1998). Risk and safety of repetitive transcranial magnetic stimulation: report and suggested guidelines from the International Workshop on the Safety of Repetitive Trancranial Magnetic Stimulation, June 5-7,1996. Electroencephalography and Clinical Neurophysiology, 108(1), 1-16.
Westin GG, Bassi BD, Lisanby SH, Luber B (2014) Determination of motor threshold using visual observation overestimates transcranial magnetic stimulation dosage: safety implications. Clinical Neurophysiology, 125(1):142-147. doi: 10.1016/j.clinph.2013.06.187
Whitney, C., Kirk, M., O'sullivan, J., Lambon Ralph, M. A., & Jefferies, E. (2010). The neural
organization of semantic control: TMS evidence for a distributed network in left inferior frontal and posterior middle temporal gyrus. Cerebral Cortex, 21(5), 1066-1075.
Wickham, R. (2009). ggplot2: elegant graphics for data analysis. Springer New York, 2009. Wei, T (2013) corrplot: Visualisation of a correlation matrix. R package version 0.73, https://github.com/taiyun/corrplot
Appendix A
Table A1: Task by participant summary of mean RT, proportion correct and
congruency effects.
Task Participant
Mean correct
RT (ms)
Proportion
correct
Congruency effect
(Incongruent –
Congruent, ms)
Flanker 1
437
0.99
14.6
2 428
0.91 49.9
3 563
0.99 44.7
4 644
0.99 42.1
5 578
0.99 -6.2
6 467
0.97 37.0
7 558
1.00 13.5
8 592
0.96 44.5
9 622
1.00 40.2
10 604 0.97 49.4
Mean
(SD)
549 (77.6)
0.98 (0.03) 33.0
(18.9)
CRT 11
412
0.96
12.1
12 330 1.00
3.8
13 295 0.86
3.7
14 417 0.98 18.4
15 385 0.98
5.5
16* 629 0.99 20.8
17 286 0.98 -3.3
18 494 0.99 26.4
19* 431 0.99 23.9
20* 485 0.99 50.5
Mean
(SD)
416 (103)
0.97 (0.04)
16.2 (15.6)
Appendix B is an excel spreadsheet, this is available with the supplementary
materials via the Journal of Neuroscience Methods (DOI in the header above),
from the Open Science Framework website https://osf.io/f49vn/ or from the
authors on request.
Appendix C: Effect of varying TMS intensity on ratings of annoyance, pain, and muscle twitches
Following reviewers' comments on an earlier version of this manuscript, we studied, in one volunteer, the effect of varying TMS intensity on subjective ratings of annoyance, pain, and twitches, and on visible twitches. This approach could be used to further refine the choice of control site for an experiment.
Methods
[image:37.595.109.521.359.521.2]From the original dataset, we chose 6 scalp locations that spanned the full range of median twitch ratings (Table C1).
Table C1: Sites chosen for control study of TMS intensity
Median twitch rating (n=10 per hemisphere)
Rank Site Left Right
1 ATL1/2 6.4 5.5
5 TPJ1/2 3.6 2.8
10 AF3/4 2.4 1.3
14 C3/4 1.1 1.5
19 Cz .1
23 CP1/2 0 0
One participant who had taken part in the main experiment was recruited. The participant received 5 single pulses of biphasic TMS at ~0.2Hz at each location (in both left and right hemispheres for all sites except Cz), with the handle of the coil pointing South. After each set of 5 TMS pulses, the participant rated the subjective annoyance, pain, and twitches just as in the main experiment. An experimenter observed the participant, and noted down how many of the trials were accompanied by observable muscle twitches in the face, scalp, neck, or body of the participant.
Results & Discussion
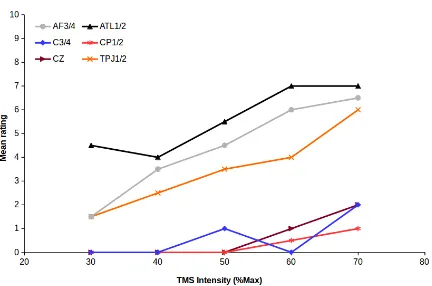
For each variable averaged across TMS sites, mean ratings increased linearly as a function of TMS intensity – r2s ranged between 0.90 (twitches) to 0.99 (visible twitches), all two-tailed ps<.05. The effect of TMS intensity was also approximately linear for ATL1/2 (r(3)=.912, p=.031), AF1/2 (r(3)=.982, p=.0029), TPJ1/2 (r(3)=.979, p=.0036, CP1/2 and Cz (both r(3)=.884, p=.047), but not for C3/4 (r(3)=.707, p=.18.
Data like this could be used, for example, to set TMS intensity for the control site to produce a comparable level of annoyance or muscle twitches to that of the target site (e.g., if control site cannot be varied freely). Further, these data support the assumption of a linear effect of TMS intensity on subjective annoyance, pain, and twitches, although for sites associated with low annoyance (midline and/or superior scalp locations), there may be an additional threshold of TMS intensity under which TMS is not at all annoying.
Figures
Figure C1: Mean across TMS sites as a function of TMS intensity (%Max) for subjective ratings of
annoyance (black triangles), pain (red asterisks), and muscle twitches (blue diamonds), as well as
observed twitches (grey circles). Visible twitches have been multiplied by two to show on the same
Figure C2: Mean across left and right hemispheres for each TMS site as a function of TMS intensity
(%Max) for subjective ratings of annoyance. Black triangles: ATL1/2; Grey circles: AF3/4; Orange
crosses: TPJ1/2; Blue diamonds: C3/4; Red asterisks: CP1/2; Maroon trianges: Cz.