Full Terms & Conditions of access and use can be found at
http://www.tandfonline.com/action/journalInformation?journalCode=rbri20
Building Research & Information
ISSN: 0961-3218 (Print) 1466-4321 (Online) Journal homepage: http://www.tandfonline.com/loi/rbri20
Indoor environmental quality and occupant
satisfaction in green-certified buildings
Sergio Altomonte, Stefano Schiavon, Michael G. Kent & Gail Brager
To cite this article: Sergio Altomonte, Stefano Schiavon, Michael G. Kent & Gail Brager (2017): Indoor environmental quality and occupant satisfaction in green-certified buildings, Building Research & Information, DOI: 10.1080/09613218.2018.1383715
To link to this article: https://doi.org/10.1080/09613218.2018.1383715
© 2017 The Author(s). Published by Informa UK Limited, trading as Taylor & Francis Group
View supplementary material
Published online: 01 Nov 2017.
Submit your article to this journal
Article views: 1112
View related articles
RESEARCH PAPER
Indoor environmental quality and occupant satisfaction in green-certified
buildings
Sergio Altomonte a*, Stefano Schiavon b, Michael G. Kentaand Gail Brager b
a
Department of Architecture and Built Environment, The University of Nottingham, UK;bCenter for the Built Environment, University of California, Berkeley, USA
ABSTRACT
Green-building certification systems aim at improving the design and operation of buildings. However, few detailed studies have investigated whether a green rating leads to higher occupant satisfaction with indoor environmental quality (IEQ). This research builds on previous work to address this. Based on the analysis of a subset of the Center for the Built Environment Occupant Indoor Environmental Quality survey database featuring 11,243 responses from 93 Leadership in Energy and Environmental Design (LEED)-rated office buildings, this study explores the relationships between the points earned in the IEQ category and the satisfaction expressed by occupants with the qualities of their indoor environment. It was found that the achievement of a specific IEQ credit did not substantively increase satisfaction with the corresponding IEQ factor, while the rating level, and the product and version under which certification had been awarded, did not affect workplace satisfaction. There could be several reasons for this, some of which are outside the control of designers and beyond the scope of rating systems based primarily on design intent. The challenges and priorities facing building professionals, researchers and green building certification systems are discussed for the creation of more comfortable, higher performing and healthier green-rated buildings.
KEYWORDS
certification; environmental assessment; green buildings; indoor environmental quality (IEQ); Leadership in Energy and Environmental Design (LEED); occupant satisfaction; occupants; post-occupancy evaluation
Introduction
Green-building certification systems – such as Leader-ship in Energy and Environmental Design (LEED) in the US, the Building Research Establishment Environ-mental Assessment Method (BREEAM) in the UK, Green Mark in Singapore, and Green Star in Australia –are assuming a prominent role to promote the sustain-ability agenda in the design and operation of buildings. However, although rating systems certify buildings under several categories (e.g. energy, water efficiency, sustainable sites, materials and resources, etc.), their role towards enhancing occupant satisfaction with indoor environmental quality (IEQ) – i.e.the thermal, acoustic, luminous and air-quality parameters that create the perceived internal ‘ambient environmental con-ditions’ (Hedge, 2000) – has been debated for a long time, but is still not fully characterized.
Particularly in the workplace, the satisfaction of building occupants with the qualities of their indoor
environment has been associated with their health and wellbeing (Institute of Medicine,2011; Bluyssen,2014), self-assessed job performance (Huang, Zhu, Ouyang, & Cao, 2012; Lamb & Kwok, 2016; Lan, Lian, & Pan, 2010; Lan, Wargocki, & Lian,2014; Wargocki & Seppä-nen, 2006), and behaviour (Frontczak et al., 2012; Frontczak & Wargocki, 2011). Some of these can also have a significant influence on buildings’energy require-ments (Janda,2011) due to the adaptive actions (e.g.on thermostats, blinds, lights, etc.) that users exercise in response to changes in environmental conditions (Haldi & Robinson,2011; Humphreys & Nicol,1998).
In this context, an awareness that people spend almost 90% of their time indoors (Klepeis et al.,2001), and that salary costs in commercial buildings largely exceed investment and operational expenses (RMI,2014), has triggered substantial interest in the potential contri-bution of green rating systems towards improved work-place experience.
© 2017 The Author(s). Published by Informa UK Limited, trading as Taylor & Francis Group
This is an Open Access article distributed under the terms of the Creative Commons Attribution License (http://creativecommons.org/licenses/by/4.0/), which permits unrestricted use, distribution, and reproduction in any medium, provided the original work is properly cited.
CONTACT Sergio Altomonte sergio.altomonte@uclouvain.be
*Currently at Architecture et Climat, Université catholique de Louvain, Place du Levant 1, Louvain-la-Neuve 1348, Belgium Supplemental data for this article can be accessedhttps://doi.org/10.1080/09613218.2018.1383715.
2017
The paper is structured as follows. The remainder of this section summarizes the literature in this area, and illustrates the aim and structure of this paper. Next, the methods are described for a rigorous statistical analysis of occupant satisfaction in LEED-rated buildings, whose results are presented in the third section. Then, supported by the information and feedback received from an industry focus group with building professionals and researchers, the findings are examined and discussed in the fourth section, and contextualized within the relevant scientific literature.
Green certification and occupant satisfaction
Various studies have investigated the energy perform-ance of green-rated offices against the general building stock (Newsham, Mancini, & Birt,2009; Scofield,2009, 2013), and have compared occupant IEQ satisfaction in green-certified and in conventional buildings (Newsham et al., 2012). However, despite the general assumption that a certified building leads to improved IEQ (USGBC,2017a), the empirical evidence has often been inconsistent, sometimes also due to differences in the metrics utilized and the methods employed for data col-lection and analysis.
Among recent research reporting the positive effects of better IEQ in certified buildings, MacNaughton et al. (2017) found higher occupants’ cognitive performance in green-rated offices (n= 69) than in non-certified but high-performing buildings (n= 40). Allen et al. (2016) also reported higher cognitive function scores under con-trolled air-quality conditions that would be expected in green-rated buildings compared with conventional ones (n= 24), supporting the results of earlier studies that suggested direct benefits of green rating to self-reported health (Allen et al.,2015; Macnaughton et al.,2016). Per-forming a meta-analysis on data from two field studies– Cost-effective Open-Plan Environments (COPE) project (n= 779) (Veitch, Farley, & Newsham,2002) and Green-POE (n= 230) (Newsham et al., 2012) – Leder, News-ham, Veitch, Mancini, and Charles (2016) found that users of certified offices tended to rate all aspects of environmental satisfaction more highly than occupants of conventional buildings, although working in a green-rated office was not necessarily associated with higher job satisfaction. This study also suggested that users of green buildings might be more‘forgiving’of indoor con-ditions, as already proposed by Leaman and Bordass (2007). Liang et al. (2014) reported higher IEQ satisfac-tion in three buildings certified by Taiwan’s Ecological Energy saving Waste reduction Health (EEWH) system (n= 134) compared with two non-rated buildings (n= 99). Satisfaction with thermal comfort, lighting, furniture
and cleanliness was found to be higher in two Korean-certified buildings than in two non-rated offices (n= 222) (Sediso & Lee, 2016). Hedge, Miller, and Dorsey (2014) compared user satisfaction in two LEED-certi-fied buildings (n= 249) with one conventional building (n= 70) in Canada, showing that working in a green-rated office was mostly considered a healthier and more satisfying experience. However, certified buildings were not necessarily perceived as more comfortable and productive workplaces, with significant variability par-ticularly on aspects that are not mandatory for LEED certification (e.g. acoustics, privacy and ergonomics). In a longitudinal study of two groups of bank employ-ees in South Africa, one moving to a Green Star-rated building (n= 98, 80 and 59, corresponding to three periods of analysis) and one staying in their non-certi-fied office (n= 114, 41 and 52), self-reported measures of physical wellbeing and productivity revealed higher ratings in the new certified building, although IEQ per-ceptions were not always more positive (Thatcher & Milner,2014). Similar results of improved self-assessed performance, wellbeing and enjoyment at work after moving into a newly refurbished BREEAM-rated office in UK were reported by Agha-Hossein, El-Jouzi, Elmualim, Ellis, and Williams (2013).
In contrast, other studies have shown occupants of green buildings seldom having consistently higher satis-faction with their indoor working environment, empha-sizing that the criteria for green certification might not yet be informed by a complete characterization of how physical conditions influence user perception. For example, Tham, Wargocki, and Tan (2015) compared the IEQ perception and prevalence of sick building syn-drome (SBS) symptoms and sick leave in a Green Mark Platinum-certified building (n= 31) against a conven-tional office in Singapore (n= 33). Although the Green Mark building was perceived as cooler, and as having fresher and cleaner air, it did not have different (physical, chemical and biological) measured IEQ parameters, nor was any association detected between certification and lower SBS symptoms or sick-leave records. Menadue, Soebarto, and Williamson (2013) compared surveys in four Green Star-rated buildings against four conven-tional offices in South Australia (n= 600). The data showed that green-certified buildings provided slightly higher satisfaction with thermal comfort and perceived health, but lower satisfaction with lighting, noise and self-assessed productivity. A follow-up study, which also included indoor monitoring, detected similar IEQ metrics and occupants’ perceptions in the two groups of buildings, although satisfaction with environmental conditions was in some cases lower in the Green Star offices (Menadue, Soebarto, & Williamson,2014).
Aim and structure
Common limitations of most previous research include: (1) relying on relatively small sample sizes (at the level either of the number of buildings or of individual occu-pant responses), hence increasing the chances of type II errors (i.e.low statistical power); and (2) being based pri-marily on null-hypothesis significance testing of differ-ences in mean satisfaction scores. These are methodological constraints that might severely limit the practical relevance of conclusions (Cumming,2014; Kirk, 2003). The present authors addressed both these limitations in earlier work where we investigated if LEED certification leads to higher, equal or lower occu-pant satisfaction (Altomonte & Schiavon,2013; Schiavon & Altomonte,2014). In these studies, we analysed a large subset of the Center for the Built Environment (CBE) survey database featuring 21,477 responses from 144 office buildings, of which 65 were LEED rated. Different from previous research, we based the inferential analysis on the estimation ofeffect sizes, a standardized measure of the magnitude of differences detected and not just their statistical significance (Field, Miles, & Field, 2012). The results showed equal satisfaction with the building, workspace and several parameters of IEQ, between occupants of certified and non-certified offices, independent ofspatial factorssuch as building size, office type, workspace layout and distance from windows, and ofpersonal characteristicssuch as gender, age, work type and working hours. However, LEED buildings were found to be more effective in delivering occupant satis-faction in open spaces rather than in enclosed offices, and in small rather than in large buildings. In addition, results suggested that users of LEED offices may be more satisfied with air quality but less satisfied with the amount of light, and that the positive value of certi-fication might decrease with time. In further research, we reached similar conclusions in a selection of BREEAM-rated office buildings in UK (Altomonte, Saadouni, Kent, & Schiavon,2017).
These studies, however, did not include a detailed analysis of the associations between occupant satisfac-tion and the specific credits obtained by buildings under the IEQ category. To our knowledge, there is no research to date that has used a large sample of users’ surveys to study their satisfaction with IEQ in green-rated buildings at the individual credit level. In response, this paper investigates occupant satisfaction in buildings certified by the LEED green rating system, considering: (1) the individual credits obtained under the IEQ cat-egory; (2) the total IEQ points earned and the LEED pro-duct and version under which certification was awarded; and (3) the final level of LEED rating attained.
Methods
LEED rating system and the IEQ category
LEED is a voluntary, consensus-based, market-driven programme providing third-party verification for green buildings (USGBC,2017b). Since its inception in 1998, all LEED products – e.g. LEED for New Construction (NC), LEED for Existing Buildings (EB), LEED for Com-mercial Interiors (CI)–have gone through many releases (USGBC,2014). For example, LEED NC–now featured within LEED: Building Design + Construction (BD + C) (USGBC, 2017c) – has evolved from version v2.0 in 2000, to v2.1 in 2002, v2.2 in 2005, v3 in 2009 and v4 in 2013. LEED uses a credit-based structure through which points can be earned across several categories: Location and Transportation, Sustainable Sites, Water Efficiency, Energy and Atmosphere, Material and Resources, Indoor Environmental Quality (IEQ), Inno-vation, and Regional Priority (USGBC, 2017c). Every category features various credits, some being mandatory prerequisites, each evaluating a project’s performance and awarding points accordingly. Based on the number of points earned, a project can attain the following rating levels: Certified (40–49), Silver (50–59), Gold (60–79) and Platinum (≥80 points).
The current paper is particularly focused on the IEQ category, which features credits related to indoor air quality, thermal comfort, interior lighting, daylight, views, controllability of systems, acoustic performance,
etc. The distributions of IEQ credits, and the number of points awarded, differ according to the LEED pro-duct and version under which certification is sought.
Table 1 provides a comparison of the IEQ credits
awarded by LEED NC/BD + C under v2.0, v3 and v4. The area-related credits are presented in rows, with an indication of the number of points that can be earned in each. Although the name of credits might have remained substantially unchanged across versions, the criteria for their attainment have progressively evolved.
Description of the dataset
dissatisfied’ (–3), with a neutral midpoint (0). The full database currently features over 100,000 user responses collected from over 1200 buildings around the world (CBE, 2017). The dataset for this analysis includes 11,243 occupant responses from 93 office buildings located in the US (83) and Canada (10). All buildings administered the CBE survey within two years of receiving their LEED certification and were rated under: LEED for New Constructions & Major Renova-tions (NC); LEED for Existing Buildings, Operation & Maintenance (EB/EBOM); or LEED for Commercial Interiors (CI).
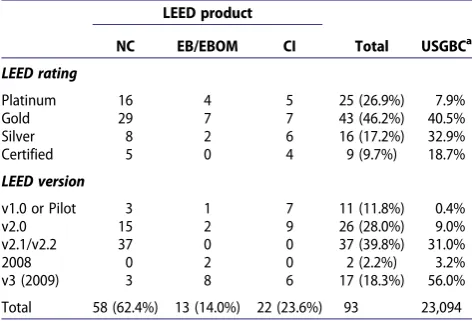
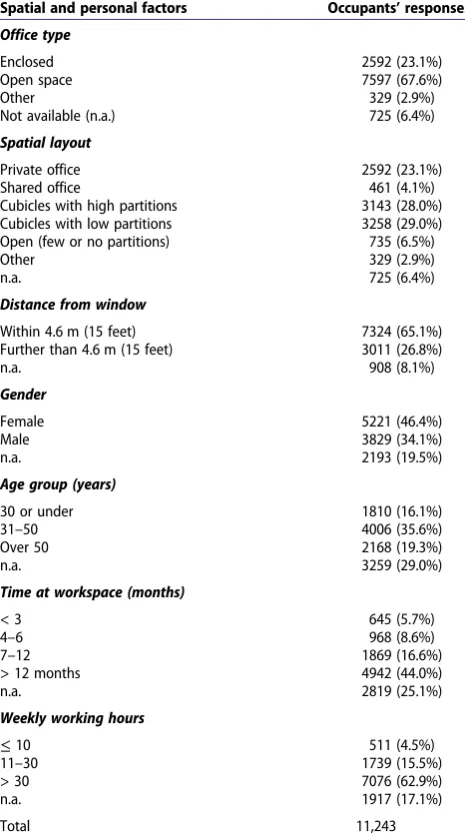
The distribution of buildings and occupant responses by LEED product, version and rating level are reported inTables 2 and 3. Separate from our own dataset, the last column ofTable 2provides a percentage distribution of LEED ratings and versions for the buildings certified by LEED NC, EB/EBOM and CI currently featured in the USGBC public project directory (USGBC, 2017d). Compared with the USGBC data, the buildings in our dataset are skewed towards the highest levels of certifica-tion (Gold and Platinum) and older LEED versions (v1.0/v2.2).Table 4provides the distribution of occupant responses based on buildings’ spatial factors and per-sonal characteristics (Frontczak & Wargocki, 2011; Schiavon & Altomonte,2014).
Data analysis
This study is structured on a rigorous statistical analysis of occupant satisfaction in LEED-rated buildings, whose results are presented below in the next section.
[image:5.609.54.549.72.349.2]The statistical analysis was based on a subset of the CBE survey centred on 12 categories. Of these, empha-sis was given to: satisfaction with the building, work-space and features of the indoor environment related to air quality, temperature, lighting, visual comfort, Table 1.Distribution of indoor environmental quality (IEQ) credits for Leadership in Energy and Environmental Design (LEED) for New Construction v2.0, v3 and v4.
LEED NC v2.0 (2000) LEED NC v3 (2009) LEED BD + C: NC v4 (2013)
Minimum IAQ Performance (R) Minimum IAQ Performance (R) Minimum IAQ Performance (R)
Environmental Tobacco Smoke Control (R) Environmental Tobacco Smoke Control (R) Environmental Tobacco Smoke Control (R)
Carbon Dioxide (CO2) Monitoring (1)
Increased Ventilation Effectiveness (1)
Indoor Chemical and Pollutant Source Control (1)
Outdoor Air Delivery Monitoring (1) Increased Ventilation (1)
Indoor Chemical and Pollutant Source Control (1)
Enhanced IAQ Strategies (2)
Low-Emitting Materials Adhesive and Sealants (1) Paints and Coatings (1) Carpet Systems (1) Composite Wood (1)
Low-Emitting Materials
Adhesive and Sealants (1) Paints and Coatings (1) Flooring Systems (1)
Composite Wood and Agrifiber Products (1)
Low-Emitting Materials (3)
Construction IAQ Management Plan–During Construction (1)
Construction IAQ Management Plan–During Construction (1) Construction IAQ Management Plan (1)
Construction IAQ Management Plan–After Construction (1)
Construction IAQ Management Plan–Before Occupancy (1) IAQ Assessment (2)
Controllability of Systems–Thermal Comfort (1) Thermal Comfort–Design (1)
Thermal Comfort–Verification (1)
Controllability of Systems–Non-Perimeter Spaces (1) Thermal Comfort–Compliance with ASHRAE 55-1992 (1) Thermal Comfort–Permanent Monitoring System (1)
Thermal Comfort (1)
Controllability of Systems– Perimeter Spaces (1)
Controllability of Systems–Lighting (1) Interior Lighting (2)
Daylight and Views– Daylight 75% of spaces (1)
Daylight and Views–Daylight (1) Daylight (3)
Daylight and Views– Views 90% of spaces (1)
Daylight and Views–Views (1) Quality Views (1)
– – Acoustic Performance (1)
Notes: IAQ = indoor air quality; R = required credits that are prerequisite for certification.
Table 2.Distribution of buildings in the dataset.
LEED product
NC EB/EBOM CI Total USGBCa
LEED rating
Platinum 16 4 5 25 (26.9%) 7.9%
Gold 29 7 7 43 (46.2%) 40.5%
Silver 8 2 6 16 (17.2%) 32.9%
Certified 5 0 4 9 (9.7%) 18.7%
LEED version
v1.0 or Pilot 3 1 7 11 (11.8%) 0.4%
v2.0 15 2 9 26 (28.0%) 9.0%
v2.1/v2.2 37 0 0 37 (39.8%) 31.0%
2008 0 2 0 2 (2.2%) 3.2%
v3 (2009) 3 8 6 17 (18.3%) 56.0%
Total 58 (62.4%) 13 (14.0%) 22 (23.6%) 93 23,094 Note:aUpdated in June 2017 fromhttp://www.usgbc.org/projects
consider-ing a total of 23,094 buildconsider-ings certified by LEED NC, LEED EB/EBOM and LEED CI (this also includes 76 buildings certified by LEED v4, corresponding to 0.4% of the total).
[image:5.609.313.550.540.700.2]noise and cleanliness; and to self-assessed conditions for productivity. This selection aimed to focus on the CBE survey categories most relevant to the IEQ credits featured in the LEED products and versions under which buildings in this dataset were certified. The only exceptions were the CBE questions about acoustic quality (noise level and sound privacy), which were not addressed in LEED credits until v4 (not included in this research). However, these categories were still included in this study due to the relevance that the acoustic environment has for overall occupant satisfaction.
The first part of our analysis investigated the relation-ships between the individual IEQ credits obtained and occupant satisfaction with the survey categories that might be influenced by the design strategies related to their achievement. For this, a series of pairings (Table 5) was developed from which 72 comparisons were analyzed.
Calculations were made of the descriptive statistics (mean, standard deviation, median, first and third quartiles) and the differences between the means and medians of satisfaction scores by organizing occupant responses in two independent groups, corresponding to the buildings that had obtained a specific IEQ credit (x1) and buildings that had not (x0). Initial exploratory
[image:6.609.58.297.66.234.2]inspection of the data, performed by Shapiro–Wilk (Sha-piro & Wilk,1965) and Kolmogorov–Smirnov (Smirnov, 1948) tests, revealed consistent non-normal distributions for all comparisons (tests were all highly significant). Since the assumption of homogeneity of variance (Ansari–Bradley tests) was also frequently violated (Ansari & Bradley,1960), and data had an ordinal char-acter, we tested the statistical significance of differences between satisfaction scores with a two-tailed non-para-metric Wilcoxon rank-sum test. This test looks for differ-ences between two independent groups and calculates the associated p-value using a Monte Carlo method (Field et al., 2012). For all tests, the results were con-sidered statistically significant when p≤0.05. Whereas some LEED credits allowed earning more than one point (i.e.EQc2, EQc2.4, EQc.8.1), the related occupant responses were excluded from the analysis since their very small number resulted in comparisons between independent groups of a strongly inhomogeneous sample size, hence limiting the robustness of inferences (e.g.higher risk of type II errors, particularly when the assumption of homogeneity of variance was violated). Due to the large size of the samples considered, which may confound statistical and practical significance, for each comparison we calculated the effect size to quantify the practical relevance of statistically significant differ-ences (Schiavon & Altomonte, 2014). Consistent with Table 3.Distribution of occupants’responses in the dataset.
LEED product
NC EB/EBOM CI Total
LEED rating
Platinum 1186 (22.3%) 848 (29.7%) 291 (9.5%) 2325 (20.7%) Gold 3472 (65.1%) 1456 (50.9%) 1746 (57.2%) 6674 (59.4%) Silver 524 (9.8%) 556 (19.4%) 425 (13.9%) 1505 (13.4%) Certified 148 (2.8%) 0 591 (19.4%) 739 (6.6%)
LEED version
v1.0 or Pilot
284 (5.3%) 80 (2.8%) 1602 (52.5%) 1966 (17.5%)
v2.0 1371 (25.7%) 164 (5.7%) 899 (29.4%) 2434 (21.6%) v2.1/v2.2 3523 (66.1%) 0 0 3523 (31.3%)
2008 0 491 (17.2%) 0 491 (4.4%)
v3 (2009) 152 (2.9%) 2125 (74.3%) 552 (18.1%) 2829 (25.2%) Total 5330 (47.4%) 2860 (25.4%) 3053 (27.2%) 11,243
Table 4.Distribution of occupants’responses based on spatial factors and personal characteristics.
Spatial and personal factors Occupants’responses
Office type
Enclosed 2592 (23.1%)
Open space 7597 (67.6%)
Other 329 (2.9%)
Not available (n.a.) 725 (6.4%)
Spatial layout
Private office 2592 (23.1%)
Shared office 461 (4.1%)
Cubicles with high partitions 3143 (28.0%) Cubicles with low partitions 3258 (29.0%) Open (few or no partitions) 735 (6.5%)
Other 329 (2.9%)
n.a. 725 (6.4%)
Distance from window
Within 4.6 m (15 feet) 7324 (65.1%) Further than 4.6 m (15 feet) 3011 (26.8%)
n.a. 908 (8.1%)
Gender
Female 5221 (46.4%)
Male 3829 (34.1%)
n.a. 2193 (19.5%)
Age group (years)
30 or under 1810 (16.1%)
31–50 4006 (35.6%)
Over 50 2168 (19.3%)
n.a. 3259 (29.0%)
Time at workspace (months)
< 3 645 (5.7%)
4–6 968 (8.6%)
7–12 1869 (16.6%)
> 12 months 4942 (44.0%)
n.a. 2819 (25.1%)
Weekly working hours
≤10 511 (4.5%)
11–30 1739 (15.5%)
> 30 7076 (62.9%)
n.a. 1917 (17.1%)
[image:6.609.60.293.316.733.2]our previous research, we calculated the effect size using the Spearman rho (ρ) rank-correlation coefficient. The interpretation of the outcome was based on the thresholds given by Ferguson (2009):ρ< 0.20 = negligible; 0.20≤ρ< 0.50 = small; 0.50≤ρ< 0.80 = moderate; and ρ≥0.80 = large; ρ < 0.20 was considered non-substantive, hence denoting non-practically relevant differences. In reporting the results of the inferential analysis, we also included Cliff’s delta (δ) coefficient as a further measure of effect size due to its more intuitive interpretation. Cliff’s δ – which is very strongly correlated to Spearman ρ–provides an estimation of the‘probability’that individ-ual observations in a group are larger (or smaller) than
those in another group, representing the degree of‘overlap’ between two distributions. It ranges from–1 (if all obser-vations in group 1 are larger than group 2) to +1 (if all observations in group 1 are smaller than group 2), and takes the value 0 if the two distributions are identical (Cliff,1996).
[image:7.609.63.548.75.523.2]For the second part of the analysis investigating the relationship between the total IEQ points earned by buildings and occupant satisfaction, we considered only the CBE survey categories focusing on satisfaction with the building and the workspace. The analysis was conducted on the full dataset of responses, while also taking into account the different LEED products and Table 5.Pairings between Leadership in Energy and Environmental Design (LEED) indoor environmental quality (IEQ) credits (and sub-credits) and Center for the Built Environment (CBE) survey categories.
LEED IEQ credit (and sub-credit) CBE survey category
EQc1–CO2Monitoring Air Quality
EQc1–Outdoor Air Delivery Air Quality
EQc1.1 and c1.2–IAQ Management, Outdoor Air & Ventilation Air Quality, Conditions for Productivity EQc1.3 and c1.4–IAQ Management, Particulates & Additions Air Quality
EQc2–Increased Ventilation Air Quality, Temperature, Noise
EQc2–Ventilation Effectiveness Air Quality, Temperature, Noise EQc2.2–Controllability of Systems, Lighting Amount of Light
EQc2.3–Occupant Comfort, Thermal Comfort Monitor Visual Comfort, Temperature
EQc2.4–Daylight and Views Amount of Light, Ability Lighta, Conditions for Productivity
EQc3.1–Construction IAQ Management, During Construction Air Quality EQc3.1–High Performance Green Cleaning Program Air Quality EQc3.2–Construction IAQ Management, Before Occupancy Air Quality EQc4.1–Low-Emitting Materials, Adhesive & Sealants Air Quality
EQc4.2–Low-Emitting Materials, Paints Air Quality EQc4.3–Low-Emitting Materials, Carpets Air Quality EQc4.4–Low-Emitting Materials, Composite Wood Air Quality EQc4.5–Low-Emitting Materials, Furniture and Seating Air Quality
EQc5–Indoor Chemical and Pollutant Source Control Air Quality, Building Cleanliness, Workspace Cleanliness EQc6.1–Controllability of Systems, Lighting Amount of Light, Ability Lighta, Visual Comfort
EQc6.1–Controllability of Systems, Perimeter Amount of Light, Visual Comfort, Temperature, Conditions for Productivity EQc6.2–Controllability of Systems, Non-Perimeter Amount of Light, Visual Comfort, Temperature
EQc6.2–Controllability of Systems, Thermal Comfort Temperature EQc6.2–Controllability of Systems, Temperature and Ventilation Temperature EQc7.1–Thermal Comfort, Comply ASHRAE 55 Temperature EQc7.1–Thermal Comfort, Compliance Temperature
EQc7.2–Thermal Comfort, Permanent Monitoring System Air Quality, Temperature EQc7.2–Thermal Comfort, Verification Air Quality, Temperature EQc7.2–Thermal Comfort Monitoring Air Quality, Temperature EQc8.1–Daylight and Views, Daylight Air Quality, Noise
EQc8.1–Daylight and Views, Daylight 75% of Spaces Amount of Light, Visual Comfort, Ability Lighta, Noise
EQc8.2–Daylight and Views, Views Air Quality, Amount of Light, Visual Comfort, Ability Lighta, Noise, Visual Privacy EQc8.2–Daylight and Views, Views 90% of Spaces Amount of Light, Visual Comfort, Ability Lighta, Visual Privacy
Note:aThe category Ability Light refers to satisfaction with light for task performance in response to the following question:‘Overall, does the lighting quality in
your workspace enhance or interfere with your ability to get your job done?’
versions under which certification was awarded. Initially, linear regressions were used to explore and highlight any observable association between the variables. Ordinal logistic regression was then performed, since this is an inferential statistical method that is suitable to treat single-response ordinal or categorical-scaled outcome variables–that is, occupant satisfaction–and continu-ous-scaled predictor variables–that is, total IEQ points earned (McCullagh, 1980; Winship & Mare, 1984). To examine the influence of LEED product and version on the outcome variable, a third variable system was used by separately specifying them as interaction terms in the ordinal logistic regression model (i.e. Total IEQ Points*LEED Product and Total IEQ Points*LEED Version). Only one covariate was included in the original model at one time. The proportion of variance explained by the predictor variables in the model is expressed in terms of pseudo-R2, with larger values indicating that more of the variation was accounted for by the model, to a maximum of 1 (Cox & Snell,1989). The interpret-ation of the outcome was informed by the thresholds provided by Ferguson (2009).
Finally, in the third part of the analysis, a Kruskal– Wallis analysis of variance (ANOVA) was used to study the relationships between the final level of LEED rating attained and occupant satisfaction with the building and the workspace (Kruskal & Wallis, 1952). A non-para-metric Fligner–Killeen test of homogeneity of variance was used to examine the variances across the independent groups (Fligner & Killeen,1976), andpost-hocWilcoxon rank sum tests were used to determine where the differ-ences detected in the ANOVA were (Field, 2016). Again, Spearmanρ was used as a measure of the effect size (Ferguson,2009) to infer the magnitude and practical relevance of the influences detected.
All statistical analysis was performed using R software version 3.3.1 (R Team,2017).
The interpretation of the results obtained was sup-ported by expert feedback gathered in the context of an industry focus group comprising some 20 building pro-fessionals who were invited to contribute based on their direct experience with the development, education, design and practice of LEED certification (Krueger, 2009). The discussions generated within the focus group, corroborated by an extensive literature review, were used as a framework to interpret and explain the patterns emerging from the data (Berg & Lune, 2011). These methods contributed different perspectives to help contextualize the findings from the statistical analy-sis, discuss the features that may contribute to improved IEQ, and frame the complex design and construction processes underlying the dynamic nature of building operations.
Results
Occupant satisfaction and individual IEQ credits
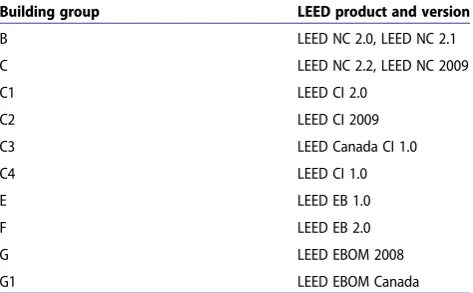
For each of the 72 comparisons between the CBE survey responses and the relevant LEED IEQ credit, homo-geneous samples were drawn only from buildings that were certified by the LEED product and version featuring that specific IEQ credit. The grouping of buildings is reported inTable 6.
Table 7andFigure 1present, respectively, the results of the analysis and a graphic visualization of the descrip-tive and inferential statistics for a selection of compari-sons focused on satisfaction with air quality, temperature, amount of light and visual comfort. The box plots and full descriptive and inferential statistics for all 72 comparisons are provided in Appendices A and B in the supplemental data online. The supplemental data provided also include the test statistic (AB) and two-tailed statistical significance (p-AB) for the Ansari–Bradley tests, and the test statistic (W) and
Z-score for the Wilcoxon tests.
The Wilcoxon rank-sum tests detected statistically significant differences in 49 of 72 cases. However, 71 of 72 comparisons had an effect size of negligible magni-tude (ρ< 0.20). A reasonable hypothesis would have been that there was higher satisfaction with a specific IEQ attribute in buildings having earned the associated IEQ point. Instead, the results in Table 7andFigure 1 reveal that the achievement of an individual IEQ credit
does nothave a practically relevant influence on occu-pant satisfaction with the corresponding IEQ parameter. The only exception is seen in the comparison between credit IEQc3.1–High Performance Green Cleaning Pro-gram and satisfaction with air quality (ΔMdn =–1.0,W
[image:8.609.314.551.561.707.2]= 205,000, p< 0.001***, ρ= 0.27). This small but sub-stantive effect size indicates, in this case, a better
Table 6.Building groups based on Leadership in Energy and Environmental Design (LEED) product and version.
Building group LEED product and version
B LEED NC 2.0, LEED NC 2.1
C LEED NC 2.2, LEED NC 2009
C1 LEED CI 2.0
C2 LEED CI 2009
C3 LEED Canada CI 1.0
C4 LEED CI 1.0
E LEED EB 1.0
F LEED EB 2.0
G LEED EBOM 2008
G1 LEED EBOM Canada
Table 7.Descriptive and inferential statistics for comparisons between occupant satisfaction and Leadership in Energy and Environmental Design (LEED) indoor environmental quality (IEQ) credits.
Credit Credit name Building Groups N0 N1 M0 M1 SD0 SD1 ΔM Mdn0 Mdn1 IQR0 IQR1 ΔMdn p δ ρ
Satisfaction with air quality
EQc2 Increased Ventilation & Ventilation Effectiveness C, C1, C2, C3, C4, F 2143 2417 1.24 1.44 1.54 1.49 –0.20 2.0 2.0 2.0 2.0 0.0 < 0.001 0.08 0.07
EQc3.1 High Performance Green Cleaning Program G. G1 368 1877 –0.02 1.16 1.64 1.46 –1.19 0.0 1.0 2.0 2.0 –1.0 < 0.001 0.41 0.27
Satisfaction with temperature
EQc6.2 Controllability of Systems, Thermal C, C1, C2, C3 2396 1854 0.51 0.67 1.76 1.80 –0.16 1.0 1.0 3.0 3.0 0.0 < 0.001 0.06 0.05
EQc7.2 Thermal Comfort Monitoring & Verification C3, C4 723 857 0.39 0.90 1.71 1.75 –0.51 1.0 1.0 3.0 2.0 0.0 < 0.001 0.18 0.16
Satisfaction with amount of light
EQc8.1 Daylight and Views, Daylight B, C1, C3 3850 1721 1.19 1.42 1.72 1.55 –0.23 2.0 2.0 3.0 2.0 0.0 < 0.001 0.06 0.05
EQc8.2 Daylight and Views, Views B, C1, C3 3283 2288 1.36 1.11 1.64 1.72 0.25 2.0 2.0 3.0 2.0 0.0 < 0.001 –0.09 –0.07
Satisfaction with visual comfort
EQc8.1 Daylight and Views, Daylight C, C2 982 891 1.47 1.22 1.57 1.62 0.25 2.0 2.0 2.0 2.0 0.0 < 0.001 –0.10 –0.09
EQc8.2 Daylight and Views, Views C, C2 1004 907 1.46 1.23 1.56 1.63 0.23 2.0 2.0 2.0 2.5 0.0 0.001 –0.08 –0.07 Notes: Presented are the coding and name of each credit, the building groups from where responses were drawn, the sizes of independent groups (N0corresponding to satisfaction votes expressed in buildings that had not earned a point in the specific LEED IEQ credit; andN1to buildings that had), the means of satisfaction scores in each group (M0andM1), the standard deviations (SD0and SD1), the differences in means (ΔM), the medians (Mdn0and Mdn1), the interquartile ranges (IQR0and IQR1), the difference in medians (ΔMdn), the statistical significance (p) for the Wilcoxon tests, and the effect sizes (Cliff’sδand Spearmanρ).
p≤0.001 = highly significant; 0.001 <p≤0.01 = significant; 0.01 <p≤0.05 = weakly significant;p> 0.05 = not significant; ρ< 0.20 = negligible; 0.20≤ρ< 0.50 = small; 0.50≤ρ< 0.80 = moderate;ρ≥0.80 = large.
8
S.
AL
TOMONT
E
ET
A
L
perception of air quality reported by occupants of build-ings certified by LEED EBOM 2008 and LEED EBOM Canada that have earned a point in the IEQ credit 3.1 (Figure 1(a)). However, this result should be treated with caution since the assumption of homogeneity of variance was violated (p-AB < 0.001***). Although the hypothesis of equal variances is not crucial when testing samples of equal, or nearly equal (and relatively large), sizes (Field et al., 2012), this comparison was based on very different numbers of responses in each independent group (N0= 368;N1= 1877).
Occupant satisfaction and total IEQ points
Table 8presents the sample sizes of buildings and occu-pants’responses based on the total number of IEQ points earned by the buildings featured in the dataset, ranging from a minimum of five to a maximum of 16 points. Figure 2 presents the linear regressions for the total LEED IEQ points and satisfaction with the workspace.
Figure 2(a) unexpectedly shows a tendency for satis-faction with the workspace to decrease slightly as the number of IEQ points earned increases (negative slope; regression coefficient =–0.03). Figure 2(b) plots the same relationship but now broken up by LEED product, showing that this negative relationship came primarily from buildings certified by LEED NC, while the
regression line was flat for LEED EB, and there was a positive slope for LEED CI (all regression coefficients are provided in the supplemental data online).Figure 2 (c) shows that buildings certified by newer versions of LEED (i.e.v3 (2009) and 2.2) performed slightly better in terms of mean workspace satisfaction as the total IEQ points increase. The linear regressions related to individual LEED products, included in Appendix C, also online, provide further context to these tendencies. Ordinal logistic regression was employed to explore whether the total number of IEQ points earned could predict occupant satisfaction with the workspace. In addition, consideration was also given to LEED product and version, separately treating them as covariates that interact with the predictor variable (total IEQ points) to study their effect on the outcome variable (occupant satisfaction). The results of the ordinal logistic regression are presented inTable 9.
[image:10.609.71.534.52.293.2]As one might have expected from a visual inspection of Figure 2, Table 9 shows that the total number of IEQ points earned by a building does not affect satisfaction with the workspace (pseudo-R2= 0.01). Adding as a cov-ariate the LEED product (Total IEQ Points*LEED Pro-duct) provides negligible improvement to the predicting capacity of the model (pseudo-R2= 0.02). Conversely, the proportion of variance accounted for by the predictor variables achieves a benchmark of practical relevance – Figure 1.Selected box plots for Leadership in Energy and Environmental Design (LEED) credits and satisfaction with: (a) air quality; (b) temperature; (c) amount of light; and (d) visual comfort. The box plots provide the sizes of the independent sample groups, the mean (red diamond), the median (solid horizontal bar), the first and third quartiles, the minimum and maximum of satisfaction scores, and the results of the inferential analysis.
Note:p≤0.001 = highly significant; 0.001 <p≤0.01 = significant; 0.01 <p≤0.05 = weakly significant;p> 0.05 = not significant;
yet, only marginally–once taking into account the LEED version (Total IEQ Points*LEED Version) under which the certification was awarded (pseudo-R2= 0.04).
The same methods of analysis were also repeated for occupant satisfaction with the building, and the results are reported in Appendices D–F in the supplemental data online. Consistent with previous research on the CBE database (Frontczak et al., 2012), the findings are similar, showing strong correlations between satisfaction with the building and with the workspace.
Occupant satisfaction and rating level
The Kruskal–Wallis ANOVA and the Fligner–Killeen tests of homogeneity of variance returned high statistical significance, hence supporting the need to adopt non-parametric post-hoc tests to explore the relationships between the final levels of LEED rating achieved and sat-isfaction with the building and with the workspace. The
detailed statistical data are reported in Appendix G in the supplemental data online. The summary results of the Wilcoxon rank-sum pairwise comparisons related to sat-isfaction with the workspace are provided in Table 10 (full inferential results are presented in, Table H2, also online).
[image:11.609.63.542.67.277.2]Unexpectedly, the differences in mean (ΔM ) were mostly positive, suggesting a trend for higher satisfaction with the workspace in buildings that had received a lower certification level. However, the tests detected statistical significance only in three of six comparisons, and effect sizes were consistently not practically relevant (ρ< 0.20). This leads us to conclude that the achievement of a higher rating leveldoes nothave a substantive influ-ence on satisfaction with the workspace. The descriptive and inferential statistics related to satisfaction with the building– characterized by similar findings – are pro-vided in Appendix H1 in the supplemental data online, and the full box plots for all comparisons between final Table 8.Sample sizes based on total Leadership in Energy and Environmental Design (LEED) indoor environmental quality (IEQ) points earned.
Total LEED IEQ points 5 6 7 8 9 10 11 12 13 14 15 16
Number of buildings 4 3 12 8 9 12 9 11 9 10 5 1
Occupants’responses 165 856 1537 916 746 2357 644 1208 1679 910 207 18
Figure 2.Linear regressions for satisfaction with the workspace based on total Leadership in Energy and Environmental Design (LEED) indoor environmental quality (IEQ) points earned for: (a) the full dataset; (b) the LEED product; and (c) the LEED version.
[image:11.609.59.551.607.678.2]Note: Grey lines represent 95% confidence intervals. The regression coefficients for each LEED product are provided as supplemental data online.
Table 9.Ordinal logistic regression model fits and pseudo-R2for satisfaction with the workspace.
CBE category Data –Log-likelihood χ2 d.f. p Pseudo-R2
Satisfaction with the Workspace Intercept 699.2 0.01
Total IEQ Points 527.5 141.7 11 < 0.001
Intercept 1602.1 0.02
Total IEQ Points*LEED Product 1403.6 198.5 11 < 0.001
Intercept 1372.9 0.04
Total IEQ Points*LEED Version 1118.6 254.3 11 < 0.001
Notes: Presented are the data featured in the analysis, the–log-likelihood (i.e.a measure of the unexplained variation in the regression model), the test statistic (χ2), the degrees of freedom (d.f.), the statistical significance (p), and the pseudo-R2(i.e.the proportion of variance accounted for by the predictor variable(s) in
the model).
p≤0.001 = highly significant; 0.001 <p≤0.01 = significant; 0.01 <p≤0.05 = weakly significant;p> 0.05 = not significant; pseudo-R2< 0.04 = negligible; 0.04≤R2< 0.25 = small; 0.25≤R2< 0.64 = moderate;R2≥0.64 = large.
CBE = Center for the Built Environment.
LEED rating levels and satisfaction with the building and the workspace are reported, respectively, in Appendices I and L, also online. Since no practically relevant differ-ences in occupant satisfaction were detected when com-paring buildings with different rating levels – and considering that, in the previous analysis, the interaction terms in the ordinal logistic regression (i.e. Total IEQ Points*LEED Product and Total IEQ Points*LEED Ver-sion) did not substantively increase the prediction capa-bility of the model– no further testing was conducted also to take into account the different product and ver-sion under which buildings had achieved their final certification.
Discussion
Although the presented analysis produced results incon-sistent with the hopes and expectations that many stake-holders may have about LEED and IEQ, there are still valuable lessons that the building industry can learn from these findings. In fact, building professionals, researchers and certification bodies have long sought a better understanding of the associations between design strategies, rating criteria and workplace experience, although at times these might be outside the direct con-trol of designers and even beyond the scope of green building certification systems based primarily on design intent.
Some reflections on the challenges occurring through-out the design, construction and operation of a building that may affect its performance from the point of view of the occupants are presented below. The next subsection interprets the findings of the analysis with regard to the relevance of IEQ credits towards user satisfaction. These are followed by a discussion of potential strategies to improve workplace experience. Further reflections are then presented on the areas of development of green building rating systems that offer the potential to enhance occupant satisfaction beyond the credits cur-rently featured in the IEQ category.
[image:12.609.59.550.62.154.2]Before discussing the results, however, some caveats are provided on the limitations of the conclusions. First, even though a large sample was used, our dataset cannot be considered representative of all certified office buildings and rating systems. As noted, all 93 LEED buildings were predominantly certified by versions 2.0, 2.1 and 2.2, and the dataset was skewed towards higher rating levels. Also, the buildings featured in the CBE database administer occupant surveys on a voluntary basis, hence they do not represent a randomized sample of the entire building stock. Second, even when a specific IEQ credit was not achieved by a building, there might still have been other strategies implemented to address the corresponding environmental factor, hence‘diluting’ the difference between the buildings that did or did not obtain that IEQ credit. Third, although this discussion aims to be generalizable and transferable across rating tools, the analysis was only for LEED. Other certification systems (e.g.BREEAM, Green Mark, Green Star) might feature a different distribution of IEQ credits, and cri-teria for their achievement. Fourth, information related to the cost of construction and/or lease of buildings featured in the dataset was not consistently available, so it was not included in the analysis. As shown in the literature (Eichholtz, Kok, & Quigley, 2010, 2013), issues related to costs would be important to consider in future research as factors that could drive priorities in ‘green investment’ and, ultimately, influ-ence occupant satisfaction and expectations. Last, the CBE survey usesperceivedsatisfaction as an assessment metric, although this might not necessarily be among the explicit targets of some IEQ credits. However, although green certification systems might have differ-ent aims and objectives depending on product and project type, their general goal towards building users is ultimately to ‘support occupant comfort and well-being’ (Owens, Macken, Rohloff, & Rosenberg, 2013, p. 13). In this direction, satisfaction is an important feature of comfort, as, for example, per the definition of thermal comfort given by the American Society of Table 10.Pairwise comparisons for satisfaction with the workspace and Leadership in Energy and Environmental Design (LEED) rating.
Comparison N0 N1 M0 M1 SD0 SD1 ΔM Mdn0 Mdn1 IQR0 IQR1 ΔMdn p ρ
Certified versus Platinum 712 2142 1.51 1.38 1.31 1.38 0.12 2.00 2.00 1.00 1.00 0.00 0.055 –0.04 Certified versus Gold 712 6271 1.51 1.23 1.31 1.43 0.28 2.00 2.00 1.00 2.00 0.00 < 0.001 –0.06 Certified versus Silver 712 1456 1.51 1.45 1.31 1.27 0.05 2.00 2.00 1.00 1.00 0.00 0.163 –0.03
Silver versus Platinum 1456 2142 1.45 1.38 1.27 1.38 0.07 2.00 2.00 1.00 1.00 0.00 0.529 –0.01 Silver versus Gold 1456 6271 1.45 1.23 1.27 1.43 0.22 2.00 2.00 1.00 2.00 0.00 < 0.001 –0.06 Gold versus Platinum 6271 2142 1.23 1.38 1.43 1.38 –0.16 2.00 2.00 2.00 1.00 0.00 < 0.001 0.05 Notes: Presented are the independent groups (e.g.Certified versus Platinum) and their sizes (N0andN1), the descriptive statistics of satisfaction scores in each group (mean, standard deviation, median, interquartile range, difference in mean and median), the two-tailed statistical significance (p) for the Wilcoxon tests, and the effect size (Spearmanρ).
p≤0.001 = highly significant; 0.001 <p≤0.01 = significant; 0.01 <p≤0.05 = weakly significant;p> 0.05 = not significant;
Heating, Refrigerating and Air-Conditioning Engineers (ASHRAE): ‘the condition of mind that expresses sat-isfaction with the thermal environment and is assessed by subjective evaluation’ (ASHRAE, 2013, p. 4). Simi-larly, satisfaction is an inherent part of subjective well-being as expressed by the ‘Satisfaction with Life Scale (SWLS)’ instrument, a short five-item tool designed to measure global cognitive judgments of satisfaction with people’s lives as a whole (Diener, Emmons, Lar-sen, & Griffin, 1985).
Satisfaction and IEQ credits
In our dataset, a negligible relationship was found to exist between occupant satisfaction and the achievement of the related IEQ credits. How can these results be inter-preted and contextualized?
Design and certification versus occupancy and operation
For new constructions or renovations, the design inten-tions of a project–which are generally the basis for green certification – might be different than the operational characteristics of a building that are assessed using a sur-vey in post-occupancy evaluation. Buildings are complex and dynamic and, in the time between design and occu-pancy, many intervening factors can alter the existence, or performance, of the strategies for which the green rat-ing was awarded. This can begin durrat-ing construction, particularly if contractors were not involved in the design phase and have to manage over-complex and inflexible building systems. The operation of buildings then often requires substantial fine-tuning and adjustments over time, which are frequently cited as being among the causes for recurrent performance gaps between modelled and measured energy use (de Wilde,2014). Therefore, it would not be surprising that a similar gap might also manifest itself in occupant satisfaction with IEQ, regard-less of the specific or total number of IEQ credits achieved at the design stage.
Noting that all our surveys were administered within two years from LEED certification, these considerations might help to explain why the total number of IEQ points earned did not influence workplace satisfaction. Conversely, the positive associations between total IEQ points and satisfaction for newer versions of LEED may be a reassuring indication of the improve-ments made in certification criteria. However, although building age was not included in our analysis due to lack of verifiable information, another possible interpretation of this trend may simply be that the buildings or spaces certified under newer versions of LEED had been more recently built or renovated. In
fact, as presented inTable 2, most of the buildings in the dataset were certified by LEED for New Construc-tions (NC; 62.4%) and Commercial Interiors (CI; 23.6%), while relatively few offices were rated by LEED for Existing Buildings (EB/EBOM; 14%). In this context, research has suggested the potential pres-ence of a positive bias in IEQ satisfaction after the move into a new (or newly refurbished) office (Gou, 2016; Singh, Syal, Grady, & Korkmaz, 2010). In the short term, this might result in a favourable perception derived from the novelty and excitement about the new place of work. However, our previous work (Altomonte et al., 2017; Schiavon & Altomonte, 2014) found that the positive value of green certification from the point of view of occupant satisfaction might tend to decrease with time. In fact, in the medium and long term, IEQ satisfaction could reduce possibly also due to the higher expectations instigated by the attainment of green rat-ing (Menadue et al., 2014). Nevertheless, it should be remembered that in our analysis the LEED product under which buildings were certified (NC, CI or EB/ EBOM) was also not a good predictor of occupant satisfaction.
Finally, in terms of the lack of relationship between workplace satisfaction and rating level, it must be high-lighted that certification systems have broad scopes, and are structured under several credit categories. Build-ings could achieve a high rating in many ways, not only through compliance with IEQ criteria. This is why the comparison of occupant satisfaction with both individual and total points earned in the IEQ category was a more suitable method of analysis than considering the rating level alone.
Relevance of IEQ green certification metrics
One might question whether the current metrics used for attainment of an IEQ credit were designed to translate directly into improved user satisfaction (and into better comfort, health and wellbeing). IEQ certification metrics should focus on the occupants as much as on the build-ing, but this is not always the case. This may represent a challenge for rating systems, particularly due to the sub-stantial differences that characterize the modern work-place in terms of spatial needs (e.g. desk distribution and organization), task requirements (e.g. occupancy and working schedules), users’ personal characteristics (e.g. demographics, sex, age, socio-cultural habits), etc.
Additionally, as it has long been embraced by the disci-plines of ergonomics, product design and marketing (Abras, Maloney-Krichmar, & Preece, 2004; Noyes, 2001), metrics and criteria that merely address the demands of an average standard user might not be
suitable to capture the intrinsic inter- and intra-variabil-ity of occupants’needs.
The criteria for daylighting and views offer a good example of the weak association between green certifica-tion metrics and related occupant satisfaccertifica-tion. Rating tools have traditionally focused primarily on how to get the highest quantityof light across the floor area – measured by horizontal illuminance, an indication of light distribution and energy efficiency – rather than on thequalityof the luminous environment. To include consideration of visual comfort in the‘Daylight’credit, LEED v3 introduced the requirement for‘glare control devices to avoid high-contrast situations that could impede visual tasks’(USGBC,2009a). However, despite the fact that LEED v3 also awards a‘Views’credit‘to pro-vide building occupants a connection to the outdoors’ (USGBC,2009b), no guidance is given in terms of shad-ing operatshad-ing strategies nor the quality and contents of the views, factors that could strongly influence the mag-nitude of visual discomfort (Kent, Altomonte, Wilson, & Tregenza,2017; Tuaycharoen & Tregenza, 2005, 2007). But there has been some improvement. Under the‘ Day-light’credit in LEED v4, in fact, the climate-based metric Annual Sunlight Exposure (ASE) could now serve as an indicator for the potential occurrence of glare, although the conditions required for earning this point might still be too limited and strict for the design of comforta-ble and well daylit spaces (Reinhart,2015). In addition, the ‘Quality Views’ credit now features a detailed description of the contents of external vistas (USGBC, 2017c).
Among other rating systems, BREEAM International New Construction 2016 awards one ‘Visual Comfort’ point for glare control–to be met via building-integrated shading systems or occupant-controlled devices– along-side up to four points for daylight illuminance criteria, one for views, and one for internal and external lighting (BRE, 2016). Green Mark for New Buildings 2015 awards up to four points for effective daylighting, with one point earned for mitigation measures addressing visual discomfort (BCA,2015). Finally, points for glare reduction and the provision of external views are also included in the ‘Visual Comfort’ credit under the Green Star – Design & As Built v1.1 rating tool (GBCA,2015a).
These new criteria represent important advances, but further progress (e.g. predictive modelling for point-in-time and annual daylight glare probability (DGP) or high dynamic range (HDR) luminance mapping) would be necessary to address effectively issues of light-ing quality and visual comfort in green-certified build-ings (Altomonte, Kent, Tregenza, & Wilson, 2016; Kent, Altomonte, Tregenza, & Wilson,2016).
Surveys and IEQ satisfaction
Occupant surveys rely on subjective measures; yet, per-ception might sometimes be disjointed from actual phys-ical conditions, or a survey question about satisfaction with an IEQ parameter might be misinterpreted by a subject (Allen et al.,2015). As an example of the poten-tial dichotomy between human experience and perform-ance metrics, perceived air quality, air speed and temperature are connected and often confounded (Fang, Clausen, & Fanger,1998; Fang, Wyon, Clausen, & Fanger, 2004; Melikov & Kaczmarczyk, 2012; Schia-von, Yang, Donner, Chang, & Nazaroff,2017). The effec-tiveness of ventilation strategies might be considered by users more as a thermal comfort issue than a measure to dilute or eliminate air pollutants. In addition, over time occupants might become‘desensitized’to certain stimuli (e.g.odours) or attribute the physical impacts (e.g. head-aches, dry eyes) of an environmental exposure to causes different from their original sources (Fanger, 1988). Further, while meeting minimum air-quality standards is a prerequisite for most certification systems, there are many pollutants that may not be perceived (or be considered hazardous) by people. Ironically, these might often be due to the use of cleaning products and air fresheners that could conversely give to occupants the perception of a healthier environment (Nazaroff & Weschler,2004; Singer, Destaillats, Hodgson, & Nazar-off,2006). So, even if a particular pollutant did present potential risks for the occupants, this may not be reflected in survey responses (Spengler, Samet, & McCarthy,2001).
Reported satisfaction can also be biased by personal attitudes, and might vary depending on the time spent in the building and the role the occupant has in the office hierarchy (Bozovic-Stamenovic, Kishnani, Tan, Prasad, & Faizal, 2016). Research has also demonstrated that ‘green-branding’ can enhance pro-environmental per-ceptions (Khashe et al.,2015), and that IEQ satisfaction may be influenced by corporate concerns for energy effi-ciency (Tsushima, Tanabe, & Utsumi,2015). Lastly, it must be considered that the‘Hawthorne effect’(Franke & Kaul,1978; McCarney et al.,2007), although disputed by some (Adair,1984), has been linked to an alteration of reported perceptions resulting from the awareness of being observed – as is often the case when users are asked to respond to a workplace survey.
Control, integration and feedback
Control, adjustments and adaptation
Green-rated buildings are often designed to be more‘ cli-mate responsive’ than conventional offices, relying on passive strategies such as natural ventilation and day-lighting. As such, it is more likely that their users may be exposed to variable conditions (daily, seasonally and spatially) and be required, at reasonable frequency, to engage with personal, environmental and behavioural controls in order to attain, maintain or restore their com-fort (de Dear & Brager, 1998; Nicol & Humphreys, 1973). It has been shown that the capacity for building users to control their physical environment can signifi-cantly increase their tolerance to transient conditions of discomfort, while offering opportunities for adjust-ments and adaptation that have been positively associ-ated to higher satisfaction with IEQ and feelings of wellbeing (Arens et al., 1998; Brager, Paliaga, & de Dear, 2004; Zhang et al., 2010; Zhang, Arens, & Zhai, 2015).
Occupants should, therefore, be provided with oppor-tunities to engage with the operation of the building they inhabit, contributing to regulate their internal environ-mental conditions via openable windows, louvres, fans, shading devices, task lighting, thermostats, personal comfort systems,etc.Nevertheless, design strategies for-mulated to meet green certification criteria usually pro-mote the design of shared open-plan spaces (e.g. for cross-ventilation and light distribution), hence reducing ‘ownership’ of the perimeter and constraining user actions on envelope control systems. An additional chal-lenge of user engagement is the frequent inclination among building occupants to leave controls in one pos-ition, regardless of the continuing presence of causes of discomfort (e.g. closing shades for momentary glare, but then keeping them down all day). Therefore, it is also important that users are given effective knowledge of their possibilities of control, adjustment and adap-tation, including understanding how such strategies impact their comfort, wellbeing and task performance.
Research has strongly emphasized that occupants who have received effective training on building systems and design features, and know how to operate controls, are more likely to be satisfied with their internal environ-ment (Day & Gunderson,2015). A high level of personal control has also been associated with lower odds of sick leave in offices (Bodin Danielsson, Singh Chungkham, Wulff, & Westerlund,2014) and has been linked to sub-stantial opportunities for enriched comfort and pleasure, and better energy performance (Brager, Zhang, & Arens, 2015).
For controls to be most effective, enhanced commis-sioning and handover criteria, including targeted guides and training for occupants and building/facility
managers, are gradually gaining relevance among green building certification systems. In this context, as an example, the Soft Landings framework in the UK aims to ensure that feedback and follow-through can become natural parts of the delivery of a project (Bordass & Lea-man,2005; Way & Bordass,2005). However, in the con-ditions for attainment of green certification, such practices are often featured only as prerequisites for the highest rating levels (e.g. for BREEAM and Green Mark), or are uniquely offered as additional credits. Further development might be beneficial in this area.
Design innovation and integration
Just as for low energy performance, good IEQ can be facilitated by building design and operational strategies that work alongside each other. This necessitates collab-oration between various building professionals in an integrated process starting from the early design stages. This is currently supported by points awarded by LEED, BREEAM, Green Star and Green Mark for inno-vations that go beyond standard performance, for the involvement of accredited professionals, and for the adoption of a collaborative design framework‘to achieve synergies across disciplines and building systems’ (USGBC,2013a).
Towards more effective integration, a further step could be represented by‘multi-level’credits,e.g. reward-ing synergies that allow buildreward-ings to meet certification criteria across different rating categories (Ma & Cheng, 2016). Green certification systems, however, still tend to treat each IEQ credit independently. In this context, balancing air quality, thermal, lighting and visual per-formance with a satisfactory acoustic environment often represents a particular challenge. As emphasized by our previous research on the CBE database, in fact, satisfaction with noise and sound privacy is frequently characterized by low and negative scores, especially in green-certified offices (Altomonte & Schiavon, 2013; Frontczak et al., 2012; Schiavon & Altomonte, 2014). Yet, this is not entirely surprising considering that LEED has only recently introduced a credit on‘Acoustic Performance’in its v4 (USGBC,2013b). This is a step in the right direction for LEED, particularly seeing that other rating systems have for long featured credits for acoustic quality. In BREEAM, the appointment of a qua-lified acoustician at early design stage is a prerequisite for certification, and up to four points are awarded for meet-ing criteria of indoor ambient noise, sound insulation and reverberation time (BRE, 2016). For Green Mark, the achievement of a credit on‘Sound Level’ according to the building function is also a precondition for certi-fication, while the ‘Acoustics’ category rewards sound transmission reduction, reverberation design and/or
aural comfort (BCA, 2015). Green Star awards up to three points for internal noise levels, reverberation time and acoustic separation (GBCA,2015a).
Research has also revealed a strong association between workplace satisfaction, noise, sound privacy and spatial layout, highlighting the challenge to find suit-able compromises between dynamic changes in work organization, fit-out of spaces, ergonomics, proxemics and current trends in office design (Frontczak & War-gocki,2011; Kim, Candido, Thomas, & De Dear, 2016; Leder et al.,2016; Sakellaris et al.,2016). Open-plan lay-outs have been commonly assumed to enhance com-munication and promote teamwork effectiveness (Heerwagen, Kampschroer, Powell, & Loftness, 2004). However, open spaces have also been recognized to be potentially more disruptive, such that the benefits of greater interaction might fail to offset the penalties of increased noise and decreased feelings of privacy (Kim & De Dear,2013; Schiavon & Altomonte,2014).
Monitoring and feedback
The effectiveness of any design strategy towards enhanced satisfaction requires continuous monitoring of building performance and collection of comprehen-sive occupant feedback. By fine-tuning operating strat-egies, this can help bridge the gap between design intent and user satisfaction throughout the lifetime of a building. Appraisal of occupants’views might also enable them to feel actively involved in the management of their place of work, with a likely increase in satisfaction simply due to the awareness that their concerns are being lis-tened to. This implies a need to adopt systematic methods for handling and following up complaints, clos-ing the feedback loop by reportclos-ing solutions back to the users (Brown & Arens, 2012). In addition, including designers in performance monitoring might facilitate the transfer of the collected experience to improved industry standards.
Various diagnostic tools can be used to evaluate build-ings from the perspective of their occupants, including consideration of physical, psychological, social and experiential categories (e.g.spatial territories, aesthetics) (Mansour & Radford, 2016), as well as methods for benchmarking workplace effectiveness (Leesman, 2017). However, even if surveys are key techniques to obtain this information in a rapid, responsive and inex-pensive fashion, they might not provide full contextual information about the building or the workspace nor offer the opportunity for continuous data collection. Ide-ally, they should be part of broader and interdisciplinary measurement protocols that exhaustively capture the functioning of a building (ASHRAE, 2012). Among available tools, the Building Use Studies (BUS) method
has been developed over the last 30 years for benchmark-ing occupant satisfaction in buildbenchmark-ings (Arup,2017). The CBE Occupant IEQ survey used in this study is part of the CBE’s‘Livable Analytics’ methodology, with several additional questions aimed at gathering building-level information for actionable improvements (CBE,2017). A holistic approach to building performance evaluation, collecting objective and subjective data, was also recently launched in Australia (Candido, Kim, de Dear, & Tho-mas,2016): the Building Occupants Survey System Aus-tralia (BOSSA).
Rating systems should reward ongoing performance monitoring and occupant feedback to guarantee that, fol-lowing certification, the building continues to operate based on design intentions. This is beginning to occur. LEED NC v2009 included an IEQ credit – ‘Thermal Comfort–Verification’ –requiring a survey to be con-ducted within 6–18 months after occupancy, while LEED BD + C v4 now features this criterion as an Inno-vation credit. LEED O + M v4 also awards one point for ‘Occupant Comfort Survey’, requiring at least one survey to be administered every two years (USGBC, 2017c). Among other rating tools, BREEAM awards one point for the commitment to conduct a post-occupancy evalu-ation one year after occupevalu-ation and disseminate its find-ings (BRE, 2016). Green Mark awards 0.5 points for administering a survey within 12 months of operation; meeting this credit is a prerequisite for achieving the highest rating levels (BCA, 2015). Green Star also rewards pre- and post-occupancy evaluation through an ‘Innovation Challenge’ credit based on the use of BOSSA (GBCA,2015a). In addition, the USGBC admin-isters the LEED Dynamic Plaque scheme, a building per-formance monitoring and scoring platform based on continuous benchmarking that provides annual LEED recertification over time (USGBC,2016).
IEQ beyond IEQ credits
Occupant satisfaction, in fact, needs to be considered as a comprehensive design objective that is not only affected, directly and indirectly, by the conventional IEQ parameters of heat, light, sound and air quality, but also is driven by complex physio-psychological dimensions pertaining to personal health and wellbeing. In this context, new and emerging rating systems–such as the WELL building stan-dard (Delos,2015)–are focusing specifically on the multi-layered and interdependent interactions between the built environment and the various systems of the human body, translating interdisciplinary research into health-based building design strategies (IWBI,2017).
There is no ‘silver bullet’ for creating a satisfactory and healthy work environment. Given the dynamic nature of buildings, the complexity of their users, the diverse and evolving demands of the workplace, and the need for these factors to be effectively monitored and analysed, there are still many challenges that the green building industry needs to tackle in order to pro-mote indoor environmental qualities conducive to satis-faction, health and wellbeing. However, if sustained by advancements in research and design practice, rating tools can offer significant opportunities towards better, more comfortable, higher performing and healthier green-certified buildings.
Conclusions
Based on the analysis of a dataset featuring 11,243 responses from 93 LEED-rated buildings:
. the achievement of a specific IEQ credit did not sub-stantively affect occupant satisfaction with related characteristics of the indoor working environment
. the total number of IEQ points earned did not influ-ence workplace satisfaction, independent of the pro-duct under which certification was awarded
. occupant satisfaction with the building and workspace was not affected by the rating level achieved
From these conclusions, this study leads to the following recommendations.
For designers and building managers:
. there are many things that can change between the design of a project and the post-occupancy evaluation requiring the direct involvement of building pro-fessionals in performance monitoring to fine-tune operating strategies and transfer best practice to the building industry
. collaboration between building professionals from the early design stages can support innovation and the formulation of integrated strategies
. personal control can provide significant opportunities for enriched comfort, energy performance and enhanced satisfaction with the indoor environment
For building scientists and researchers:
. surveys rely on subjective measures and are best used if supported by physical data collection and in-person interviews to appraise building performance holistically
. reported satisfaction might be driven by factors other than IEQ parameters, such as the time spent in the workspace, attitudes, expectations, workplace culture, misinterpretations,etc.
. new interdisciplinary areas of research and develop-ment should address how we can enhance satisfaction, health and wellbeing beyond typical rating tools’ criteria
For green building certification systems:
. the metrics for attaining IEQ credits need to better represent reliable indicators of user satisfaction
. IEQ metrics and criteria need to consider the substan-tial differences – demographic, physiological, socio-cultural, etc. – that characterize building occupants, rather than solely responding to the needs and expec-tations of an average standard user
. credits should address user training on building oper-ating strategies, which can increase satisfaction and foster adjustments and adaptive behaviours
. rating systems should encourage continuous building performance monitoring and offer opportunities for recertification over time
Acknowledgements
The authors thank Mark Mendell and Chris Pyke for their revision of the manuscript, and Kristine Walker for her contri-bution to this study as part of her Master of Science thesis at UC Berkeley, under the supervision of Stefano Schiavon and Gail Brager. The authors also gratefully acknowledge the sup-port of Giusi Di Giorgio, University of Nottingham, for the review of the literature.
Disclosure statement
No potential conflict of interest was reported by the authors.
Funding
This work was supported by the Engineering and Physical Sciences Research Council [grant number EP/N50970X/1]; the University of Nottingham [International Collaboration Fund] and the Industrial Partners of the Center for the Built Environment.