SDSS-IV MaNGA-resolved Star Formation and Molecular Gas Properties of Green
Valley Galaxies: A First Look with ALMA and MaNGA
Lihwai Lin1 , Francesco Belfiore2,3,4, Hsi-An Pan1 , M. S. Bothwell2,3, Pei-Ying Hsieh1 , Shan Huang5 , Ting Xiao6, Sebastián F. Sánchez7, Bau-Ching Hsieh1 , Karen Masters8 , S. Ramya6, Jing-Hua Lin1,9, Chin-Hao Hsu1,9, Cheng Li10, Roberto Maiolino2,3, Kevin Bundy4 , Dmitry Bizyaev11,12 , Niv Drory13 , Héctor Ibarra-Medel7 , Ivan Lacerna14,15,16 ,
Tim Haines17 , Rebecca Smethurst18, David V. Stark19 , and Daniel Thomas8
1Institute of Astronomy & Astrophysics, Academia Sinica, Taipei 10617, Taiwan;lihwailin@asiaa.sinica.edu.tw 2
Cavendish Laboratory, University of Cambridge, 19 J. J. Thomson Avenue, Cambridge CB3 0HE, UK
3
University of Cambridge, Kavli Institute for Cosmology, Cambridge, CB3 0HE, UK
4
UCO/Lick Observatory, University of California, Santa Cruz, 1156 High Street, Santa Cruz, CA 95064, USA
5
Center for Cosmology and Particle Physics, New York University, New York, NY 10003, USA
6
Shanghai Astronomical Observatory, Chinese Academy of Science, 80 Nandan Road, Shanghai 200030, China
7
Instituto de Astronomía, Universidad Nacional Autonóma de Mexico, A.P. 70-264, 04510, México, D.F., México
8
Institute of Cosmology & Gravitation, University of Portsmouth, Dennis Sciama Building, Portsmouth, PO1 3FX, UK
9
Department of Physics, National Taiwan University, 10617, Taipei, Taiwan
10
Tsinghua Center of Astrophysics & Department of Physics, Tsinghua University, Beijing 100084, China
11
Apache Point Observatory and New Mexico State University, P.O. Box 59, Sunspot, NM, 88349-0059, USA
12Sternberg Astronomical Institute, Moscow State University, Moscow, Russia 13
McDonald Observatory, University of Texas at Austin, 1 University Station, Austin, TX 78712-0259, USA
14
Instituto Milenio de Astrofísica, Av. Vicuña Mackenna 4860, Macul, Santiago, Chile
15
Instituto de Astrofísica, Pontificia Universidad Católica de Chile, Av. Vicuna Mackenna 4860, 782-0436 Macul, Santiago, Chile
16
Astrophysical Research Consortium, Physics/Astronomy Building, Rm. C319, 3910 15th Avenue NE, Seattle, WA 98195, USA
17
Department of Astronomy, University of Wisconsin-Madison, 475N. Charter Street, Madison WI 53703, USA
18
School of Physics and Astronomy, University of Nottingham, University Park, Nottingham, NG7 2RD, UK
19
Kavli Institute for the Physics and Mathematics of the Universe(WPI), The University of Tokyo Institutes for Advanced Study, The University of Tokyo, Kashiwa, Chiba 277-8583, Japan
Received 2017 May 3; revised 2017 October 17; accepted 2017 October 19; published 2017 December 6
Abstract
We study the role of cold gas in quenching star formation in the green valley by analyzing ALMA12CO(1–0) observations of three galaxies with resolved optical spectroscopy from the MaNGA survey. We present resolution-matched maps of the star formation rate and molecular gas mass. These data are used to calculate the star formation efficiency(SFE)and gas fraction(fgas)for these galaxies separately in the central“bulge”regions and outer disks. Wefind that, for the two galaxies whose global specific star formation rate(sSFR)deviates most from the star formation main sequence, the gas fraction in the bulges is significantly lower than that in their disks, supporting an “inside-out”model of galaxy quenching. For the two galaxies where SFE can be reliably determined in the central regions, the bulges and disks share similar SFEs. This suggests that a decline in fgasis the main driver of lowered sSFR in bulges compared to disks in green valley galaxies. Within the disks, there exist common correlations between the sSFR and SFE and between sSFR and fgason kiloparsec scales—the local SFE or fgasin the disks declines with local sSFR. Our results support a picture in which the sSFR in bulges is primarily controlled by fgas, whereas both SFE and fgasplay a role in lowering the sSFR in disks. A larger sample is required to confirm if the trend established in this work is representative of the green valley as a whole.
Key words:Galaxies: evolution
1. Introduction
It has been known for more than a decade that the distributions of galaxy properties are bimodal in either the color–magnitude diagram (CMD) or the relation between the star formation rate (SFR) and stellar mass (Blanton et al. 2003; Kauffmann et al.2003; Baldry et al.2004). Galaxies in between the blue cloud and the red sequence, the so-called
“green valley”galaxies (see Salim 2014 for a review on this topic), are often thought to be in transition from the star-forming phase to the quiescent phase(Bell et al. 2004; Faber et al. 2007; Martin et al. 2007). Under this framework, the scarce density of green valley galaxies implies that either the fraction of star-forming galaxies undergoing star formation quenching is low or the quenching process is fast enough so that the life time in the green valley phase is short. Properties of
these green valley galaxies thus carry important information on how the star formation is quenched.
A study carried out by Schawinski et al.(2014) has shown that the color-selected transitional galaxies are dominated by galaxies with late-type (disk) morphology with a slowly declining star formation history, rather than morphologically early-type (elliptical) galaxies of which the star formation is shut down abruptly(also see Smethurst et al.2015). However, it remains unclear what physical mechanism plays the dominant role in suppressing the star formation of galaxies and produces these two types of green valley galaxies. Furthermore, the underlying star formation history of green valley galaxies can be even more complicated if galaxies are rejuvenated by accreting fresh gas through minor mergers
(Haines et al.2015; Lacerna et al.2016).
A variety of scenarios have been proposed to explain the shutdown of star formation in galaxies, usually split into so-called “nature” processes—referring to the consequences of internal evolution of galaxies, and “nurture,”or the impact of the environment a galaxy lives in. If “nature” processes dominate, galaxies would be expected to grow, evolve, and die inside-out(White & Frenk1991; Mo et al.1998). Recent IFU observations demonstrate that many nearby spiral galaxies show negative gradients in stellar ages and metallicities, supporting this inside-out picture (González Delgado et al. 2014; Sánchez-Blázquez et al. 2014; Li et al. 2015; Belfiore et al. 2017; Goddard et al. 2017). On the other hand, if
“nurture”dominates galaxy evolution, external processes such as ram-pressure stripping (Gunn & Gott 1972), high speed galaxy encounters(Moore et al.1996), galaxy mergers(Mihos & Hernquist 1994), and “strangulation” (Larson et al. 1980; Balogh et al. 2000; Peng et al. 2015) are responsible for quenching. In this picture, star formation quenching is likely to occur globally or in the outer regions of galaxiesfirst due to the lack of continuous supply for the cold gas reservoir.
Previous works in the area of green valley galaxies faced two main limitations. First, earlier optical studies on transitional galaxies largely rely on the single-fiber SDSS spectroscopy, which lacks spatial information and covers only the central part of nearby galaxies. Second, although the star formation histories (including recent and on-going SFR)of galaxies can be inferred from UV, optical, to infrared data based on the broadband SEDs (spectral energy distributions) and spectral lines, a complete picture of the galaxy evolution processes requires an understanding of the cold molecular gas, which serves as the fuel of star formation. In this work, we present the ALMA CO observations of three green valley galaxies selected from the SDSS-IV Mapping Nearby Galaxies at Apache Point Observatory (MaNGA; Bundy et al. 2015; Law et al. 2016; Yan et al. 2016a, 2016b). The focuses of this work are to characterize the role of cold molecular gas in the star formation quenching and to probe the sequence of quenching among substructures of galaxies(e.g., bulge versus disk)by combining spatially resolved observations of the stellar population and molecular gas. Specifically, we will address whether the declining star formation activity is caused by a depletion of gas or by a suppression of star-forming efficiency in different galactic regions.
Throughout this paper, we adopt the following cosmology:
H0=100hkm s-1Mpc−1,W =m 0.3, andW =L 0.7. We use
a Salpeter IMF and adopt the Hubble constant h=0.7. All magnitudes are given in the AB system.
2. Data
2.1. MaNGA Targets
MaNGA is an on-going integral field unit(IFU)survey on the SDSS 2.5 m telescope (Gunn et al. 2006), as part of the SDSS-IV survey (SDSS Collaboration et al. 2016; Blanton et al.2017). MaNGA makes use of a modification of the BOSS spectrographs(Smee et al.2013)to bundlefibers into hexagons
(Drory et al.2015). Each spectra has a wavelength coverage of 3500–10,000Å, and instrumental resolution∼60 km s−1. After dithering, MaNGA data have an effective spatial resolution of 2 5(FWHM; Law et al.2015), and data cubes are gridded with 0 5 spaxels.
We make use of the Pipe3D pipeline(Sánchez et al.2016a) to model the stellar continuum with 156 templates with 39 ages and 4 stellar populations that were extracted from a combina-tion of the synthetic stellar spectra from the GRANADA library
(Martins et al. 2005) and the MILES project ( Sánchez-Blázquez et al. 2006; Vazdekis et al. 2010; Falcón-Barroso et al. 2011). Details of the fitting procedures are described in Sánchez et al. (2016b). In short, a spatial binning is first performed in order to reach an S/N of 50 accross the entire field of view(FoV)for each datacube. A stellar populationfit of the coadded spectra within each spatial bin is then computed. The stellar population model for spaxels with continuum S/N>3 is then estimated by rescaling the bestfitted model within each spatial bin to the continuum flux intensity in the corresponding spaxel, following Cid Fernandes et al. (2013) and Sánchez et al. (2016a). The stellar mass surface density
(S*) is then obtained using the stellar mass derived for each spaxel and then normalized to the physical area of one spaxel. We derive the emission line fluxes following the same procedure described in Belfiore et al.(2016). Briefly speaking, the fittings are performed on continuum subtracted spectra using sets of Gaussians(one per line)with a common velocity. The dust attenuation is corrected by using the Balmer decrement, adopting the Calzetti(2001)attenuation curve with
Rv=4.05 and a theoretical value for the Balmer line ratio
(Hα/Hβ=2.86) taken from Osterbrock & Ferland (2006), assuming case B recombination. SFR is then estimated based on this extinction corrected Hαflux using the conversion given by Kennicutt (1998a) with the Salpeter IMF. Similarly, we convert the spaxel-based SFR into the SFR surface density
(SSFR) by normalizing it to the spaxel area. At at fixed
extinction curve and IMF, the uncertainty in the SFR estimate is proportional to that of the Hαflux and is less than 33% given that we only limit to our analysis to spaxels with S/N(Hα)>3.
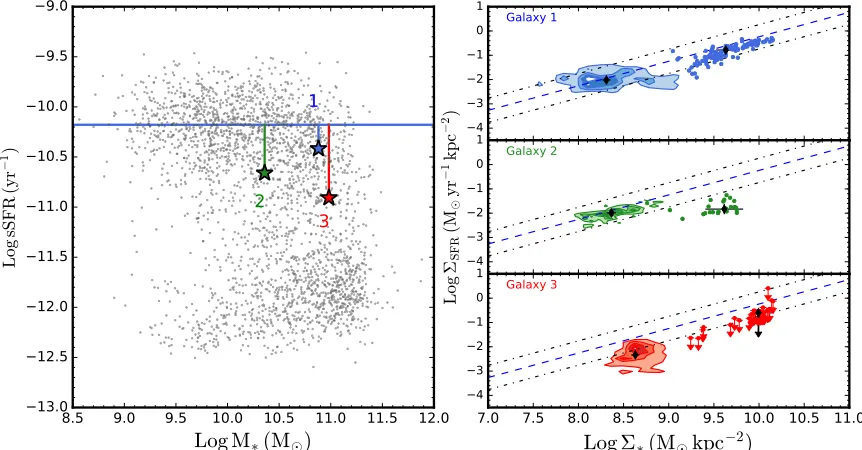
We show in the left panel of Figure1, the locations of the sSFR, defined as the SFR divided by the stellar mass (M*), versus M*for 2730 MaNGA galaxies (black dots), from an internal release (labeled MPL5), very closely equivalent to Data release 13 (SDSS Collaboration et al. 2016), by integrating the Pipe3D results from individual MaNGA spaxels. The three green valley targets (MaNGA 1-596678, 1-114956, and 1-596598) for the ALMA follow-up, high-lighted by the color-coded stars, were drawn from thefirst 118 galaxies observed by MaNGA at the time when the ALMA proposal was prepared. They are randomly selected to be massive galaxies that lie below the star-forming main-sequence relation with different separations from the main sequence,
redshift relation given in Equation(13)of Elbaz et al.(2011). We also require the targets to be accessible by ALMA and we do not impose the constraint on the predicted CO abundance when selecting the targets. We number them 1 to 3 (hereafter Galaxy 1, Galaxy 2, and Galaxy 3)according to theirΔsSFR
(see Table1). Although Galaxy 1 lies close to the lower edge of
the star-forming main sequence on the global sSFR
—M*plane, all three galaxies are referred to as“green valley galaxies”loosely in this work.
These three objects were recently observed as part of the HI-MaNGA program at the Robert C. Byrd Green Bank Telescope (GBT), which is obtaining HI 21 cm observations
of a large sample of MaNGA galaxies (AGBT17A_012, PI: K. Masters). Galaxies 1 and 2 have HI gas fractions comparable to that of the normal HI galaxies, while Galaxy 3 is below the ALFALFA scaling relation(see Figure2(c)of Huang et al.2012). In addition, Galaxy 1 and Galaxy 2 were also observed in CO(2–1)with JCMT(PI: Ting Xiao)and CO
[image:3.612.90.521.53.278.2](1–0) with IRAM (Saintonge et al. 2012), respectively, from which the total H2 mass can be derived. The beam size of JCMT is 22″and is 32 5 for IRAM. The general properties of the three green valley galaxies are summarized in Table1. We assume the CO(2–1) to CO(1–0) ratio to be 0.7 when calculating the total H2mass of Galaxy 1.
Figure 1.Left panels: the positions of the three green valley galaxies on the global sSFR vs. stellar mass plane derived from the Pipe3D analysis of MaNGA data.
Each MaNGA MPL5 galaxy is shown as a black dot. The large stars show the 3 green valley galaxies: Galaxy 1(blue), Galaxy 2(green), and Galaxy 3(red). The horizontal line represents a constant log(sSFR/yr−1)=−10.18, denoting the typical value of the star-forming population. Right panels: the resolved SFR surface density vs. stellar mass surface density of the three green valley galaxies(from top to bottom: galaxy 1, Galaxy 2, and Galaxy 3). MaNGA 0 5 spaxels belonging to the bulges are shown as solid circles(note that these are not all independent data point as the effective resolution of MaNGA is 2 5)while the contours show the distributions of the spaxels in the disks. The black diamond symbols denote the median values for both disk and bulge components. The blue dashed line represents the best-fit of the resolved relation for the main-sequence galaxies(Hsieh et al.2017), corresponding to sSFR=10-10.33yr−1, while the upper and lower dotted–dashed lines show sSFR=10-9.83and10-10.83yr−1
[image:3.612.40.575.401.501.2], respectively. SFR for the bulge of Galaxy 3 are shown as upper limits due to possible AGN contaminations.
Table 1
Properties of the Three MaNGA Galaxies
ID MaNGA ID R.A. Decl. Redshift log(M/M) log
(
M -)
SFR
yr 1 ΔsSFR log(MH2/M) log(MHI/M) log
( )
SFE -yr 1b (Dra)
1 1-596678 332.89284 11.79593 0.02695 10.88 0.46 −0.24 9.47c 10.21 −9.0
(114.7 Mpc)
2 1-114956 332.79873 11.80073 0.02702 10.36 −0.3 −0.48 8.98d 9.87 −9.2
(115.0 Mpc)
3 1-596598 331.12290 12.44263 0.02659 10.98 0.075 −0.73 L 9.7e L
(113.2 Mpc)
Notes.
a
Comoving radial distance.
b
The global SFE estimated based in the single-dish CO measurements.
c
Data taken with JCMT by Ting Xiao et al.
d
Data taken from Saintonge et al.(2012).
e
Galaxy 1 is in the edge of the GBT beam(5.5′away)of Galaxy 3 and both galaxies are at very similar redshifts, so the HIcan be attenuatedflux from the HIlinked to that in the edges of the beam. If there is no HIdetected linked to Galaxy 3, the upper limit(assuming a width of 400 km s−1)would belog(MHI/
2.2. ALMA Observations
Molecular gas observations in 12CO(1–0)were carried out with ALMA in Cycle 3 on 2016 January using the Band 3 receiver (project code: 2015.1.01225.S; PI: Lihwai Lin). The baseline ranges from 15 to 310 meters. The largest structure that we expect to be sensitive to is about 36″(∼20 kpc). Thus, the missingflux should be negligible. Uranus was observed as the flux calibrator for Galaxy 2, and Neptune was used for Galaxy 1 and Galaxy 3. The phase and bandpass of the observations of Galaxy 1 and Galaxy 2 were calibrated with J2232+1143 and J2222+1213 , respectively, and J2200+1030 and J2148+0657 for Galaxy 3. The on-source time is∼1 hr for each galaxy.
Our spectral setup includes one line targeting 12CO (1–0). The window has a bandwidth of 0.937 GHz (2500 km s−1), with a channel width of 3906.250 kHz(10.1 km s−1). The data were processed by pipeline(version r35932 and r36660)in the
Common Astronomy Software Applications package(CASA, version 4.5.1 r35996 and 4.5.3 r36115).
The task CLEAN was employed for deconvolution with a robust=0.5 weighting (Briggs). We adopted a user-specified image center, pixel size, and restoring beamsize to match the image grid and the spatial resolution of the MaNGA images during the CLEAN process. The user-specified image center is ∼0 1 away from the original center in the ALMA observa-tions. We adopt a geometric mean beamsize of the user-specified beam, 2 5×2 5(∼1.4×1.4 kpc), similar to that of the native beamsize reported by the CLEAN(2 6×2 2). We have confirmed that all results remain unchanged if we instead use the original image center and restoring beamsize. Sensitivities of the three observations are almost identical. Thefinal cubes have channel widths of 10.1 km s−1and rms noise (srms) of ∼0.5 mJy beam−1. Integrated intensity maps
were created from the cubes with a clip in noise of 1.5-srms.
[image:4.612.46.568.54.480.2]Varying the clipping threshold from 2σ to 1.3σ results in a
Figure 2.Maps of various quantities for the three green valley galaxies(from top to bottom: Galaxy 1, Galaxy 2, and Galaxy 3). Thefirst column shows the SDSSgri
composite images with the MaNGA hexagon overlaid in pink. The second column displaysSSFRbased on the MaNGA Hαobservations. TheSSFRin the central
region of Galaxy 3 must be interpreted as an upper limit because its Hαemission is likely contaminated by AGN contributions. The third column shows theH2mass
surface density map based on ALMA CO(1–0)observations. The fourth and last columns show the distributions of SFE andfgas, respectively. In the second tofifth
change of the COflux from−15% to+10% with respect to the case using 1.5σ. Since the ALMA observations have larger fields of view than MaNGA, the edge of ALMA maps were cut off to match the image size of MaNGA. The H2mass surface density (SH2) is computed from the CO surface density by adopting a conversion factor(aCO)of 4.3M(K km s−1pc2)−1
(e.g., Bolatto et al.2013).
We can compare the total COflux and/or H2mass obtained by integrating the ALMA results with those based on single-dish observations for two of our targets. Wefind that the total ALMA CO(1–0)flux for Galaxy 1 is in good agreement with that derived from the JCMT CO(2–1)observation if adopting a conventional CO(2–1)/CO(1–0) ratio=0.7. For Galaxy 2, which is part of the COLD GASS sample, its ALMA-integrated H2 mass is a factor of 1.9 lower than the value listed in the COLD GASS catalog when applying the same aCO. We
suspect that this discrepancy may be related to the method of aperture correction used in the COLD GASS estimation for this object.
3. Results
To separate the bulge and disk regions in our data, we perform the two-componentfitting usingGALFIT(Peng et al. 2002,2010)in the SDSSr-band images. For the bulge and disk components, we fix the Sérsic index to be n=4 and
n=1, respectively, when fitting other parameters. The effective radii (Re)are determined to be 2 77, 0 7, and 1 23 for Galaxies 1, 2, and 3, respectively. Once we obtainReof the
bulge, we compute the observed effective radius (Reobs) by
convolving it with the PSF size of both MaNGA and ALMA beams (∼2 5). We define the“bulge”region to ber<Reobs, and in order to mitigate contamination from any overlap region, we define the“disk”region to ber>2´Reobs. These regions are indicated by white circles in Figure 2.
3.1. ResolvedSSFRversusS*Relation
Recently, it has been found that kiloparsec-scaleSSFRtraces
well with the underlyingS*for star-forming galaxies(Sánchez et al. 2013; Cano-Díaz et al. 2016; Abdurróuf & Akiyama 2017; Hsieh et al. 2017). This relation may be responsible for the observed tight correlation between the global SFR andM*. In the right panel of Figure 1, we show the kiloparsec-scale
SSFRversus S*relation for the three green valley galaxies.
The data points from the bulge and disk regions are shown in solid circles and contours, respectively. The dotted line represents the best-fit of the resolved main-sequence relation obtained for the MaNGA star-forming population(Hsieh et al.
2017): log
-
(
M)
SFRyr1 =−10.33+log *
( )
MM . For Galaxy 1, the disk almost lies on the resolved main sequence, while the bulge is only slightly below the line. On the other hand, the bulge of Galaxy 2 shows significant departure from the resolved main sequence. We note that the central Hαemission of Galaxy 3 is dominated by broad emission lines associated with an AGN, and therefore theSSFRfrom Hαis an upper limit in the central
part of this galaxy. In spite of this, it is clear that both the bulge and disk regions of Galaxy 3 are systematically below the resolved main-sequence relation. There is also a trend that the disk sSFR declines from Galaxy 1 to Galaxy 3, following a similar behavior of the global sSFR. Assuming galaxies evolve with declining sSFR, our results would indicate that the sSFR
in the bulge departs from the resolved main sequence first, followed by the disk as the global sSFR decreases.20
3.2. Gas Fraction, Star Formation Efficieny, and Specific Star Formation Rate
Figure2shows the optical image,SSFR,SH2, star formation efficiency (SFE; defined as SFR/MH2), and the gas fraction
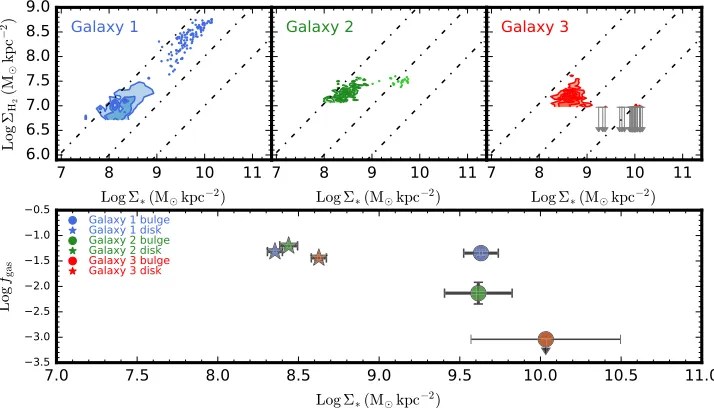
(fgas; defined as SH2/(S*+SH2)) for the three green valley galaxies. We can see that the spatial distributions of these quantities are diverse among the three galaxies. For example, both SSFRand SH2peak in the central part of Galaxy 1, whereasSH2is more evenly distributed in Galaxy 2 and greater in the outskirts in Galaxy 3. Interestingly, all three galaxies show increasing fgaswith radius. We note that MaNGA achieves nearly uniform sensitivity across its IFU bundles, which is sufficient to detect the continuum at high S/N in the outskirts of these objects. The observed increases in gas fraction is, therefore, not driven by low S/N in the outskirts of galaxies. To quantify these differences, we next compare the relations among various quantities. The upper panels of Figure 3 show the SH2versus S*relation. For Galaxy 1,
SH2scales with S*for both bulge and disk regions. On the other hand, for Galaxies 2 and 3,SH2is quite uniform across the bulges, despite the fact that theSH2correlates withS*in disks. The lower panel shows the median gas fraction as a function of S*in bulges (circles) and disks (stars). The gas fraction in the bulges varies significantly among the three galaxies by 1.6 dex, being lower toward the Galaxy 3. On the other hand, the gas fractions in disks are comparable in the three cases, although slightly lower in Galaxy 3. Except for Galaxy 1, fgasin the bulges is significantly lower than in the disks for the other two galaxies.
Next, we explore the relation between the SFR surface density and the gas surface density, the so-called “ Kennicutt-Schmidt” relation (Kennicutt 1998a), shown in the upper panels of Figure 4. Only spaxels with S/N (CO) > 2 are displayed. The SFE versusS*is shown in the lower panel.21 Except for Galaxy 3 for which the central Hαemission is contaminated by the broad-line region associated with the AGN, the SFEs of the other two bulges are at a similar level and are moderately lower compared to their corresponding disks. Similarly, the disk regions show a wider spread in the resolved SFE. Even though the SFEs are similar in some regions among the three galaxies, their median values system-atically decline from Galaxies 1 to 3 by a factor of 3. Since two of our targets also have single-dish CO observations, we can compare the resolved SFE with the global SFE measurements as listed in Table1. The global SFE is in good agreement with the resolved SFE for Galaxy 1. On the other hand, the global SFE is close to the lower end of the resolved SFE distribution for Galaxy 2. We note that the later is caused by the factor of 1.9 excess in the total CO(1–0)flux estimated by the COLD GASS single-dish measurement compared to the integrated ALMAflux(see Section2.2).
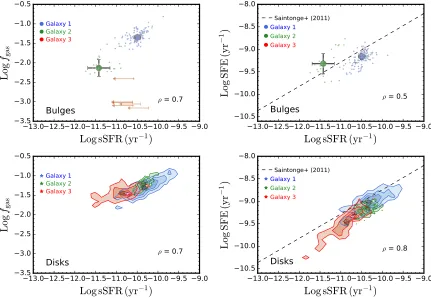
To address the relative importance in controlling the sSFR between gas fraction and SFE, we plot fgasand SFE against sSFR and compute the Spearman’s correlation coefficientρas
20
It is not necessarily true that these three galaxies form an evolutionary sequence, in particular, because Galaxy 2 is less massive than the other two. In addition, the sSFR of galaxies may not monotonically decline with time as the SFR can be reignited by various processes during the life time of galaxies.
21
shown in Figure 5. The data points associated with the bulge regions in Galaxy 3 are excluded in this analysis given that we cannot measure the SFR directly due to the AGN contamina-tion. For bulges, the relation between fgasan sSFR is stronger than that between SFE and sSFR as indicated by theρvalues, suggesting that the sSFR of bulges is mainly controlled by fgas. On the other hand, it is observed that both local fgasand SFE correlate with local sSFR in disks, and the local relations are common among the three disks. For comparison, we also plot the global SFE versus sSFR relations of the COLD GASS sample for galaxies with secure CO detections(Saintonge et al.
2011) in Figure 5 after correcting for the differences in the adopted IMF andaCO. Our data points in the disk regions are
[image:6.612.127.484.53.257.2]systematically below the best-fit lines of the COLD GASS sample. This discrepancy may come from the fact that these two samples are averaged over different physical scales. The spatially resolved observations tend to sample CO bright regions, resulting in lower SFE than the global averages. An alternative explanation is that green valley galaxies may form a different correlation from the main sequence. Observations covering a wider range of galaxy populations are needed to conclude whether the observed SFE versus sSFR relation is universal. Figure 3.Top panels: the gas surface density vs. the stellar mass surface density relation for Galaxy 1, Galaxy 2, and Galaxy 3(from left to right). Spaxels belonging to the bulges are shown as small dots, while the contours show the distributions of the spaxels in the disks. The sharp boundary inSH2corresponds to the S/N=2 cutoff in the COflux density. The gray arrows denote bulge spaxels falling below the detection limit. The three dashed–dotted lines correspond to constant gas fractions of 0.1, 0.01, and 0.001(from top to bottom). Bottom panel: the gas fraction as a function of the stellar mass surface density. The median values for the bulges and disks are shown as circles and stars, respectively. The symbols are color-coded to represent different galaxies(blue: Galaxy 1; green: Galaxy 2; red: Galaxy 3). The error bars denote the uncertainties in the median values, calculated as the standard deviation normalized by the square root of the number of independent spaxels. In some cases, the error bars are smaller than the size of the symbols and hence are invisible from the plots.
Figure 4.Top panels: the relation between the SFR surface density and the gas surface density for Galaxy 1, Galaxy 2, and Galaxy 3(from left to right). The dashed
line corresponds to a constant SFE of10-9.1yr−1
, the averaged result from the HERACLES sample(Leroy et al.2008), while the upper and lower dotted–dashed lines correspond to constant gas fractions of10-8.6and10-9.6yr−1
, respectively. Bottom panel: the star formation efficiency as a function of stellar mass surface density. The dashed line shows a constant SFE of10-9.1yr−1
[image:6.612.130.484.351.551.2]4. Discussion
The above analyses suggest that fgasin bulges declines dramatically from Galaxy 1 to Galaxy 3, while keeping a similar level of SFE compared to the disks. On the other hand, there is a significant decrease in the disk SFE when the global sSFR of galaxies drops. Tofirst order, the sSFR∼fgas×SFE. If we assume that green valley galaxies evolve with a declining global sSFR, a plausible scenario is that the bulge first quenched due to the reduction on the cold gas available, followed by a subsequent quenching in the disk because of the decrease in both the SFE and fgas. This is consistent with the inside-out quenching scenario in which the star formation ceases in bulgesfirst.
The physical cause of the inside-out quenching, however, remains unanswered. Using the sample drawn from the HERA CO-Line Extragalactic Survey(HERACLES; Leroy et al.2008), Huang & Kauffmann(2015)found that the gas depletion time is shorter for the bulge than for the disk, consistent with an earlier work carried out by Leroy et al. (2013). Although the galaxies used in their works is part of an HI-selected sample, which is mainly composed of normal star-forming galaxies on the main sequence, their result indicates that the greater SFE of the bulge may be responsible for reducing the amount of cold gas for the bulge, leading to the quenching of star formation if there is no further gas supply for the bulge. The observation of our three green valley galaxies does not seem to share the same trend, in particular, that the bulge SFEs of green valley galaxies are similar or even lower than what is observed in their disks, similar
to the findings by Fisher et al. (2013) based on a combined sample of the BIMA SONG (Helfer et al. 2003), CARMA STING(Rahman et al.2012), and PdBI NUGA(García-Burillo et al.2003)surveys. Our Galaxy 1, which is closest to the main sequence, shows comparable SFE and fgasbetween its bulge and disk, suggesting that star formation alone cannot explain the faster reduction of the cold molecular gas in the bulges; some other processes are required to efficiently reduce or remove the cold molecular gas in the central parts of galaxies when galaxies migrate to the quiescent population.
[image:7.612.90.521.52.350.2]One of the commonly accepted pictures refers to the so-called AGN feedback, which heats up or expels the surround-ing gases, preventsurround-ing galaxies from subsequent star formation, particularly for massive galaxies. This scenario is supported by the observation of low gas fraction in AGN host galaxies(e.g., Brusa et al.2015; Kakkad et al. 2017), as well as the AGN-driven molecular gas outflow (Cicone et al. 2014; Feruglio et al.2015). In addition, it has been reported that AGN hosts preferentially lie in the green valley or below the main sequence (Nandra et al. 2007; Salim et al. 2007; Silverman et al.2008; Ellison et al.2016; Smith et al.2016), suggesting that AGN could drive the transition from the star-forming to the quiescent phases. Recently, a spatially resolved star formation rate study using MaNGA galaxies also finds that the resolved sSFR of unbarred AGN hosts is below the resolved main sequence(L. Bing et al. 2017, in preparation)across the entire galaxies, similar to the three cases presented in this work. As noted earlier, one of our three green valley galaxies, Galaxy 3, shows broad-line features and hence potentially hosts an AGN. Figure 5.Left panels: the gas fraction as a function of specific star formation rate. Right panels: the star formation efficiency as a function of specific star formation rate. The dashed lines show the COLD GASS results based on a sample of galaxies with secure CO detections(see Table 1 of Saintonge et al.2011). The small dots in
It is consistent with the AGN feedback framework that the presence of AGN diminishes the available cold gas in the bulge and even in the disks. On the other hand, although the morphological quenching(Martig et al.2009)also predicts low SFE in the disks that are stabilized against gas fragmentation due to the presence of massive bulges, it may not be relevant to the three systems discussed in this work since morphological quenching is only effective in bulge dominated systems, unlike our green valley galaxies.
5. Conclusions
We have observed three MaNGA-selected green valley galaxies with ALMA CO(1–0)to study the role of gas in star formation quenching. The three galaxies are referred to as Galaxies 1, 2, and 3 according to their separation from the main sequence on the global sSFR and M*relation (1: closest; 3: farthest). Specifically, we study the relations among sSFR, SFE, and fgason kiloparsec scales. Our results are summarized below.
1. The resolved MaNGA data show that the disk sSFR declines with the decreasing global sSFR. There is an indication that the bulge departs from the resolved main sequence first, followed by the disk as the global sSFR declines.
2. For Galaxies 2 and 3, which are clearly below the star-forming main sequence, the gas fraction in the bulges is lower compared to that in the disks. The gas fraction in the bulges drops by 1.6 dex from Galaxy 1 to Galaxy 3.
3. The SFE in the bulge is moderately lower than that in the disk for Galaxy 1 and Galaxy 2. In addition, the SFE of disk decreases from Galaxy 1 to Galaxy 3.
4. The resolved sSFR is found to correlate with both fgasand SFE. However, the sSFR of bulges have a stronger dependence on fgas. On the other hand, the resolved sSFR in disks are sensitive to both fgasand SFE.
Our results suggest that the fgasis the dominant factor determining the sSFR of bulges, while the sSFR of disks declines because of the drop in both SFE and fgaswhen the global sSFR declines. Assuming the three galaxies represent a sequence of transitional stages, our results would favor an inside-out quenching—the SF is ceased in the bulge first because of the lack of available cold gas, followed by the quenching in the disk due to subsequent decline in SFE as well as in fgas. Our resultsfit into the AGN feedback scenario in which the AGN activity may heat up or eject the cold gas out, resulting in a reduction of available cold gas to fuel the star formation in the bulges(and possible in the disks), although it remains unclear what drives the declination of SFE in the disks when galaxies move away from the main sequence. However, such a evolution sequence may be oversimplified as it has been shown that green valley galaxies can have diversity in terms of their quenching timescales, suggesting different pathways of star formation quenching (Schawinski et al. 2014; Smethurst et al.2015). Moreover, galaxies may be rejuvenated if there is fresh gas accreted when experiencing minor mergers or galaxy interactions (Thomas et al. 2010; Haines et al. 2015; Lacerna et al. 2016) and hence may not evolve monotonically with a decreasing global sSFR. Detailed stellar population analyses regarding the star formation and stellar mass assembling histories(e.g., Ibarra-Medel et al.2016)together with resolved gas observations for a larger sample of green valley galaxies is required to confirm the picture presented in this work.
We thank the anonymous referee for valuable suggestions that significantly improve the contents of this paper. We thank C. Maraston, E. Emsellem, M. Cappellari, and A. Aragon-salamanca for helpful suggestions. The work is supported by the Ministry of Science & Technology of Taiwan under the grant MOST103-2112-M-001-031-MY3 and 106-2112-M-001-034. R.M. and F.B. acknowledge support by the UK Science and Technology Facilities Council (STFC). R.M. acknowledges ERC Advanced Grant 695671“QUENCH.”
This paper makes use of the following ALMA data: ADS/ JAO.ALMA#2015.1.01225.S. ALMA is a partnership of ESO
(representing its member states), NSF (USA), and NINS
(Japan), together with NRC (Canada), NSC, and ASIAA
(Taiwan), and KASI(Republic of Korea), in cooperation with the Republic of Chile. The Joint ALMA Observatory is operated by ESO, AUI/NRAO, and NAOJ. This project also makes use of the MaNGA-Pipe3D data products. We thank the IA-UNAM MaNGA team for creating it, and the ConaCyt-180125 project for supporting them. The Green Bank Observatory is a facility of the National Science Foundation. This work used data from project AGBT17A_012: “HI -MaNGA: HI Followup of MaNGA galaxies,” PI Karen L. Masters.
Funding for the Sloan Digital Sky Survey IV has been provided by the Alfred P. Sloan Foundation, the U.S. Department of Energy Office of Science, and the Participating Institutions. SDSS-IV acknowledges support and resources from the Center for High-Performance Computing at the University of Utah. The SDSS website iswww.sdss.org. SDSS-IV is managed by the Astrophysical Research Con-sortium for the Participating Institutions of the SDSS Collaboration including the Brazilian Participation Group, the Carnegie Institution for Science, Carnegie Mellon University, the Chilean Participation Group, the French Participation Group, Harvard-Smithsonian Center for Astrophysics, Instituto de Astrofísica de Canarias, The Johns Hopkins University, Kavli Institute for the Physics and Mathematics of the Universe
(IPMU) / University of Tokyo, Lawrence Berkeley National Laboratory, Leibniz Institut für Astrophysik Potsdam (AIP), Max-Planck-Institut für Astronomie(MPIA Heidelberg), Max-Planck-Institut für Astrophysik(MPA Garching), Max-Planck-Institut für Extraterrestrische Physik (MPE), National Astro-nomical Observatory of China, New Mexico State University, New York University, University of Notre Dame, Observatário Nacional / MCTI, The Ohio State University, Pennsylvania State University, Shanghai Astronomical Observatory, United Kingdom Participation Group, Universidad Nacional Autón-oma de México, University of Arizona, University of Colorado Boulder, University of Oxford, University of Portsmouth, University of Utah, University of Virginia, University of Washington, University of Wisconsin, Vanderbilt University, and Yale University.
ORCID iDs
Niv Drory https://orcid.org/0000-0002-7339-3170 Héctor Ibarra-Medel https://orcid.org/ 0000-0002-9790-6313
Ivan Lacerna https://orcid.org/0000-0002-7802-7356 Tim Haines https://orcid.org/0000-0002-4344-7262 David V. Stark https://orcid.org/0000-0002-3746-2853
References
Abdurróuf, & Akiyama, M. 2017,MNRAS,469, 2806
Baldry, I. K., Glazebrook, K., Brinkmann, J., et al. 2004,ApJ,600, 681
Balogh, M. L., Navarro, J. F., & Morris, S. L. 2000,ApJ,540, 113
Belfiore, F., Maiolino, R., Maraston, C., et al. 2016,MNRAS,461, 3111
Belfiore, F., Maiolino, R., Tremonti, C., et al. 2017,MNRAS,469, 151
Bell, E. F., Wolf, C., Meisenheimer, K., et al. 2004,ApJ,608, 752
Blanton, M. R., Bershady, M. A., Abolfathi, B., et al. 2017,AJ,154, 28
Blanton, M. R., Hogg, D. W., Bahcall, N. A., et al. 2003,ApJ,594, 186
Bolatto, A. D., Wolfire, M., & Leroy, A. K. 2013,ARA&A,51, 207
Brusa, M., Feruglio, C., Cresci, G., et al. 2015,A&A,578, A11
Bundy, K., Bershady, M. A., Law, D. R., et al. 2015,ApJ,798, 7
Calzetti, D. 2001,PASP,113, 1449
Cano-Díaz, M., Sánchez, S. F., Zibetti, S., et al. 2016,ApJL,821, L26
Cicone, C., Maiolino, R., Sturm, E., et al. 2014,A&A,562, A21
Cid Fernandes, R., Pérez, E., García Benito, R., et al. 2013,A&A,557, A86
Drory, N., MacDonald, N., Bershady, M. A., et al. 2015,AJ,149, 77
Elbaz, D., Dickinson, M., Hwang, H. S., et al. 2011,A&A,533, A119
Ellison, S. L., Teimoorinia, H., Rosario, D. J., & Mendel, J. T. 2016,MNRAS,
458, L34
Faber, S. M., Willmer, C. N. A., Wolf, C., et al. 2007,ApJ,665, 265
Falcón-Barroso, J., Sánchez-Blázquez, P., Vazdekis, A., et al. 2011, A&A,
532, A95
Feruglio, C., Fiore, F., Carniani, S., et al. 2015,A&A,583, A99
Fisher, D. B., Bolatto, A., Drory, N., et al. 2013,ApJ,764, 174
García-Burillo, S., Combes, F., Eckart, A., et al. 2003, in ASP Conf. Ser. 290, Active Galactic Nuclei: From Central Engine to Host Galaxy, ed. S. Collin, F. Combes, & I. Shlosman(San Francisco, CA: ASP),423
Goddard, D., Thomas, D., Maraston, C., et al. 2017,MNRAS,466, 4731
González Delgado, R. M., Pérez, E., Cid Fernandes, R., et al. 2014, A&A,
562, A47
Gunn, J. E., & Gott, J. R. I. 1972,ApJ,176, 1
Gunn, J. E., Siegmund, W. A., Mannery, E. J., et al. 2006,AJ,131, 2332
Haines, T., McIntosh, D. H., Sánchez, S. F., Tremonti, C., & Rudnick, G. 2015,
MNRAS,451, 433
Helfer, T. T., Thornley, M. D., Regan, M. W., et al. 2003,ApJS,145, 259
Hsieh, B. C., Lin, L., Lin, J. H., et al. 2017, ApJL, in press(arXiv:1711.09162)
Huang, M.-L., & Kauffmann, G. 2015,MNRAS,450, 1375
Huang, S., Haynes, M. P., Giovanelli, R., & Brinchmann, J. 2012, ApJ,
756, 113
Ibarra-Medel, H. J., Sánchez, S. F., Avila-Reese, V., et al. 2016, MNRAS,
463, 2799
Kakkad, D., Mainieri, V., Brusa, M., et al. 2017,MNRAS,468, 4205
Kauffmann, G., Heckman, T. M., White, S. D. M., et al. 2003, MNRAS,
341, 33
Kennicutt, R. C., Jr. 1998a,ApJ,498, 54
Kennicutt, R. C., Jr. 1998b,ARA&A,36, 189
Lacerna, I., Hernández-Toledo, H. M., Avila-Reese, V., Abonza-Sane, J., & del Olmo, A. 2016,A&A,588, A79
Larson, R. B., Tinsley, B. M., & Caldwell, C. N. 1980,ApJ,237, 692
Law, D. R., Cherinka, B., Yan, R., et al. 2016,AJ,152, 83
Law, D. R., Yan, R., Bershady, M. A., et al. 2015,AJ,150, 19
Leroy, A. K., Walter, F., Brinks, E., et al. 2008,AJ,136, 2782
Leroy, A. K., Walter, F., Sandstrom, K., et al. 2013,AJ,146, 19
Li, C., Wang, E., Lin, L., et al. 2015,ApJ,804, 125
Martig, M., Bournaud, F., Teyssier, R., & Dekel, A. 2009,ApJ,707, 250
Martin, D. C., Wyder, T. K., Schiminovich, D., et al. 2007,ApJS,173, 342
Martins, L. P., González Delgado, R. M., Leitherer, C., Cerviño, M., & Hauschildt, P. 2005,MNRAS,358, 49
Mihos, J. C., & Hernquist, L. 1994,ApJL,431, L9
Mo, H. J., Mao, S., & White, S. D. M. 1998,MNRAS,295, 319
Moore, B., Katz, N., Lake, G., Dressler, A., & Oemler, A. 1996, Natur,
379, 613
Nandra, K., Georgakakis, A., Willmer, C. N. A., et al. 2007,ApJL,660, L11
Osterbrock, D. E., & Ferland, G. J. (ed.) 2006, Astrophysics of Gaseous Nebulae and Active Galactic Nuclei(2nd ed.; Sausalito, CA: Univ. Science Books)
Peng, C. Y., Ho, L. C., Impey, C. D., & Rix, H. W. 2002,AJ,124, 266
Peng, C. Y., Ho, L. C., Impey, C. D., & Rix, H.-W. 2010,AJ,139, 2097
Peng, Y., Maiolino, R., & Cochrane, R. 2015,Natur,521, 192
Rahman, N., Bolatto, A. D., Xue, R., et al. 2012,ApJ,745, 183
Saintonge, A., Kauffmann, G., Wang, J., et al. 2011,MNRAS,415, 61
Saintonge, A., Tacconi, L. J., Fabello, S., et al. 2012,ApJ,758, 73
Salim, S. 2014,SerAJ,189, 1
Salim, S., Rich, R. M., Charlot, S., et al. 2007,ApJS,173, 267
Sánchez, S. F., Pérez, E., Sánchez-Blázquez, P., et al. 2016a, RMxAA,52, 21
Sánchez, S. F., Pérez, E., Sánchez-Blázquez, P., et al. 2016b, RMxAA,52, 171
Sánchez, S. F., Rosales-Ortega, F. F., Jungwiert, B., et al. 2013, A&A,
554, A58
Sánchez-Blázquez, P., Peletier, R. F., Jiménez-Vicente, J., et al. 2006,
MNRAS,371, 703
Sánchez-Blázquez, P., Rosales-Ortega, F. F., Méndez-Abreu, J., et al. 2014,
A&A,570, A6
Schawinski, K., Urry, C. M., Simmons, B. D., et al. 2014,MNRAS,440, 889
SDSS Collaboration, Albareti, F. D., Allende Prieto, C., et al. 2016, arXiv:1608.02013
Silverman, J. D., Mainieri, V., Lehmer, B. D., et al. 2008,ApJ,675, 1025
Smee, S. A., Gunn, J. E., Uomoto, A., et al. 2013,AJ,146, 32
Smethurst, R. J., Lintott, C. J., Simmons, B. D., et al. 2015,MNRAS,450, 435
Smith, K. L., Mushotzky, R. F., Vogel, S., Shimizu, T. T., & Miller, N. 2016,
ApJ,832, 163
Speagle, J. S., Steinhardt, C. L., Capak, P. L., & Silverman, J. D. 2014,ApJS,
214, 15
Thomas, D., Maraston, C., Schawinski, K., Sarzi, M., & Silk, J. 2010,
MNRAS,404, 1775
Vazdekis, A., Sánchez-Blázquez, P., Falcón-Barroso, J., et al. 2010,MNRAS,
404, 1639
White, S. D. M., & Frenk, C. S. 1991,ApJ,379, 52
Yan, R., Bundy, K., Law, D. R., et al. 2016a,AJ,152, 197