Terms and Conditions of Use of Digitised Theses from Trinity College Library Dublin Copyright statement
All material supplied by Trinity College Library is protected by copyright (under the Copyright and Related Rights Act, 2000 as amended) and other relevant Intellectual Property Rights. By accessing and using a Digitised Thesis from Trinity College Library you acknowledge that all Intellectual Property Rights in any Works supplied are the sole and exclusive property of the copyright and/or other IPR holder. Specific copyright holders may not be explicitly identified. Use of materials from other sources within a thesis should not be construed as a claim over them.
A non-exclusive, non-transferable licence is hereby granted to those using or reproducing, in whole or in part, the material for valid purposes, providing the copyright owners are acknowledged using the normal conventions. Where specific permission to use material is required, this is identified and such permission must be sought from the copyright holder or agency cited.
Liability statement
By using a Digitised Thesis, I accept that Trinity College Dublin bears no legal responsibility for the accuracy, legality or comprehensiveness of materials contained within the thesis, and that Trinity College Dublin accepts no liability for indirect, consequential, or incidental, damages or losses arising from use of the thesis for whatever reason. Information located in a thesis may be subject to specific use constraints, details of which may not be explicitly described. It is the responsibility of potential and actual users to be aware of such constraints and to abide by them. By making use of material from a digitised thesis, you accept these copyright and disclaimer provisions. Where it is brought to the attention of Trinity College Library that there may be a breach of copyright or other restraint, it is the policy to withdraw or take down access to a thesis while the issue is being resolved.
Access Agreement
By using a Digitised Thesis from Trinity College Library you are bound by the following Terms & Conditions. Please read them carefully.
i V.I3; JiysDtpiOTcsiii
cisi tJOie i^cK iipS D rsitm ;. JiUi:)r<iM%
M; A s p e r t
A n E m pirical S tu d y o f th e C om p arative E ffect o f A sp e c t-
and O b ject-O rien ted P rogram m in g on T esta b ility
A thesis subm itted to the University of Dubhn, Trinity CoUege in fulfilhnent of the requirements for the degree of
Doctor of Philosophy
Ju n e 2010
I , th e undersigned, declare th a t this work has not previously been su b m itted to this or any o th er University, and th a t unless otherw ise stated , it is entirely my own work. I agree th a t T rinity College L ibrary m ay lend or copy this thesis upon request.
Andrew Jackson
D ated: Ju n e 2, 2010
1 G A:';^ . o i Z
P erm issio n to Lend a n d /o r C opy
I, the undersigned, agree th a t T rinity College L ibrary m ay lend or copy this thesis upon request.
Andrew Jackson
A cknow ledgem ents
I would like to th an k niy su])ervisor Dr. Siobhan Clarke for her guidance and encourage ment. She is an amazing supervisor and is the reason th a t I was able to complete this thesis.
Thanks to all my friends in the Distributed Systems Group for making it a great place to work. A special thanks for all of those who helped me along the way and a very special thanks to my wife Jennifer, my daughter Kaia and the rest of my family for their constant sup})ort.
A n d rew Jack son
Sum m ary
Pro|)ouoiits of AsjX'ct-Orioiitod Prograiiiiiiiiig (AOP) claim th a t it iiiiprovos m aiiitaiiiahil- ity over 01)J('(‘t-Ori('iitod Program m ing (OOP) by enhancing tlu' degree to which conc'crns a n ' s('])arated in software'. M aintainability is measurcxl indirectly through a S ( 't of key indicators: analysability. changeability, stability and testability. To confirm th a t AO P im])roves m aintainability, ('vicU'nce of tlu' coni])arativ(' effect of AO P and O O P on eacfi indicator is ne('d('d. Such evidencc' is re(|uired to objectively consider the adoption of AOP.
Em])irical studies have contributed ('vidence of the comi)arative effect of AOP and O O P on analysability, changeability and stability. W hen analysed together this evidence indicates th at AOP does ini))rove this subset of m aintainability indicators. However, these studi('s do not coniirm th a t AOP imj)roves m aintainability as there is no com parative study of the effect of AOP and O O P on testability.
T his thesis addresses this gaj) through an empirical study to (luantify the com parative ('ffect of AOP and O O P on testability. In the study, a series of m aintenance activities are cum ulatively appli('d to e(juivalent AOP and O O P im])lenientations of a j)rograni. T he effects of AOP and O O P on testability are m easured by a])j)lying M utation Analysis (MA) to both im plem entations after each m aintenance activity. In MA, a set of tests are ('xecuted against nm tants of the ini))lem('ntation. A nm tant is a <‘opy of an im plem entation th at contains a fault. Testability is m easured as the rate at which faults are exposed through t('st failure. TIk' coniy)arative effect is (juantified by applying binomial regression (13P) to thes(! m easun's.
the resuhs can be generahsed and ensuring vahdity. Maximising tlu^ genc'ralisabiiity of
the results is achievt'd in this tlu'sis by selecting study inputs th at are r('|)resentative of
the general case. T Ik' measure of tlu^ com parative effect of AOP and OO P on testability is valid if it is unbiased. Validity is ensured by designing the study such th a t somc(!s of
bias are controlled and ini)uts th a t are unbiased towards AO l’ or OO P are selected.
T he contribution of this study is evidence of the coni])arativ(' (effect of AOP and O O P
on testability. The evidence suggests th a t coni])art'd to OOP, AOP may increase testal)il-
ity. A lthough the study is based on inputs th at are repn'sentative of tlu' general cas(^, t h('
evidence is hard to generalise outside of the context from whic'h it is derived. Although
more studies are reciuired to provide a more generally acceptable evick'nce, t his ('vid('uc('
of the coni]^arativ(' ('fleet of AOP and OO P on testability j)rovides the first st('p toward
tilling the gaj) in the existing evidence of the effect of AOP on m aintainability and ('uabling
C o n ten ts
A c k n o w le d g e m e n ts v
1 I n tr o d u c tio n 9
1.1 B a c k g r o u n d ... 10
1.1.1 M a in ta in a b ility ... 10
1.1.2 C rosscutting C o n c e r n s ... 11
1.1.3 A spect-O riented P r o g r a m m i n g ... 12
1.2 M otivation ... 13
1.2.1 A n a ly s a l) ility ... 13
1.2.2 C h a n g e a b ility ... 13
1.2.3 S t a b i l i t y ... 13
1.2.4 T e s ta b ility ... 14
1.2.5 Evidential G a p ... 14
1.3 S t u d y ... 14
1.3.1 M u tatio n A n a l y s i s ... 15
1.3.2 M easurem ent M e th o d o l o g y ... 16
1.3.3 Analysis A p p r o a c h ... 17
1.4 C h a l l e n g e ... 18
1.4.1 I m p le m e n ta tio n s ... 18
1.4.2 Tests and M u t a n t s ... 18
1.5 C o n tr ib u tio n s ... 19
1.6 Thesis O utline ... 20
2 R e la t e d S tu d ie s 21 2.1 Em pirical E v id e n c e ... 22
2.1.1 O bject O riented M e tr ic s ... 23
2.1.2 C oniparing O bjcct O riented M e t r i c s ... 23
2.1.3 Focus on Em pirical E v i d e n c e ... 23
2.2 W alker et al. and M urphy et a l... 23
2.2.2 E m pirical E v id c iic c ... 25
2.3 B artsch and H a r ris o n ... 25
2.3.1 S t u d y ... 26
2.3.2 E m pirical E v id e n c e ... 27
2.4 Lopes and B a jr a c h a r y a ... 27
2.4.1 S t u d y ... 28
2.4.2 E m pirical E v id e n c e ... 28
2.5 Li et a l... 29
2.5.1 S t u d y ... 29
2.5.2 E m pirical E v id e n c e ... 30
2.6 Kulesza et a l... 30
2.6.1 S t u d y ... 30
2.6.2 Em pirical E v id e n c e ... 31
2.7 Greenwood et a l... 32
2.7.1 S t u d y ... 32
2.7.2 Em pirical E v id e n c e ... 33
2.8 Figueiredo et a l... 33
2.8.1 S t u d y ... 34
2.8.2 Em pirical E v id e n c e ... 35
2.9 E vidential G a p ... 35
2.9.1 Existing Evidence ... 36
2.9.2 T estability G a p ... 36
2.10 Com m on Evidence G athering A p p r o a c h ... 36
2.10.1 E q u iv a le n c e ... 36
2.10.2 E f f e c ts ... 37
2.10.3 A p p l i c a b i l i t y ... 38
2.11 C hai)ter S u m m a r y ... 38
3 T e s ta b i li ty 39 3.1 Fault E xposure M o d e l ... 40
3.1.1 F a u l t s ... 40
3.1.2 T e s t s ... 41
3.1.3 M o d e l ... 44
3.2 Factors of T e s ta b ih ty ... 45
3.2.1 Fault T y p e ... 45
3.2.2 T e s t s ... 46
3.2.3 Im p le m e n ta tio n ... 47
3.2.4 Factors ... 49
C O N T E N T S
3.3.1 F au lt T y p e ... 51
3.3.2 T e s t ... 52
3.3.3 I m p le m e n ta tio n ... 52
3.3.4 E vidential G a p ... 53
3.4 C h ap ter S u m m a r y ... 53
4 S t u d y M e t h o d o l o g y 55 4.1 T estability M e a s u r e m e n t... 55
4.1.1 M easurem ent A pproach S e le c tio n ... 56
4.1.2 M u ta tio n A n a l y s i s ... 59
4.1.3 S u m m a r y ... 65
4.2 G athering M easures of T estability ... 66
4.2.1 Following the Com m on A p p r o a c h ... 66
4.2.2 In teg ratin g M utation Analysis into the A p p r o a c h ... 69
4.2.3 S u m m a r y ... 75
4.3 A nalysing M easures of T e s ta b ility ... 76
4.3.1 G raphical A n a ly s is ... 76
4.3.2 Binom ial Regression A n a l y s is ... 80
4.3.3 T h re ats to Analysis V a lid ity ... 83
4.3.4 S u m m a r y ... 83
4.4 C h ap ter S u m m a r y ... 83
5 S t u d y I n p u t s 85 5.1 I m p le m e n ta tio n s ... 86
5.1.1 Selection of I m p le m e n ta tio n s ... 87
5.1.2 H ealth W atcher - Use Cases and M aintenance A c t iv i ti e s ... 88
5.1.3 H ealth W atcher - Java and Aspect.) Im p le m e n ta tio n s ... 90
5.1.4 S u m m a r y ... 92
5.2 M u t a n t s ... 92
5.2.1 F ault M o d e l... 93
5.2.2 M u ta n t O p e r a t o r s ... 95
5.2.3 M u ta n t G eneration T o o l ... 96
5.2.4 S u m m a r y ... 99
5.3 T e s t s ... 99
5.3.1 Choosing a Test Selection A p p r o a c h ... 99
5.3.2 Black Box Test Selection ... 101
5.3.3 Test E xecution A u t o m a t io n ... 103
6 S tu d y R e s u lts a n d A n a ly s is 109 G.l Com parison of G enerated M u t a n t s ... I l l
6.1.1 R esults of M u tan t G e n e r a tio n ... I l l
6.1.2 M u ta n t E q u iv a le n c e ... 112
6.1.3 S u m m a r y ... 115
6.2 Analysis of O utcom es and R ates ... 115
6.2.1 O u t c o m e s ... 115
6.2.2 F ault E xecution ... 116
6.2.3 Infection and P r o p a g a tio n ... 119
6.2.4 F ault E x p o s u r e ... 122
6.2.5 S u m m a r y ... 124
6.3 Q uantifying the C om parative E f f e c ts ... 124
6.3.1 Binom ial R e g r e s s io n ... 124
6.3.2 Com j)arative E f f e c t s ... 125
6.3.3 S u m m a r y ... 127
6.4 T h reats to V a lid ity ... 128
6.4.1 T estability M e a su re m e n t... 129
6.4.2 Program S e l e c t i o n ... 130
6.4.3 Test S e le c tio n ... 132
6.4.4 S u m m a r y ... 135
6.5 C hapter S u m m a r y ... 135
7 C o n c lu s io n s a n d F u tu r e W ork 137 7.1 C o n c lu s io n s ... 138
7.1.1 C om parative Effect of AOP and O O P on T e s ta b i li ty ... 138
7.1.2 Causes of C om parative Effect... 139
7.1.3 Advice for A doption of A O P ... 140
7.1.4 Issues to Consider when A dopting A O P ... 140
7.2 F u tu re W ork ... 141
7.2.1 P o in tc u t I s s u e s ... 141
7.2.2 C ausation of Lower Infection and P ro p ag atio n O dds for A O P . . . 141
7.2.3 T esting ... 142
7.2.4 P r o g r a m ... 142
7.2.5 M u ta n t G e n e r a tio n ... 142
A A d d itio n a l R e s u lts 143
List o f Tables
2.1 Li ct al. Change Impacts ... 30
2.2 Indicator C o v e r a g e ... 35
3.1 Requirements for Fault E x p o s u r e ... 45
3.2 Effects of Differences in F"ault I 'a c t o r ... 46
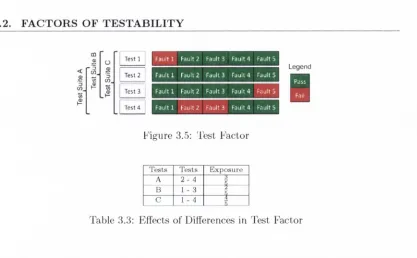
3.3 Effects of Differences in Test Factor ... 47
3.4 Effects of Differences in Ini[)lementation F a c t o r ... 49
3.5 Factor L e v e l s ... 50
3.G Overview ... 50
4.1 Test P ath E x e c u tio n ... 59
4.2 M utation Analysis O u tc o m e s ... 75
4.3 M utation Analysis O u tc o m e s ... 76
4.4 M o d els... 81
5.1 Candidates for S e le c tio n ... 87
5.2 Health W atcher Version 1: Use Causes [ 8 7 ] ... 89
5.3 Health W atcher Version 9: Use Cases [ 8 7 ] ... 89
5.4 Health W atcher Versions 2 - 10: M aintenance A c ti v itie s ... 89
5.5 Java Fault M o d e l... 97
5.6 AspectJ Fault M o d e l... 98
5.7 Employee Login Use C a s e ... 102
5.8 Examples of Test Selection ... 102
5.9 Test D a t a ... 102
5.10 Tests Selected for Use C a s e s ... 103
6.1 M o d els... 125
List o f Figures
1.1 F ault Exposure: O utcom es and R ates ... 15
1.2 M easurem ent M ethodology ... 16
1.3 C o n tr ib u tio n s ... 19
1.4 C a u s a t i o n ... 19
2.1 E vidential G a p ... 22
2.2 W alker et al. and M urphy e t al. E x p e r im e n t s ... 24
2.3 B artsch and Harrison E x p e r im e n t... 26
2.4 Lopes and B ajracharya S t u d y ... 27
2.5 Li et al. S t u d y ... 29
2.6 Kulesza et al. S t u d y ... 30
2.7 Study of Greenwood et a l... 32
2.8 S tudy of Figueiredo et a l... 34
2.9 A p p r o a c h ... 37
2.10 M easures ... 37
2.11 R e s u l t ... 37
3.1 T e s ta b ility ... 39
3.2 Control-flow graph for setSize m e t h o d ... 41
3.3 Control-flow path s through setSize m ethod for tests 1 - 4 42 3.4 Fault F a c t o r s ... 46
3.5 Test F a c t o r ... 47
3.6 Im plem entation F a c t o r s ... 49
3.7 Designs of T estability S t u d i e s ... 51
4.1 M e a s u r e m e n t... 56
4.2 F a c to r s ... 56
4.3 A n a l y s is ... 56
4.4 Stack R e s u lt... 56
4.6 M easuring T estability as th e N um ber of Tests Needed for Fault E xposure 58
4.7 M u tatio n A n a l y s i s ... 61
4.8 M u tatio n O p erato rs AppUed at L o c a t i o n s ... 61
4.9 Locations E xecuted by Test 1 ... 63
4.10 F aults E x e c u t i o n ... 64
4.11 Fault E x p o s u r e ... 64
4.12 h^ault Exposure; M odel, R ates and Elfects of S u b - R a t e s ... 64
4.13 A p p r o a c h ... 67
4.14 F a c to r s ... 67
4.15 Stack E x a m p l e ... 69
4.16 Size ... 70
4.17 M u tatio n A n a l y s i s ... 70
4.18 M u ta n t G e n ... 71
4.19 Location E x e ... 71
4.20 Exposure ... 71
4.21 M u ta n t G e n ... 71
4.22 L ocation E x e ... 71
4.23 Exposure ... 71
4.24 J a v a ... 75
4.25 A s p e c t . ! ... 75
4.26 Visualising O utcom es ... 77
4.27 Fault E x p o s u r e ... 77
4.28 F ault E x e c u tio n ... 77
4.29 Infection and P r o p a g a t i o n ... 77
4.30 Conclusions of Analysis for S t a c k ... 80
4.31 C orrelations betw een each R ates and versions and im plem entation factors 82 4.32 F E ... 82
4.33 F X ... 82
4.34 IP ... 82
4.35 C ausation for C om parative E f f e c t s ... 82
5.1 P r o g r a m ... 85
5.2 M u t a n t s ... 85
5.3 T e s t s ... 85
5.4 O bject O riented H ealth W atcher [ 6 3 ] ... 90
5.5 A spect O riented H ealth W atcher [ 8 7 ] ... 91
5.6 M u J a v a ... 98
5.7 A spectJ E x t e n s i o n ... 98
5.8 A u to m ated Em ployee Login T e s t ... 104
LIST OF FIGURES
5.9 Location E x e c u tio n ... 105
5.10 Fault E x p o s u r e ... 105
5.11 Distribution of Test E x e c u tio n s ... 106
6.1 Fault Exposure; M utant and R a t e s ... 109
6.2 M utant G e n e ra tio n ... 113
6.3 Measure V isu a lise d ... 113
6.4 Types of F a u l t s ... 113
6.5 Size for C o rre la tio n ... 113
6.6 O u tc o m e s ... 116
6.7 Outcomes V is u a lis e d ... 116
6.8 Rates of Fault E x ec u tio n ... 117
6.9 D ata Layer In itia lis a tio n ... 117
6.10 Example of the Im pact Of D ata Layer Initalisation On C l i e n t ... 118
6.11 Fail and Pass O u tc o m e s ... 119
6.12 Rates of Infection and Proj)... 119
6.13 Fault T y p e s ... 121
6.14 Rates of Fault E x p o s u r e ... 122
6.15 Comparative E f f e c t s ... 123
0.16 Measures of the relative effects of im plementation and version levels on ratesl26 6.17 F E ... 126
6.18 F X ... 126
6.19 IP ... 126
6.20 Comparative Effects QuantificHi... 126
6.21 C a u s a tio n ... 127
6.22 Measuring Testability In A Comparative C o n te x t... 130
6.23 Convergence as test set size in c re a se s... 134
6.24 Intervals for the difference between Aspect.I and Java ... 135
7.1 G a p ... 137
7.2 Comparative P ]ffe c ts ... 138
7.3 Reason for Comparative E ffe c ts ... 140
C h apter 1
In tro d u ctio n
P r0])0iierits of Aspect-Oriented Progrannning (AOP) claim th a t it improves m aintainabil ity over Object-O riented Program m ing (OOP) by enhancing the degree to which concerns are sej)arated in software [84, 83, 50, 68, 125, 89, 40]. The key indicators of m aintainability are analysability, changeability, stability and testability [73]. This chapter provides the background from which this claim has emerged by describing why AOP is expected to ini])rove them.
Studies consistently show th a t m aintenance accounts for the largest proportion of a l)rograms total cost [154, 96, 22, 51]. M aking program s easier to change reduces this cost. Improving m odularity has been shown to make programs more m aintainable [42]. OO P was a m ajor ini])rovenient on m odularity and is currently the defacto ai)proach for ini])lementing ])rograms [136].
The claim th a t AOP inij)roves m aintainability and consequently reduces costs over OOP, has led organisations using OOP to consider adopting AOP [39, 2]. However, for tlie adoption of AOP to be objectively considered, confirmation of this claim is required [39, 25]. To confirm th a t AOF^ improves m aintainability, evidence of the com parative effect of AOP and OOP on each indicator of m aintainability is needed [129|.
'Fhis chapter presents the existing evidence of the comparative efi'ect of AOP and OO P on some of the key indicators of m aintainability [149, 14, 88, 66, 92, 97, 54, 87, 63]. It shows a gap in this evidence, c^is there is no empirical evidence of the testability of AOP. Testability is a key component of m aintainability [33, 22, 141]. W ithout evidence of the com parative effect of AOP and OOF^ on testability the confirmation of any claim related to m aintainability is superficial [129, 25]. The adoption of AOP, therefore, cannot be objectively considered [39].
m easures are tlien analysed to cjuantily th e eom parative eflect. T his c h a p te r in troduces how the testab ility is m easured using n n itatio n analysis [45]; how m easures of te sta b ility are gath ered to ensure th a t th e testab ility m easurem ents for the A G P and O O P ini])le- m en tatio n s are directly com pai'able; and how binom ial regression [52] is used to m easure th e com parative effect of A O P and 0 0 1 ^ on testability.
T his study, like sim ilar stu d ies [24], faces a fundam ental challenge of m axim ising the degree to which th e results can be generalised. To nuixim ise th e degree to which evidence g ath ered from a single stu d y can be generalised, th e iu])uts on which the stu d y is based n nist be re])resentative of the general case. T his ch a p te r describes the in p u ts selected for th is stu d y and shows th a t they are representative of the general case.
T h e ch a p te r concludes by presenting the con trib u tio n s of the stu d y and outlin in g the rem aining ch a p te rs of th is thesis.
1.1
B a c k g r o u n d
T h is section outlines th e l.iackground from which th e claim th a t AO P imi)roves m ain tain ability over O O P has em erged and describes why A O P is ex})ect('d to ini])rove th e key indicators of m aintainability.
1.1.1 M a in ta in a b ility
M ain tain ab ility is a m easure of th e ease w ith which a ])rograni’s im plem en tatio n can be changed [73]. A pplying a change to a ])rogram is m ade in four stei)s [129]. T h e m ain tain ab ility of an im plem en tatio n is based on th e ease w ith which each stej) is tak en [153, 129],
T h e first ste p is to u n d ersta n d and identify w^hat [)arts of the im [)lenieiitation need to be changed. A n u n d ersta n d in g of the ini])lenientation is needed before th e code can be analysed to identify the p a rts th e change is a])plicable to. T he easier th e code is to u n d e rsta n d and analyse, th e easier it is to change.
T h e second step is to im plem ent th e change. T he ease w ith a change can be im ple m ented is a m easure of the size of the im i)act it will nuike [8]. T he im pact is m easured as th e effort needed to im plem ent the change. T he sm aller th e im pact is, th e easier the change is to make.
I'h e tliird step is to address th e ripple effect of the change. A change to a m odule can p ropagate th ro u g h its efferent dependencies causing the effect of th e change to be am plified. M inim ising these dependencies makes the system more stab le and re sistan t to ripple effects. T he m ore stab le an ini{)lem entation is, tlie easier a change is to ap[)ly [129].
'I'he fourth and final step is to expose faults th a t are introduced into th e iini)lenien- ta tio n during the change. F au lts in an im plem entation m’e exposed th ro u g h test failure
1.1. B A C K G R O U N D
[110]. The irnpleineiitatioii can hide faults by allowing tests to ])ass when faults are present [148]. An imi)lenientation th a t exposes more faults introduced through change is more testable and easier to change.
Measiu'es of the ease with which each step can be m ade are key indicators of a pro grams m aintainability. These key indicators are analysability, changeal)ility, stability and testability [73]. Analysability is the ease with which the j^rogram’s code can be under stood and analysed. Changeability and stability are indicators of the ease with which a program s im plem entation can be changed. Testability is the ease with which faults can be exposed through testing [148].
1 .1 .2 C r o s sc u ttin g C o n cern s
Since the inception of software engineering, increasing m odularity has been recognised [9, 46, 138, 120, 27, 28, 13, 32] as a way to improve the separation of concerns in programs and improve maintainability. Concerns are the behaviours or features th a t make up a program [82, 84, 48].
In a well modularised object-oriented ])rogram, each concern is inij:)lemented in a module. The module enca])sulates the concerns implem entation. Some concerns can be separated into modules in well modularised object-oriented programs. T here are however other concerns th a t cannot be cleanly encapsulated as modules. W hen the im plem entation of a concern cannot be encapsulated within one module, it becomes scattered across other program modules. W ithin these modules, this im plem entation becomes entangled with the im plem entation of the prim ary concern. Scattered and tangled concerns are said to crosscut the program and are called crosscutting concerns [82, 84, 48].
Claims th a t AOP improves m aintainability over O O P are based on the improved separation of crosscutting concerns th a t AOP supports [82, 84]. It is expected th a t this improvement will result in improvements in the key indicators of m aintainability. The negative eflects of crosscutting concerns on analysal)ility, changeability, stability and testability are the basis for the claims. The negative efi’ects on each are outlined in this subsection.
A nalysability
to w hicli a ch an g e is a p p h c a b le .
C hangeability
C h a n g e is ea sie r to im p le m e n t w h en its im p a c t is sm all [8]. In O O P th e goal is to m in im ise a c h a n g e ’s im p a c t by lo calisin g th e ch an g e to one m o d u le. H ow ever, w h en a c o n c e rn is c ro s s c u ttin g th e im p a c t of th e ch an g e c a n in c re a se [92], as it c a n have a n im })act on all of th e m o d u le s acro ss w hich it is s c a tte re d . T h e p o te n tia l im p a c t is c o m p o u n d e d by ta n g lin g b e c a u se a c h a n g e a p p lie d to one co n cern , c a n have a n im p a c t th e o th e rs w ith w hich it is e n ta n g le d .
Stability
W h en a p ro g ra m is re s is ta n t to th e rip p le effec-t of ch an g e it is m ore s ta b le a n d ejisier to c h a n g e [101|. In O O P , th is effect is red u ced by m in im isin g th e ra tio o f o u tg o in g to in co m in g d e p e n d e n c ie s for e a c h m o d u le [101]. C ro s s c u ttin g co n c e rn s c a n re d u c e s ta b ility by in tro d u c in g o u tg o in g d e p e n d e n c ies in to th e m o d u les th e y c ro ssc u t. A h ig h er n u m b e r o f o u tg o in g d e p e n d e n c ie s p e r m o d u le in creases p o te n tia l of ri[>ple effec'ts of cliange. If a p ro g ra m is n o t re s is ta n t to rip p le effec'ts it is h a rd e r to ch an g e.
T estability
A p ro g ra m t h a t ex p o ses m o re fa u lts is m o re te s ta b le a n d easier to ch an g e. F a u lts cU-e ex p o se d th ro u g h te s tin g . A fa u lt in b e h a v io u r ca n o n ly b e exi)osed if it is ex e c u te d . W h en a b e lia v io u r is s c a tte r e d a n d ta n g le d it is m ore difficult to selc(;t te s ts th a t w \\\ g u a ra n te e e x e c u tio n of th e b e h a v io u r. A lso, m o re fa u lts a re fou n d to o c cu r a t th ese s c a tte r e d a n d ta n g le d b e h a v io u rs [48]. T o g e th e r, th ese issues m ake th e fa u lts a t s c a tte re d a n d ta n g le d b e h a v io u rs difficult to ex})ose [48].
1 .1 .3 A sp e c t-O r ie n te d P ro g r a m m in g
A s p e c t-O rie n te d P ro g ra m m in g (A O P ) im proves th e d eg ree to w hich c ro s s c u ttin g co n cern s a re se ])a ra ted in so ftw are over O b je c t-O rie n te d P ro g ra m m in g (O O P ) [82, (53]. A O P in tro d u c e s a new a s p e c t m o d u le t h a t ca n be used to e n c a p s u la te c ro s s c u ttin g co n cern s. B y m o d u la ris in g c ro s s c u ttin g c o n cern s th e a m o u n t of s c a tte rin g a n d ta n g lin g c a u se d by c ro s s c u ttin g is red u c e d . C ro s s c u ttin g c o n c e rn s have a n e g ativ e effect on an a ly sa b ility , ch a n g e a b ility , s ta b ility a n d te s ta b ility . T h e e x p e c ta tio n t h a t A O P will lead to im p ro v e m e n ts in th e key in d ic a to rs o f m a in ta in a b ility is b a se d on th e im p ro v ed m o d u la rity of c ro s s c u ttin g co n c e rn s fa c ilita te d by A O P [84, 83, 50, G8, 125, 89, 40].
1.2. MOTIVATION
1.2
M o tiv a tio n
"I'his section outlines the evidence of the com parative effect of AOF and 001^ on analysabil- ity, changeabihty and stal)ihty contributed by existing empirical studies. A clear gap is identified in the empirical evidence of the com parative effect of AOl^ and OOP on testa bility.
1.2.1 A n a ly s a b ilit y
Contributions to tiie evidence of the com parative effect of AGP and OOP on analysability have been made through empirical studies carried out l)y M urphy et al. [109], Walker et al. [149] and Bartsch and Harrison [14]. Analysability is mecisured a.s the tim e taken to identify the parts of each im plem entation th at will be affected for a specific change by M urphy et al., Walker et al. and Bartsch and Harrison. The findings of Murphy et al. and Walker et al. suggest that. AOP results in slightly higher analysability while Bartsch and Harrison fhid no significant difference between AOP and OOP.
1.2.2 C h a n g e a b ility
l']vidonce of the comparative effect of AOP and OOP on changeability have been con tributed by a num ber of studies including Walker et al. [149], Bartsch and Harrison [14], Li et al. [92] and Lopes and B ajracharya [97]. In these studies, changeability is measured by ai)plying the same change(s) to AOP and OO P im plem entations and measuring the difference betw'cen tlie impacts the change has on each. Walker et al. and Bartsch and Harrison m easure the size of the im pact as the tim e taken to implement the change. Li et al. measure the size of the impact by counting the num ber of modules th at are affected by a change. Lopes and Bajracharya measure the impact in term s of its effect on design options. The findings of I^opes and 13ajracliarya, Li et al. and Walker et al. consistently suggest th a t AOP can lead to imi)roved changeabihty over OOP. Bartsch and Harrison find no significant difference in the effects of AOI^ and OO P on changeability.
1.2.3 S ta b ility
1 .2 .4 T e s ta b ility
T h ere are no eniphical studies of’ Ifie com parative effect of AOl^ and 00 1 ^ on testability. T estai)inty can have a significant effect on m aintenance costs [33, 22, 14Ij. One cause of this is th a t new faults cU’e introduced into th e inij)lenientation when changes are aj)plied. It is e stim a te d th a t 40% of changes introduce new faults [124]. T his indicates th a t te sta b ility is th e m ost significant indicator of rnaintainabihty.
It has been shown th a t crosscutting concerns are m ore likely to contain faults [48]. AG P reduces th e cro sscu ttin g of concerns over OO P. T his indicates th a t there is ])otential for A O P to im prove testability. T he red u ctio n in crosscutting is based on the in tro d u ctio n of a com position m echanism th a t can introduces a range of new ty})es of faults. It has been oi)served th a t these new types of fauUs can be more diffic-uK to expose th ro u g h testin g [2], deflating the potential of A O P to im prove te sta b ility som ew hat.
1 .2 .5 E v id e n tia l G ap
T he existing stu d ies provide a significant am ount of evidence to suggest th a t A O P can im prove analysability, changeability and stability. A lthough m ore studies are needed to fully validate the benefits of AOP, the existing evident'e is encouraging for those con sidering th e adop tio n of A O P to reduce m aintenance costs. However, due to th e high p ro p o rtio n of the m aintenance costs a ttrib u te d to testing, the confirm ation of this claim , w ith o u t evidence of th e com parative effect of AOi^ and O O P on testability, is su{)erficial. C onsidering th e adop tio n of A O P based on a su[)crficial confirm ation can n o t be objective [39, 25].
1.3
S tu d y
T h is thesis addresses th e evidential gap th ro u g h a stu d y to g ath er em pirical evidence of the co m p arativ e effect of A O P and O O P on testability. In th e study, a series of m ainte nance activities ai’e cunm latively applied to e(iuivfilent A O P and O O P im p lem entations of a program . T h e testab ility of b o th im p lem entations is m easured after each m ainte nance activity. T hese m easures are then analysed to (|uantify the com p arativ e effect, 'rh is (luantification is em pirical evidence of the com parative effect of A O P and O O P on testability.
1.3. STUDY
F au lt E x p o su re M utant O u tc o m e s
N o t Exe
Fault E x e cu tio n Infection and P ro p a g a tio n
Figure 1.1; Fault Exposure: Outcomes and Rates
1.3.1 M u ta tio n A nalysis
Faults in a program ’s implem entation are exposed through testing. The implem entation can hide faults by allowing tests to pass when faults are present [128, 148, 60]. A program th at does not hide faults has high testablility
M utation Analysis (MA) [45] measures the testability of an implem entation as its rate of fault exposure under testing. In MA, tests are executed against m utants of the im plem entation. A m utant is a version of the implem entation th at contains a fault. Exam ples of m utants and details of how they are autom atically generated are presented in C hapter 4.
T he rate of fault exposure is based on the outcomes of executing tests against m utants. F^art A of Figure 1.1 shows th at there are three possible outcomes for each test-m utant execution. The test executes a path through the m utant im plem entation. The fault contained in the m utant may or may not be executed on this path. C hapter 3 dem onstrates th a t if the fault is executed, then the state directly after th a t can become infected and this sta te infection can be propagated [128, 148, 146, 147, 76, 1], which in tu rn results in a fail outcome. A fail outcome indicates fault exposure. Infection occurs when the execution of the fault results in a state th a t differs from the state th a t would occur if the fault was not present [128, 148]. The infected state is propagated if it causes the output of the im plem entations execution to differ from the o utput of the normal execution [128, 148]. If the sta te directly after the faults execution does not become infected or propagated, then the resulting outcome is a pass.
[image:27.530.53.476.73.296.2]V ersio n Prc>qram
AOP I OOP
T . a > I
A" = M a in te n a n c e Activity
< >
Im p le m e n ta tio n E q u iv a le n c e
Figure 1.2: Measurement Metiiodology
F art C of Figure 1.1 dem onstrates iiow tliese outcomes are used to calculate a rate of
fault exposure for an implem entation. The rate of fault exposure in this simple example
is based directly on the rates of fault execution an<l in
fection and propagation, ^ ^ x The rate of fault execution is ^ = jaU+put+notexe• The rate of infection and propagation is
1.3.2 M easu rem en t M eth o d o lo g y
The goal of this study is to compare the effects of AOP and OOP on testability, as an indicator of m aintainability. To ensure th a t this goal was achieved, the study followed a m easurem ent methodology widely used in existing studies [149, 14, 92, 54, 87, 63] th at compare the effects of AOP and OO P on analysability, changeability and stability. The basis for this m easurem ent methodology is illustrated in Figure 1.2 and is detailed in C hapters 2 and 4.
In the methodology, m aintenance activities are cum ulatively applied to AOP and OO P im plem entations of a program. The initial AOP and OOP implem entations of a program are equivalent in th a t they differ only in the approach used for their development. Equivalence is assured by fixing all other factors th a t can cause the implem entations to differ. Examples of these factors are the expertise used in developed of both AOP and OO P im plem entations and the requirem ents they satisfy. They are fixed by ensuring th at these factors are equivalent for each pair of AOP and OOP implementations. As will be detailed in C hapters 2, 4 and 5, the implem entations were developed to the same level of expertise, satisfy the same requirements, expose the same interface and produce the same o u tp u ts for a given input [63].
[image:28.529.58.478.68.339.2]1.3. ST U D Y
The same iiiaiiiteiiaiice activities are cunmlatively apphed to each pair of equivalent AOF and OOP implem entations. After each m aintenance activity is applied to both implem entations, new versions of these im plem entations result. The new versions of these implem entations are equivalent because the same m aintenance activity is applied to both implem entations [63]. This means th a t the respective versions of the AOF and OO F implem entations are also equivalent. W hen all m aintenance activities are applied, the only difference between each respective version of the AOf^ and OOF im plem entations is the m aintenance activity.
Following this methodology ensures th a t the measures gathered represent tlie eflects of the im plem entation approach (AOF or OO F) and m aintenance factors on the m easure. T he use of MA within this methodology does however, require some additional factor fixing. This is because MA introduces new test and nuitant factors th at can afl'ect eacli mecisure. The application of MA to the AOF and OO F im plem entations of each version of the program requires the execution of tests against m utants generated from the im plem entation. To preserved equivalence, these factors are fixed. They are fixed by using the same set of tests and m utant generation approach in the api)lication of MA to each implem entation. Further details of this methodology are presented in C hapter 4.
1 .3 .3 A n a ly sis A p p ro a ch
T he result of applying nnitation analysis to each AOF and O O F im plem entation over versions of the program are numbers of not exc, pass and fa.il outcomes for each irn[)le- nientation. These outcomes are used to derive rates of fault exposure, fault execution and infection and propagation for each im plem entation. As dem onstrated in C hapter 4, these rates are informally analysed by interpreting graphs to identify if these rates are higher or lower for AOF compared to OOF.
1.4
C h a lle n g e
This study, hke siriiilai’ studies [24, 79], faces the fundam ental challenge of maximising the degree to which the results can be genertilised. To maximise the degree to which evidence gathered from a single study can be generalised, the inputs on which the study is based m ust be representative of the general case. This section shows th at implem entation, tests and nnitants selected for this study are representative of the general case.
1 .4 .1 I m p le m e n ta tio n s
The ini])lementations of the health watcher [87, 63, 55] ])rogram were selected from a i)ool of candidates, Hsted in C hapter 5, th at fit the methodology presented in I'igure 1.2. These implem entations were selected because the health watcher program and the m aintenance activities associated with it were the most rei)resentative of the generfil case.
The health watcher is a public health system th at supports the registration, tracking and resolution of health complaints. This program is a relatively large, database-driven, distributed system with a web front-end anti is made uj) of a set of concerns generally found in a wide range of contemi)orary programs [87, 63].
The })rograin was deployed for use in 2001 [63] and since its deployment, a num ber of adaptive, corrective and perfective changes have been a])plied to it [63]. The m aintenance activities selected for use in this study are based on these and have been selected because they are rej)resentative of the typical distribution of m aintenance activity types [124].
The AGP and OOP languages used to develop the im plem entations are Asj)ectJ and Java. Aspect.! is currently the most widely used AOP language [106]. Aspect,J is an extension of Java, which is currently the most widely used OOP language [136].
1 .4 .2 T ests an d M u ta n ts
T he test set used in this study is the product of a use case driven test selection process [74, 75]. In this process, use cases are used as the basis for test case selection [5, 23]. As is detailed in C hapter 5, this approach was selected over others because it is representative of the type of approach used to select tests for an im plem entation in practice. Testing professionals applied the approach to the health watcher use cases to ensure th a t the application of the approach and the resulting tests were highly representative of practice.
The types of faults generated in m utants for the study are rej)resentative of those observed in practice. These m utants are generated using M uJava [98], a tool th a t generates nnitants for Java im plem entations. M uJava has been widely used to generate nm tants th at contain recilistic faults in testing related research [151, 122, 133, 104, 103, 102, 105, 130, 134]. As part of this work, the tool was extended to generate AspectJ specific m utants.
1.5. C O N T R IB U T IO N S
Fault Exposufe] A s p e c t J - 5 - 9 % AspecU - 1 8 —20%
Jav a -1 1 —16%
m
Fault Execution Infection and PropagationFigure 1.3: Contributions
The extension introduces tlie types of faults observed to occur in A spectJ im plem entations [53] and allows nuitants containing these types of faults to be generated.
1.5
Contributions
The prim ary contribution of the study presented in this thesis is evidence to indicate th a t the effect of AOP is to increase testability over OOP. The results of the study are illustrated in Figure 1.3. This shows th a t the odds of fault exposure are between 5 and 9% higher for the Asp)ectJ implem entations of the health watcher program. This means th at, for the health watcher program, faults are easier to expose in A spectJ compared to Java implem entations. This is evidence to indicate th at the effect of AOP is to increase testability over OOP. Testability can have a significant effect on m aintenance costs [33, 22, 141] and for those considering the adoption of AOP to reduce m aintenance costs [39], this evidence is encouraging.
A secondary contribution of the study, also presented in Figure 1.3, is to identify the causes of the 5-9% difference in the effects of A spectJ and Java on the odds of fault exposure. Fault exposure is a direct consequence of fault execution and sta te infection and propagation. If more faults are executed, then there are more chances for state infection
and ])ropagation, resulting in fault exposure. The more executed faults th a t cause sta te infection and j)ropagation, the more faults th a t are ex])osed. If more faults are exposed, then the odds of fault exposure increase.
Figure 1.3 shows th a t the odds of fault execution are between 18-20% higher in the A spectJ implem entations and th a t the odds of state infection and propagation are be tween 11-16% lower in the AspectJ implementations. This means th a t in the A spectJ im plem entations there are more faults executed. However, it also means th at com pared to Java im plem entations, proj)ortionally less of the executed faults cause state infection and propagation, resulting in lower odds of fault exposure.
This is explained further through the illustration in Figure 1.4. The boxes nuu'ked AspectJ and Java rei)resent the total number of test-m utant executions for AspectJ and Java imj)lementations, respectively. The circles in these boxes represent the num ber of faults executed by tests in AspectJ and Java m utants. This reijresentation shows th a t there are more faults executed in AspectJ compared to Java m utants. This difference is the cause of the 18-20% higher odds of fault execution for Asj)ectJ. The number of executed faults th a t result in pass and fails are rei)resented inside the circle. This representation shows th a t there are proportionally less fails for AspectJ, indicating th a t less of the faults executed in AspectJ m utants result in infection and prof)agation. This difference is the cause of the 11-16% lower odds of infection and propagation for AspectJ.
Figure 1.4, indicates th a t even though there is ])roi)ortionally less fail to pass outcomes from A spectJ test-m utant executions, the odds of fault exposure is 5-9% higher because the volume of fail outcomes is higher for AspectJ. The volume is higher because the num ber of faults executed in nuitants (or pass and fail outcomes) is higher for Asj)ectJ compared to Java.
1.6
T h esis O u tline
The rem ainder of this thesis is organised as follows. C hapter 2 presents a review of the studies th at compare the effects of AOF and OOP on indicators of m aintainability to dem onstrate the evidential gap addressed by this thesis. C hapter 3 describes the factors th a t affect fault exposure. C hapter 4 details tlie methodology followed in the study. C hapter 5 describes the im plem entations, tests and m utants on which the study is l)ased. C hapter 6 presents the results of the study and C hapter 7 draws conclusions from these results.
C h apter 2
R e la ted S tu d ies
Studies consistently show th a t m aintenance accounts for the largest proportion of a p r o gram ’s total cost [154, 96, 22, 51]. OOP is currently the defacto im plem entation ai)proach with more new projects using it than any other api)roach [136]. The claim th at AGP im proves m aintainability and consequently reduces costs over OOP has lead organisations using OOP, to consider adopting AOP [39, 2]. However, for the adoption of AOP to be ol)jectively considered, empirical evidence of the com parative effects of AOP and OOP on m aintainability is required [39, 25, 2j.
M aintainability is a measure of the ease with which a program can be changed [73]. Applying a change to a program is made in four steps [129, 153]. The first step is to understaiui and analyse the program and iflentify what parts of the im plem entation need to be changed (analysability). The second step is to implement the change (changeability). The third step is to address the ripple effects of the change (stability) and tlie fourth step is to expose faults th a t are introduced into the program during the change (testability).
Measures of the ease with which each step can be m ade are key indicators of a pro gram ’s m aintainability. These key indicators are analysability, changeability, stability and testability [73]. To confirm th at AOP improves m aintainabihty, empirical evidence of the com parative effect of AOP and OOP on each indicator of m aintainability is needed [129]. Studies have contributed empirical evidence of this comj)arative effect for some of these indicators [149, 14, 92, 97, 54, 87, 63].
M ain tain ab ility
E v id e n c e e x is ts E v id en tial g a p
Figure 2.1; Evidential Gap
Testability can have a significant effect on m aintenance costs [33, 22, 141]. This makes testability an im portant indicator of m aintainability. W ithout evidence of the com parative effect of AOP and OO P on testability, the m aintainability claim cannot be either rejecttxl or confirmed [129, 25]. The adoption of AOP, therefore, cannot be objectively considered |39|.
The secondary goal of this chapter is to review how these studies gather empirical evidence and id e n tif y a n a p p r o a c h t o g a th e r in g e v id e n c e t h a t c a n b e u s e d in t h e s tu d y p r e s e n t e d in t h is th e s is . This is achieved in two steps. The first step is to identify how empirical evidence is gathered by each study. The second step is to identify an approach used in these studies th at can be used to gather empirical evidence of com parative effect of AOP and OOP on testability.
The first section of this chapter justifies the focus on empirical studies. In the body of the chapter eacli of the studies th a t contributes empirical evidence is described. For each study, the way in which it gathers evidence and the empirical evidence it contributes are identified. The chapter is concluded by identifying an approach th at is used consistently to gather evidence for of the com parative effect of AOP and OO P on the key indicators of m aintainability and w ith a discussion of the applicability of this approach to this study. The empirical evidence contributed by each study is also collated to show th a t there is no empirical evidence of the com parative effect of AOP and OOP on testability.
2.1
Em pirical E vidence
Only studies th a t have contributed empirical evidence of the com parative effect of AOP and OOP on the key indicators of m aintainability are considered in this chapter. There are other studies th a t provide evidence of this comparative effect based on predictive metrics [144, 143, 108]. These studies typically use object-oriented metrics [144, 143, 108, 62] to predict, rather than observe, the ease w ith which an AOP and OOP im plantation can be analysed, changed or tested.
2.2. WALKER ET AL. AND M URPH Y ET AL.
2.1.1 O b ject O riented M etrics
The predictions made by applying object-oriented m etrics are based on assumed cor relations between object-oriented features and the ease of analysis, change or testing. A lthough there is evidence to validate some of these correlations for OOP [38, 93, 4, 15, 81, 29, 30], there is no empirical evidence th a t these correlations are valid for AOP.
This means th at some confidence can be associated with the accuracy of m aintain ability measures derived from applying object-oriented metrics to OOP implem entations. It also means th a t less confidence can be asvsociated with the accuracy of m aintainal)ility merisures derived from applying object-oriented metrics to AOP implem entations.
2.1.2 C om paring O bject O riented M etrics
If the object-oriented metrics do not provide accurate measures when ai)plied to AOP, then this makes the comparison of measures th a t result from applying these metrics to AOP and O O P implem entations inaccurate [34, 66, 88, 35, 144]. O bject-oriented metrics are based on features of OOP and do not incorporate AOP specific features. Bias is introduced when comparing measures based on these metrics when they are not equally applicable to AOP and OOP. There are adaptations of these metrics th at capture the effects of some, but not all AOP specific features [144, 108, 35, 34]. Although the adaptations reduce bias, they do not m itigate it because they do not capture the effects of all AOP features.
2 .1.3 Focus on E m pirical E vidence
M easuring the observed impacts of applying m aintenance activities to AOP and OOP imj)lementations of a program is the only way to gather accurate measures of m aintain ability. This is because these measures are direct observations rath er than inaccurate predictions. M easuring the observed im pact is an approach th at is equally applicable to AOP and OOP implem entations. This means th a t the measures of im pact are directly comi)arable.
2.2
W alker et al. and M u rp h y et al.
Two experim ents are carried out in a study by Walker et al. [149] and M urphy et al. [109]. In these experiments, empirical evidence of the com parative effect of AOP and OOP on analysability and changability is gathered.
2.2.1 S tud y
Group A ssignm ent
Experinf^ent 1
Experim ent 2
12 S tudents/A cadem ics
L ib ra ry AspectJ AspectJ tm « ra k ]
Figure 2.2: Walker et al. and M urphy et al. Experim ents
asked to complete analytical tasks and perform tasks in which changes are applied to an implem entation. During the tasks, the performance of the participants is measured and these measures are analysed.
Group A ssignm ent
In this study, twelve com puter science graduate students and academics were asked to carry out m aintenance activities on OOP and AOP im plem entations of a trivial library program. Each participant was assigned to work on either the OOF or AOP implemen tation. At the end of the group assignment there were two groups of six, one group was assigned to the OOF im plem entation and the other to the AOF^ implem entation. Figure 2.2 illustrates this process.
E xperim ent 1
In tlie first experiment, illustrated in Figure 2.2, three pairs of similar ability were formed out of each group. These pairs were then asked to analyse the Java and AspectJ imple m entations of the library program to which they were assigned. The goal of this analysis was to identify three cascading synchronisation faults. These faults were cascading in th a t symptom s of the first fault hid symptom s of the second, and so on. Each pair was videotaped and measures of the tim e taken to identify each fault, the amount of switching between files and the num ber of instances of semantic analysis were recorded.
E xperim ent 2
In the second experim ent, also illustrated in Figure 2.2, the participants in each group were asked to cum ulatively apply three changes to Emerald [21] (an OOP language) and AspectJ implem entations to which they were assigned. Two changes were adaptive and
2.3. B A R T SC H A N D H A R R ISO N
one change was perfective in nature. The tim e spent applying these changes and the proportion of tim e used for analysis and coding was recorded.
A nalysis
The d a ta gathered in both experiments is analysed graphically. The tim e taken, the
number of switched between files less and num ber of semantic analyses recorded for each
fault in the first experiment are analysed in separate graphs where the pairs assigned to
the AOP and OO P implem entations are directly compared.
The time each participant took to complete each change and the percentage of th a t
tim e spent on coding and analysis identified in the second experim ent are also presented
in separate graphs. These graphs allow the individual ]>articipants assigned to the AOP
and OO P implem entations to be directly compared.
To identify causation for the interpreted differences between the AOP and OOP im
plem entations, interviews with participants after the experim ent were held, hi these in
terviews the experience of the participants are recorded. These recorded interviews were then transcribed and used to identify causation of the graphed data.
2 .2 .2 E m p ir ica l E v id e n c e
The results of the first experim ent indicated th at the Aspect.! im plem entation was more
analysable. The pairs who aruilysed the AspectJ im plem entation took less time to identify
faults, switched between files less and performed more sem antic analysis. These results
suggest th a t the AspectJ im plem entation was easier to analyse than the Java implemen tation. Transcriptions of interviews with participants after the experiments identify th a t
the localisation of synchronisation behaviour in the A spectJ im plem entation made the
analysis easier.
The results of the second experiment indicated th a t the A spectJ im plem entation wcis less changeable. The graphical analysis suggests th a t overall, the changes took more tim e
to implement using A spectJ. However, analysis of the proportions indicate th a t more tim e is spent on analysis in the Em erald im plem entation and more time was spent on
im plem entation in the A spectJ. This again implies th a t A spectJ is more analysable but it also indicates th a t the A spectJ imj)lementation is harder to change.
2.3
B artsch and H arrison
Bartsch and Harrison [14] present a similar study to Walker et al [149]. Their study gathers empirical evidence of the comparative effect of AOP and OOP on analysability
Phase 1; j
Group A ssignm ent |
Phase 2: ' Q uestionnaire i
Figure 2.3: B artsdi and Harrison Experiment
2 .3 .1 S t u d y
Figure 2.3 shows the two phases of the study. In the first phase, study participants are assigned into groups to work on AOP and OOP im plem entations of an simplified version of an online shop program. In the second phase, participants of each group were asked to answer a questionnaire. The questionnaire defined both analytical tasks and a task in wliich clianges are applied to the implementation.
G rou p A ssig n m e n t
Eleven professional software engineers with between two and five years experience took part in this study. None of the participants had any prior experience of AOP. To ensure th a t these professionals were equally able to understand and apply changes to both As- pectJ and Java implem entations of a program, a series of five introductory sessions in an online tutorial based on AspectJ was used. Each participant was randomly assigntKi to an AspectJ or Java implem entation of an highly simplified version of an online shop program.
Q u estio n n a ire
Based on their assigned implem entation, each participant was then asked to fill in a questionnaire which asked the participant to: identify all classes and aspects in the source code (Q l); identify the o utput of the software (Q2); implement a new requirement (Q3); and rate the understandability on a scale of 1 to 5 (Q4). This questionnaire was based on refinements of an initial questionnaire use in a pilot and pre-pilot tests.
A n a ly sis
The answers to Q l, Q2 and Q3 were compared for both Java and AspectJ implem entations based on measures of the tim e taken to answer each question and the accuracy of answer.
Professionals
AOP OOP
^
'—
X
O Online Shop O "■"■ I ■1 AspectJ Java f
t
Q uestiunndire |
2.4. LOPES A N D B A JR A C H A R Y A
V ersion 1
W inery i Initial P ro g ram "
J 1
h Jdva 2 Java M a in te n a n c e 3 Java A ctivities 4 AspectJ ;
5 AspecU 1 6 AspectJ i
M e a s u r e o p tio n v a lu e
Ig u re 2.4: Lopes and B ajrac h ary a S tu d y
Tlie comparison of the answers for Q 1-3 indicated th a t there were very few differences in tlie accuracy of the answers h ut siiowed there was a large a m ount of variation in the am o u n t of time taken to answer these questions. For this reason the accuracy was dro{)ped as a point of comparison. For Q3 an additional point of com parison is the num ber of lines of code th a t needed to be changed to implement a new requirement. T h e ratings in response to Q4 were directly com pared for l)oth Java and A spectJ implementations.
Statistical sunnnaries represented as numeric tables and boxplots of tliese measures for Q l-4 are presented to facilitate ease of comparison. T h e significance of observed differences between measures for AspectJ and Jav a is tested using tlie M a im W hitney and V tests 1121, 41|. T h e M an n W h itn e y and T tests indicate w hether the two median or m ean values for these measures are significantly different for Aspect.! and Java implementations.
2 .3 .2 E m p ir ica l E v id e n c e
For Q l , the median and mean time taken to identify all classes and aspects is the same for both Aspect.) and .lava implementations. For Q2, there is no significant difference between the median and mean time taken identify the o u t p u t of th e software for the Aspect.l and J av a implementations. Similarly for Q3, the median and mean time taken and lines of code changed to implement a new requirement were not significantly higher for the A spectJ im plementation. For Q4, th e medians are the sam e but there is a iiigher level of variation in the ratings for A spectJ. These comparisons suggest th a t there is no significant difi’erence between the effects of A O P and O O F on analysability and changeability.
2.4
Lopes and Bajracharya
2.4.1 S tu d y
111 tliis stu d y five iiiaintenaiice activities are applied to a w eb-based w inery locator iinple- nien tatio n . F igure 2.4 illu stra te s th e six versions of the iinplenientation th a t re su lt. T he inaiiitenaiice activities differ in th eir goals but also in th e prograniniing language used to a])ply each m aintenance activity.
P r o g r a m a n d M a in te n a n c e A c t iv it ie s
T h e in itial im plem entation provides very basic features of th e winery locater pro g ram and is w ritte n in Java. T he first two inaintenance activities extend the set of features provided by the initial im plem entation. T hese extensions are applied using Java. T h e first m aintenance ac tiv ity adds new features. T he second inaintenance ac tiv ity in troduces a logging st^rvice.
T h e next th ree m aintenance activities refactor the extended version of th e winery locater. These extensions are applied using A spectJ. In the first refactoring, asp ects are in tro d u ced to decou])le core m odules in th e im plem entation. In the second refactoring, logging and an a u th e n tic a tio n feature are refactored using aspects. In the th ird and final refactoring, the web front for th e program is refactored to introduce aspects to decouple th e web front from the core apj)lication.
M e a s u r e m e n t a n d A n a ly s is
For each version of the im plem entation, a design stru c tu re m a trix is co n stru c te d . T his m a trix represents the depentlencies betw een the m odules and interfaces th a t m ake up th e im plem entation. T h e value of the im plem entation is cjilculated based on th e o ptions available for replacing m odules and extending. These options are identified by analysing th e design stru c tu re m a trix and th eir value is m easured using a m odel typically used in financial context. T h e im pact of a m aintenance activ ity is m easured by ca lcu latin g the difiereiice in the value of th e im plem entations before and afte r th e m ain ten an ce ac tiv ity is applied.
T h e analysis appro ach in th is stu d y is ra th e r simple. T h e im pacts of ecich m ain ten an ce ac tiv ity is deem ed positive if th e value of th e im jjlem entation increases and negative if it decreases. T he efiects of th e Jav a and A spect J based m aintenance activities are com pared based on w hether th ey result in positive or negative effects.
2 .4 .2 E m p irica l E v id e n c e
In this study, the extensions to th e Jav a im plem entation b o th increase its vjiliie. T h e first tw o of th e th ree A sp ectJ based refactorings increase th e value over th e Jav a bcised extensions to the im plem entation. T his com parison provides evidence to ind icate th a t
2.5 . LI E T AL.
Version J a v a Email S erv er
Initial Program r
M aintenance' Activities
1 1 Java i AspectJ
2 1 Java ^ AspectJ
3 1 Java 1 AspectJ
4 1 Java 1 AspectJ
M easu re num ber of c h a n g e d lines of c o d e & c o m p o n en ts
I'igure 2.5; Li et al. S tu d y
A O P lias the potential to improve th e vahie of the options to facihtate ciiange. This evidence suggests tiiat changeabiHty is improved using AOP. T h e final A spectJ based refactoring decreases the im plem entations value. This refactoring illustrates th e misuse of A O P c o nstruc ts and provides heuristics to aid developers using A O P to avoid similar misuse.
2.5
Li et al.
Li et al. [92] present a stu d y th a t g ath ers empirical evidence of th e com p arativ e effect of AOl^ and O O P on changeability.
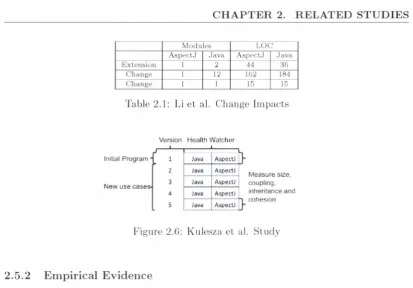
2 .5 .1 S t u d y
T h e s tu d y is based on measuring th e size of th e im pact of applying three m aintenance activities to A O P and O O P im plem entations of a program. Figure 2.5 illustrates the three m aintenance activities cumulatively applied to initial A sp ec tJ and Java im plem entations of .Java Email Server.
P ro g r a m and M a in ten a n ce A c tiv itie s
'This is an open source email server w ritten in J av a which has 21 classes and 1400 Lines Of Code (LOG). T h e first of the three m aintenance activities adds a spam filtering feature to the email server. T h e second change refactors th e logging system and the th ird change replaces th e im plementation of the sp am filtering feature.
M e a su re m e n t and A n a ly sis
M odules LOC A spectJ Java A spectJ Java
E xtension 1 2 44 36
C hange 1 12 162 184
C hange 1 1 15 15
Table 2.1: Li et al. Change Impacts
Version Health Watcher Initial Program •
New use cases-J
1 Java AspectJ i
2 Java AspectJ i
M e a s u r e s iz e , 3 Java AspertJ 1 c o u p lin g , 4 Java AspectJ I in h e r ita n c e a n d
5 Javd A ip ectJ I
c o h e s io n
Figure 2.(5: Kulesza et al. S tudy
2 .5 .2 E m p ir ic a l E v id e n c e
'ia b le 2.1 illustrates the num ber of modules and LOC changed when ap[)lying each m ain tenance activity for the Aspect.! and .Java ap{)roach. Tins table shows th a t fewer modules and LOC need to be changed in the Aspect.1 implementation. Based on this table, Li et al. conclude th a t using A O P to apply changes can improve changeability over OOP.
2.6
K u lesza et al.
Kulesza et al. [87]