www.wjpr.net Vol 4, Issue 1, 2015. 1872
DEVELOPMENT AND VALIDATION OF RP-HPLC METHOD FOR
SIMULTANEOUS ESTIMATION OF RANITIDINE AND
ONDANSETRON IN PHARMACEUTICAL FORMULATIONS
Vaibhav R. Mandale1*, Subhash S. Palekar1, Monali V. Patel2, Niyati A. Borkar3,
Avinash R. Tekade4, Archana M. Karnik5
1
Department of Quality Assurance Techniques, JSPM’s Rajarshi Shahu College of Pharmacy & Research, Tathawade (Village), Pune (Dist) – 411 033, Maharashtra, India.
2
Ranbaxy Laboratories Ltd, Industrial Area Iii, Devas-455001, MadhyaPradesh, India.
ABSTRACT
A new simple isocratic analytical method has been developed and validated for estimation of Ranitidine and Ondansetron simultaneously by RP-HPLC in bulk and pharmaceutical combined dosage form. The separation was carried out by using Agilent CN 250 mm X 4.6 mm 5 μm column with mobile phase containing the mixture of Acetonitrile:
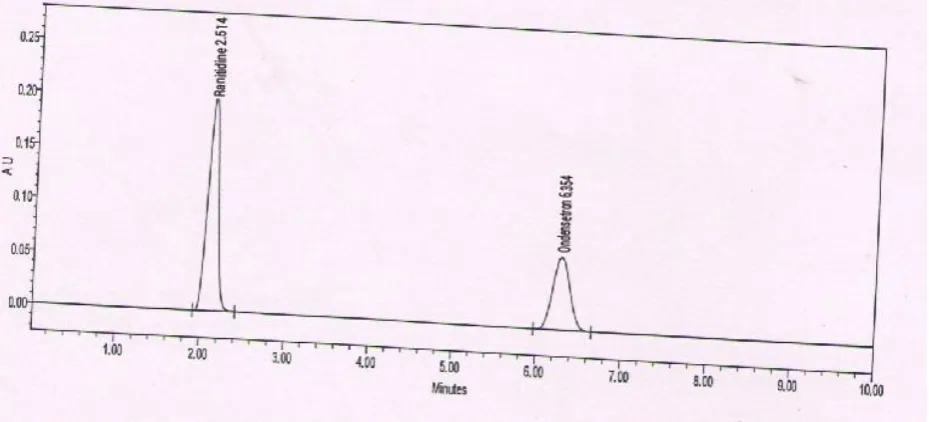
Buffer in ratio of 55: 45% v/v. The mobile phase was pumped at a flow rate of 1.0 ml/min and UV detection was found at 225 nm. The selected chromatographic conditions were found to separate Ranitidine (Rt = 2.514 min) and Ondansetron (Rt =6.354 min) having a good resolution. Linearity of Ranitidine and Ondansetron was found to be 50 – 200 μg/ml and 8 - 32 μg/ml respectively with correlation coefficient
of 0.999 & 0.999 respectively. The developed method was validated as per ICH guidelines. The amounts of both the drugs were found to be in good agreement with label claim. The developed method was validated for precision, accuracy, sensitivity, robustness and ruggedness. Hence, this method is used for routine analysis of titled drugs in combination of injection formulation.
KEYWORDS: Ranitidine, Ondansetron, RP-HPLC, Validation.
INTRODUCTION
Ranitidine and Ondansetron is combined dosage form used to treat immediate side effects with cancer chemotherapy are nausea and vomiting & Gastric ulcers exist in patients who
Volume 4, Issue 1, 1872-1881. Research Article ISSN 2277– 7105
Article Received on 11 Nov 2014,
Revised on 06 Dec 2014, Accepted on 31 Dec 2014
*Correspondence for
Author
Vaibhav R. Mandale
Department of Quality
Assurance Techniques, JSPM’s Rajarshi Shahu
College of Pharmacy &
Research, Tathawade
(Village), Pune (Dist) –
411 033, Maharashtra,
www.wjpr.net Vol 4, Issue 1, 2015. 1873
following cancer chemotherapy so we need therapy for that. The combination of Ranitidine & Ondansetron drugs are very effective for the treatment of nausea, vomiting & Gastric ulcers. In combination, these drugs do not show any adverse pharmacokinetic interaction. Ranitidine (RAN) is chemically Dimethyl[(5-{[(2-{[(E)-1- (methylamino)-2 nitroethenyl] amino}ethyl) sulfanyl] methyl}furan-2-yl) methyl]amine. The H2 antagonists are competitive inhibitors of histamine at the parietal cell H2 receptor. They suppress the normal secretion of acid by parietal cells and the meal-stimulated secretion of acid. They accomplish this by two mechanisms: histamine released by ECL cells in the stomach is blocked from binding on parietal cell H2 receptors which stimulate acid secretion, and other substances that promote acid secretion (such as gastrin and acetylcholine) have a reduced effect on parietal cells when the H2 receptors are blocked.
Ondansetron (OND) hydrochloride is chemically 1, 2, 3, 9-tetrahydro-9-methyl-3-[(2-methyl-1H-imidazol-1-yl) methyl]-4H-carbazol-4-one, monohydrochloride, dihydrate. It represents the class of selective 5-HT3 antagonists which is commonly employed as anti-emetic in combination with anti-ulcer and anti-cancer agents.
Literature survey reveals that only one method was reported for simultaneous estimation of Ranitidine and Ondansetron by RP-HPLC.[3] Some other methods reported for these combination of drugs are simultaneous estimation by UV methods.[4] The chemical structures of Ranitidine and Ondansetron are given in fig no. 1 & 2 respectively.
Fig no: 1 Structure of Ranitidine.
www.wjpr.net Vol 4, Issue 1, 2015. 1874 MATERIALS AND METHODS
Chemicals
Ranitidine and Ondansetron standards are obtained from Ranbaxy Laboratories Ltd, Devas, MadhyaPradesh. The HPLC Grade solvents of Milli Q Water, Triethylamine and Acetonitrile were purchased from Merck (India) Ltd., Ortho-phosphoric acid of analytical Grade was purchased from S.D Fine chemicals Ltd., Mumbai, India. The injection formulation (DORAN-O) was purchased from Indian market, containing Ranitidine (50 mg), Ondansetron (8 mg) which was manufactured by Bestochem Formulations (India) Ltd.
Instrument
Chromatographic analysis was performed on Agilent Technologies-1200 separation module instrument equipped with UV Detector controlled by EZ-Chrome Software, with auto injector.
Column used for chromatographic separation was Agilent CN 250 mm X 4.6 mm, 5 μm. Cyber labs sonicator was selected for experiment.
Chromatographic Conditions
The chromatographic separation of Ranitidine and Ondansetron was achieved on Agilent CN column by using mobile phase composed of Acetonitrile: Buffer in ratio of 55 : 45 % v/v; at a flow rate of 1.0 ml/min with run time of 10 minutes. Detection of both drugs was carried out at 225 nm by using Diluent as mobile phase.
Preparation of Buffer Solution
Dissolve accurately weighed about 7G of KH2PO4 in 1000ml HPLC water then adjusts the
solution to pH 5.5 with Ortho phosporic acid and Triethylamine.
Preparation of mobile phase
450 ml of buffer solution combined with 550 ml of Acetonitrile to get 1000 ml of solution. The prepared mobile phase was filtered through 0.45 μm Nylon syringe filter, sonicated and degassed before use. The injected volume was 10 μL and column was maintained at ambient
temperature.
Diluent
www.wjpr.net Vol 4, Issue 1, 2015. 1875 Standard Stock Solution
Weighed accurately about 50 mg of Ranitidine working standard and 8 mg of Ondansetron working standard into a 100 ml volumetric flask and added 70 ml of diluent, sonicated to dissolve and diluted to the volume with diluent. Further diluted 1 ml to 10 ml with the diluent. From stock solutions of Ranitidine and Ondansetron serial dilutions were made and solutions were injected into HPLC system. From the obtained results calibration curve was plotted between Peak areas (Vs) Concentrations of both drugs. A typical chromatogram of showing Retention time of 2.986 min & 6.862 min Ranitidine and Ondansetron respectively, which was given below in fig no: 3. Similarly marketed product was analyzed by below procedure and sample chromatogram was given in Fig no: 4.
[image:4.595.76.541.293.504.2]Fig no: 3 A Chromatogram of Ranitidine and Ondansetron (standard).
www.wjpr.net Vol 4, Issue 1, 2015. 1876 Analysis of Injection Dosage Formulation
[image:5.595.90.506.562.709.2]To determine the content of Ranitidine and Ondansetron in injections (DORAN-O label claim: RAN-50 mg, OND-8 mg), The volume equivalent to 1 injection was taken and dilute with 70 ml of diluents and sonicated for 10 min to dissolve the contents and then volume was made up to the mark with Diluent. The resulted solution was filtered through 0.45μm Nylon syringe filter. From the filtrate 10 ml was transferred into 50 ml of volumetric flask and made up the volume with diluent to get target concentration of 100 μg/ml and 16 μg/ml of Ranitidine & Ondansetron respectively. The amount of RAN & OND was determined. The assay and recovered values presented in Table no: 1.
Table no: 1 Percent Assay and recovered studies.
Drug Label claim (mg) Amount found (mg) % Label claim
Ranitidine 50 49.5 99.0
Ondansetron 8 7.9 99.4
Validation of Method
The HPLC method was validated in accordance with ICH guidelines.
Linearity
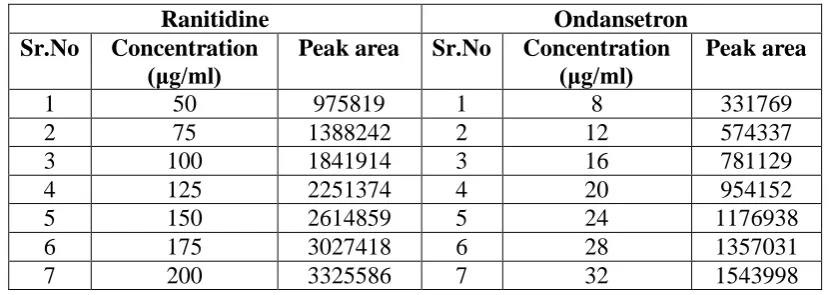
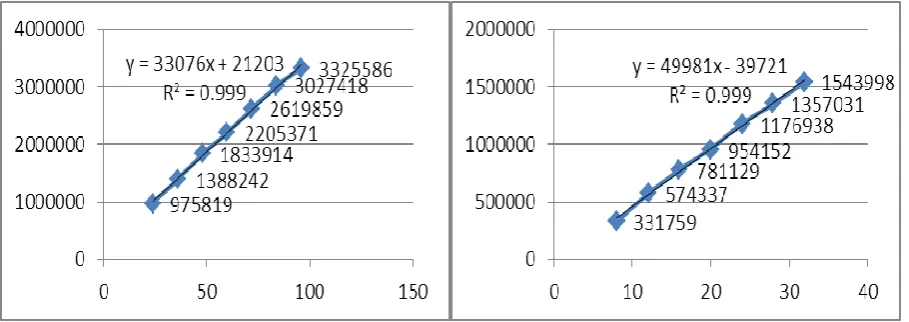
The linearity was determined separately for RAN & OND. Linearity of the method was studied by injecting different concentrations of both drugs prepared and calibration curve were constructed by plotting peak area against their respective concentrations shown in fig no: 3. The RAN & OND followed linearity in concentration range of 50 - 200 μg/ml and 8- 32 μg/ml respectively. The results were shown in Table no: 2.
Table no: 2 Linearity data of Ranitidine and Ondansetron.
Ranitidine Ondansetron
Sr.No Concentration (μg/ml)
Peak area Sr.No Concentration (μg/ml)
Peak area
1 50 975819 1 8 331769
2 75 1388242 2 12 574337
3 100 1841914 3 16 781129
4 125 2251374 4 20 954152
5 150 2614859 5 24 1176938
6 175 3027418 6 28 1357031
www.wjpr.net Vol 4, Issue 1, 2015. 1877 Fig no: 3 Calibration curve of Ranitidine and Ondansetron.
Precision
[image:6.595.119.479.422.581.2]The system precision of the method was verified by six replicate injections of standard solution containing RAN & OND. The method precision was carried out by injecting the sample six times using the proposed method. Repeatability was measured by multiple injections of homogenous sample of RAN & OND. The precision values of both drugs given in Table no: 3 (a) & 3 (b).
Table No: 3 (a) Precision data of Ranitidine.
Ranitidine
Method Precision Inter Day
Sr.No. Rt Peak area Sr.No Rt Peak area
1 2.375 2156669 1 2.375 2156659
2 2.376 2169051 2 2.376 2169051
3 2.380 2162695 3 2.380 2162692
4 2.381 2100336 4 2.381 2100326
5 2.380 2150510 5 2.380 2150510
6 2.314 2147506 6 2.314 2147026
Avg. 2147795 Avg. 2147741
%RSD 1.28 %RSD 1.26
Table no: 3 (b) Precision data of Ondansetron.
Ondansetron
Method Precision Inter Day
Sr.No. Rt Peak area Sr.No Rt Peak area
1 6.805 927592 1 6.865 927291
2 6.816 927813 2 6.816 919813
3 6.865 911816 3 6.805 913412
4 6.889 910993 4 6.829 910412
5 6.907 911349 5 6.937 911351
6 6.914 920147 6 6.914 920258
Avg. 918285 Avg. 917090
www.wjpr.net Vol 4, Issue 1, 2015. 1878 Accuracy
Accuracy was carried out by % recovery studies at three different concentration levels. To the pre-analysed sample solution of RAN & OND, a known amount of standard drug powder of RAN & OND were added to 50, 100, 150% level. The values of recovery studies of both drugs were given below in Table no: 4.
Table no: 4 Recovery studies of Ranitidine and Ondansetron.
Ranitidine Ondansetron
Concentrations % Recovery Mean %
Recovery Concentrations % Recovery
Mean % Recovery
50% 99.7
100.1
50% 99.9
99.5
100% 100.3 100% 99.6
150% 100.4 150% 99.1
Specificity and Selectivity
Specificity of the method was determined through study of resolution factor of drug peak from the nearest resolving peak. Specificity is a procedure to detect quantitatively the analyte in presence of component that may be expected to be present in the sample matrix, while selectivity is the procedure to detect qualitatively the analyte in the presence of components that may be expected to be present in the sample matrix.
Limit of Detection and Limit of Quantification
Sensitivity of the proposed method was estimated in terms of Limit of Detection (LOD) and Limit of Quantification (LOQ)
LOD = 3.3 × ASD/S & LOQ = 10 × ASD/S
Where, ‘ASD’ is the average standard deviation & ‘S’ is the slope of the line.
LOD & LOQ values of Ranitidine and Ondansetron were given in Table no: 6.
System Suitability Test
The system suitability parameters such as resolution, number of theoretical plates and tailing factor were studied and those parameters of both drugs were summarised in Table no: 5.
Table no: 5 System suitability parameters.
Parameter Ranitidine Ondansetron
Retention time 2.182 6.264
Theoratical plates 5185 6112
Tailing factor 1.14 1.40
www.wjpr.net Vol 4, Issue 1, 2015. 1879 Robustness
Robustness was evaluated by making deliberate variations in method parameters such as variation in wavelength, flow rate, change in composition of mobile phase. The robustness of the method was studied for RAN & OND. The results were within accepted limit i.e. their % RSD is less than 2.
Table no: 6 Robustness data of Ranitidine.
Sr.no Parameter Rt Area Theoratical plates Tailing factor
1
Flow Rate
0.9 2.502 2251451 5057 1.39
2 1.0 2.498 2199041 5168 1.33
3 1.1 2.566 2188254 5599 1.36
1
Wavelength
220 2.149 2101542 5156 1.067
2 225 2.587 2144259 6168 1.33
3 230 2.456 2147026 4238 1.080
Table no: 7 Robustness data of Ondansetron.
Sr.no Parameter Rt Area Theoratical plates Tailing factor
1
Flow Rate
0.9 6.505 910412 6464 1.56
2 1.0 6.460 911351 6732 1.49
3 1.1 6.398 920258 7199 1.49
1
Wavelength
220 6.862 916234 3685 0.866
2 225 6.862 924560 5732 1.49
3 230 6.852 912843 3680 0.872
RESULTS AND DISCUSSION
The proposed chromatographic method was found suitable for effective separation and quantization of Ranitidine (Rt: 2.512 min) and Ondansetron (Rt: 6.354 min) with good resolution, peak shape and with minimal tailing. The peak areas of the drugs were reproducible as indicated by low efficient of variance indicating repeatability of the proposed method. Both the drugs were found to give linear detector response in the concentration range under study with correlation coefficient of 0.999 and 0.999 for Ranitidine and Ondansetron respectively. The sample recoveries from formulation were in good agreement with their respective label claim indicating there is no interference from the injection excipients.
www.wjpr.net Vol 4, Issue 1, 2015. 1880
[image:9.595.131.465.166.315.2]method is validated by change in flow rate, change in composition of mobile phase ratio & change in wavelength and their % RSD of those variations was less than 2. Summarised validation parameters presented in Table no: 6.
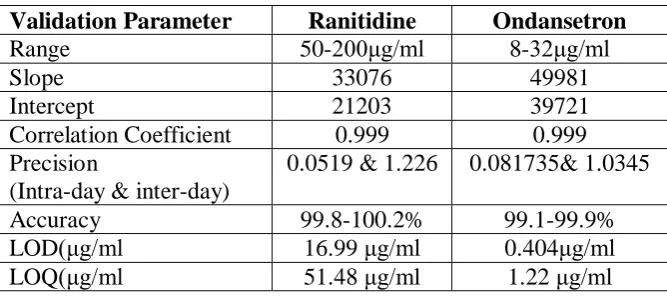
Table no: 8 Overall validation parameters are summarised below.
Validation Parameter Ranitidine Ondansetron
Range 50-200μg/ml 8-32μg/ml
Slope 33076 49981
Intercept 21203 39721
Correlation Coefficient 0.999 0.999 Precision
(Intra-day & inter-day)
0.0519 & 1.226 0.081735& 1.0345
Accuracy 99.8-100.2% 99.1-99.9%
LOD(μg/ml 16.99 μg/ml 0.404μg/ml
LOQ(μg/ml 51.48 μg/ml 1.22 μg/ml
CONCLUSION
The proposed method was validated as per ICH guidelines. The standard deviation and % RSD calculated for the proposed method is low, indicating high degree of precision of the method. The results of the recovery studies performed show the high degree of accuracy of the proposed method. Hence, it can be concluded that the developed RP-HPLC method is accurate, precise and selective and can be employed successfully for the simultaneous estimation of Ranitidine and Ondansetron in bulk and marketed formulations.
ACKNOWLEDGEMENT
The authors are thankful to Ranbaxy Laboratories Ltd, Devas, MadhyaPradesh for providing gift samples of Ranitidine and Ondansetron. The authors would like to thanks, regular counsel and guidance of Principal. Dr.K.R.Khandelwal, Prof.Dr.A.R.Tekade, Prof.Dr.A.P.Pandit, Prof.Dr.A.S.Sayare, Prof.Dr. Archana Karnik, Department of Quality Assurance Techniques, Rajarshi Shahu College of Pharmacy & Research, Savitribai Phule Pune University, Pune,(Dist.), Maharashtra, and special thanks to Dr.Subhash Palekar, Miss. Monali Patel, for providing necessary facilities to carry out the Research work.
REFERENCES
1. http://en.wikipedia.org/wiki/Ranitidine. 2. http://en.wikipedia.org/wiki/Ondansetron.
www.wjpr.net Vol 4, Issue 1, 2015. 1881
estimation of ondansetron and ranitidine in pharmaceutical formulation, International Journal of Health & Allied Sciences, Apr-Jun 2012; 1(2).
4. S. PILLAI AND I. SINGHVI* Spectrophotometric Simultaneous Estimation of Ranitidine Hydrochloride and Ondansetron hydrochloride from Tablet Formulation, Indian Journal of Pharmaceutical Sciences, July - August 2007.
5. Naresh*, T. Ganesh, A. Biswal and G. Nagarjuna Reddy, International RP-HPLC method development and validation studies of Ranitidine Hcl and Domperidone, Journal of Chemical and Natural Science, 2013; 1(1): 25-28.
6. Gauri Rani Das, Md. Ahsanul Haque, Mohammad Shahriar and S.M. Ashraful Islam* A Simple RP-HPLC Method for the simultaneous estimation of Ranitidine hydrochloride & Domperidone in combine dosage form, PHARMA SCIENCE MONITOR, AN INTERNATIONAL JOURNAL OF PHARMACEUTICAL SCIENCES, Oct 2012; 3(3). 7. United State Pharmacopoeia (USP) section <1225> Validation of Compendial Method. 8. ORA Laboratory Procedures, Food and Drug Administration Document No.: ORA
LAB.5.4.5 Title: Methods, Method Verification and Validation.
9. P.D. Sethi – Quantitative Analysis of Drugs in Pharmaceutical Formulations (VBS Publishers, Delhi).
10.R.J. Hamilton and P. A. Sewell- Introduction to High Performance Liquid Chromatography. (Chapman and Hall, London).
11.Ira R. Berry & Robert Nash, Pharmaceutical Process Validation, Third Edition,Marcel Dekker Inc.
12.F.J. Carleton and J.P. Agalloco, Validation of Pharmaceutical Process (Sterile Products), Third Edition Revised 55 & Expanded, Marcel Decker Inc.
13.D. A. Savant, The Pharmaceutical Sciences, Pharma Pathway- Industrial & Applied Pharmacy, Nirali Prakashan, Pune.
14.Manohar A. Potdar, Pharmaceutical Quality Assurance, Nirali Prakashan, 7.1- 7.36. 15.International Conference on Harmonization, Topic Q2B, Validation of Analytical