AEROACOUSTIC SOURCE SEPARATION ON A FULL SCALE NOSE LANDING
GEAR FEATURING COMBINATIONS OF LOW NOISE TECHNOLOGIES
Eleonora Neri, John Kennedy, Gareth J. Bennett
Department of Mechanical and Manufacturing Engineering, Parsons Building, Trinity College Dublin, Dublin 2, Ireland
ABSTRACT
The reduction of noise generated by aircraft at take-off and approach is crucial in the design of new commercial aircraft. Landing gear noise is significant contribution to the total noise sources during approach. The noise is generated by the interaction between the non-aerodynamic components of the landing gear and the flow, which leads to turbulence generated noise. This research presents results from the European Clean Sky funded ALLEGRA project. The project investigated a full-scale Nose Landing Gear (NLG) model featuring the belly fuselage, bay cavity and hydraulic dressing. A number of low noise treatments were applied to the NLG model including a ramp door spoiler, a wheel axel wind shield, wheel hub caps and perforated fairings. Over 250 far field sensors were deployed in a number of microphone arrays. Since technologies were tested both in isolation and in combination the additive effects of the technologies can be assessed. This study describes the different techniques used to quantify the contribution of each technology to the global noise reduction. The noise reduction technologies will be assessed as a function of frequency range and through beamforming techniques such as source deletion.
NOMENCLATURE
NLG Nose Landing Gear
OASPL Overall Sound Pressure Level OB Octave Band
Pref Reference Sound Pressure prms Root mean square sound pressure SPL Sound Pressure Level
WT Wind Tunnel
x coordinate
y coordinate
z coordinate
INTRODUCTION
Development of novel aircraft concepts requires a complex compromise between contradictory requirements in safety, exhaust emissions, noise, performance and price. Exterior noise of aircraft will, most likely, be subject to further regulation in the future and therefore require additional technological advances for airframe, wing and engine design. To overcome the challenges of providing ultra-light, energy-efficient aircraft with acceptable exterior noise levels, concepts based on smart materials and structures are currently being investigated in the European Joint Technology Initiative Clean Sky. The European objectives, as stated in the ACARE and Flight Path 2050 reports [1], require that perceived noise emissions of flying aircraft and rotorcraft should be reduced in 2050 by 65% relative to 2000 technologies. This goal should be achieved through a significant and balanced research program aimed at developing novel technologies and enhanced low noise operational procedures, complemented by a coordinated effort providing industry, airports and authorities with better knowledge and impact assessment tools to ensure that the benefits are effectively perceived by the communities exposed t noise from air transport activities. More specifically, this amounts to developing technological and operational solutions by 2050, aimed at a 15dB reduction per fixed wing aircraft operation (departure and arrival) with a medium-term target of 11dB by 2035.
The ALLEGRA project was developed in response to the requirements of the European Clean Sky Joint Technology Initiative to assess low noise technologies applied to a full scale nose landing gear model of a regional aircraft. ALLEGRA consisted of a consortium of well recognized universities (Trinity College Dublin, KTH Sweden), a well-known aeroacoustic wind tunnel company (Pininfarina SPA) and SME partners (Eurotech, Teknosud) from around Europe supported by a leading landing gear manufacturer (Magnaghi Aeronautica). This group has well demonstrated competencies Proceedings of the Internoise 2015/ASME NCAD Meeting NCAD2015 August 9-12, 2015, San Francisco, CA, USA
in landing gear design and manufacturing, computational aeroacoustics, noise measurements and data analysis.
For modern aircraft, of all the components of airframe noise, landing gear is considered the dominant noise source during approach and landing [2]. The landing gear noise contributes to approximately 30% of the overall noise emission of the aircraft during take-off and approach phases [3] and the noise signature is broadband in nature covering frequencies from approximately 90 Hz to 4 KHz. The annoyance level associated with noise within this frequency range is high for exposed communities. Landing gear consists of numerous components which are generally not optimized acoustically [4].
In the past full-scale models of landing gear have rarely been tested due to the large test facilities required. Most experimental airframe noise research has been performed using small-scale models. This leads to great difficulty when using model-scale results for full-scale noise predictions due to the lack of details in the geometrical modelling. One of the significant contributions of ALLEGRA is that a full representation of the landing gear detail and associated structures (e.g. bay cavity, bay doors, belly fuselage etc.) have been included and addressed at a full scale.
A range of low noise technologies have been applied to the full scale model both in isolation and in combination. The technologies were assessed for full kinematic feasibility on the landing gear and can therefore be considered highly realistic for real world applications. The project is to be completed in May 2015. This paper focuses on the baseline landing gear and three low noise technologies which were applied individually and then in combination. These technologies included a ramp door spoiler, wheel hub caps and a wheel axle wind shield.
In general, the landing gear noise is dominated by broadband noise (a 3D cluster of broadband noise sources) components due to the complexity of the geometry. Landing gear noise spectrum can be roughly decomposed into three frequency components, namely, the low-, mid- and high-frequency components, respectively, representing contributions from the wheels, the main struts and the small dresses such as hoses, wires and steps. Landing gear noise scales on Strouhal number basis and sound intensities increase with the 6th power of flow velocity (dipole type) [5]. The noise source directivity is almost omnidirectional.
Several innovative methods for reducing landing gear noise have been investigated, such as fairings, ramps, optimized components and bay door designs, acoustic treatment of bays, caps, coverings, meshes, air curtains, plasma actuators, vortex disintegrators and boundary layers suctions. These techniques could be grouped in four groups based on how they function: component enhancement, component smoothing, flow enhancement, flow deflection. The three low noise technologies reported in this work target different physical features on the landing gear and are therefore likely to show additive benefits for the noise reduction.
EXPERIMENTAL SET-UP
Tests were performed in the Pininfarina aeroacoustic facility open jet semi-cylindrical wind tunnel in Turin, Italy, that holds a test section of 8m x 9.60m x 4.20m. The facility contains a low noise high speed fan-drive system of 13 fans in order to increase the wind speed up to 260 km/h and reduce the background noise level to 68 dBA at 100 Km/h. The velocity produced by the wind tunnel is very uniform, since it varies by only 0.5% over the area. The turbulence level is kept between 0.3% and 8%.
Four planar microphones arrays were installed inside the wind tunnel: a 3 meter diameter half-wheel array of 66 microphones positioned on one side, parallel to the model axis and at a distance of 4.22m from it, a far field linear array of 13 microphones on the same side and at the same distance from the axis model, a 78 microphones 3 meter diameter wheel array on the ceiling at a distance of 1.82 meters from the model and a spiral front array of 15 microphones placed upstream the landing gear plane and at an angle of 10 degrees to the same plane. Data were acquired for 10 seconds at a sampling rate of 32768 Hz. The full scale nose landing gear model featuring the belly fuselage and bay cavity was positioned in the wind tunnel so that the distance between the wind tunnel nozzle and the landing gear axis was 2.8 m. Figure 1 the microphone arrays layouts can be found.
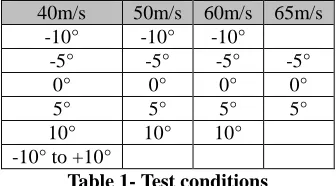
The wind tunnel model had a fixed, built in, angle of attack setting of 4°. Each model configuration was tested at a variety of flow speeds and yaw settings. The yaw settings allowed the performance of the technology to be evaluated under conditions equivalent to landing with a cross wind. These conditions are summarised in Table 1.
40m/s 50m/s 60m/s 65m/s -10° -10° -10°
-5° -5° -5° -5°
0° 0° 0° 0°
5° 5° 5° 5°
10° 10° 10°
-10° to +10°
Table 1- Test conditions
[image:2.612.364.532.440.533.2]A large number of different model configurations were investigated during the test campaign, including different low noise technologies. The configurations reported in this paper are summarized in Table 2. These configurations are shown in Figure 3.
Test ID Description
NLG Base nose landing gear
NL1 NLG + Door spoiler
NL2 NLG + Additional cover between wheels
NL3 NLG + Wheel hub caps
NL6 NLG + NL1 + NL2 + NL3
Figure 1 - Microphones arrays layouts and coordinates: (a) Linear Far Field Array, (b) Front Array, (c) Side Array,
[image:3.612.54.268.309.481.2](d) Top Array
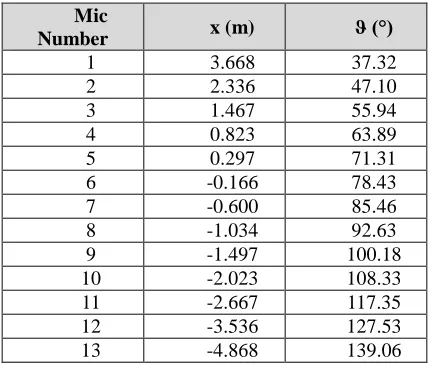
Figure 2 - Diagram of linear far field array angles
Mic
Number x (m) ϑ (°)
1 3.668 37.32
2 2.336 47.10
3 1.467 55.94
4 0.823 63.89
5 0.297 71.31
6 -0.166 78.43
7 -0.600 85.46
8 -1.034 92.63
9 -1.497 100.18
10 -2.023 108.33
11 -2.667 117.35
12 -3.536 127.53
13 -4.868 139.06
Table 3 - Linear far field array coordinates and angles
RESULTS
Results obtained by processing data from the Linear Far Field array and the Side array are reported in this paper. Figure 2 and Table 3 provide more detail on the layout of the Linear Far Field array which covered angles from approximately 37° to 139° from the nose landing gear wheel axel.
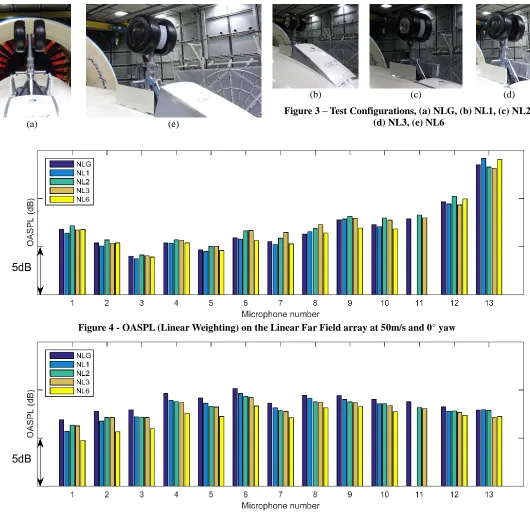
The results for the characterization of the fuselage only background noise and nose landing gear dressing are reported by Neri et. al [6] (IN2015-350). This paper focuses on the NLG baseline landing gear and low noise technologies (NL1, NL2, NL3 and NL6) at 50 m/s, 4⁰ angle of attack and 0⁰ degrees yaw. A comparison between the NLG with and without the application of the low noise technologies is presented. Configurations analyzed and correspondent names used are reported in Table 1. Figure 3 shows the set-up for these configurations. As can be observed, 3 low noise technologies were tested both in isolation and in combination. Figure 3 (a) shows the baseline landing gear with low noise technologies shown in (b), (c) and (d) first tested in isolation and then in combination shown in (e).
Overall Sound Pressure Level
Datasets from all sensors sampled at 32768 Hz for time duration of 10 seconds are processed using NI Sound and Vibration toolkit incorporated into custom software in Labview. For each sensor a 1/3 octave band analysis between 20 Hz and 10 kHz is performed using both linear and A-weighting filters in accordance with IEC 1260:1995 and ANSI S1.11-2004 standards. The linear and A-weighted OASPL was calculated for each microphone of the linear far field array, summing over the 1/3 bands of frequencies from 20Hz to 10 kHz.
[image:3.612.57.272.506.689.2](a) (e)
[image:4.612.39.569.68.580.2](b) (c) (d)
Figure 3 – Test Configurations, (a) NLG, (b) NL1, (c) NL2, (d) NL3, (e) NL6
Figure 4 - OASPL (Linear Weighting) on the Linear Far Field array at 50m/s and 0° yaw
Figure 5 - OASPL (A-Weighting) on the Linear Far Field array at 50m/s and 0° yaw
Source Spectra
Narrow band spectra were obtained using microphone 6 of the Linear Far Field array at an emission angle of approximately 93. Spectra were processed with a block length of 8192 points for and 75% overlap for a frequency resolution of 4Hz. Results are presented in the range of frequencies of interest, from 100 Hz to 3000 Hz, where the main noise sources and the effects of the low noise technologies were identified. Figure 6 shows the spectra for the NLG baseline in comparison with each of the low noise technologies NL1 to NL3 and the
highlights how the component technologies have combined in different frequency ranges to produce the reduction achieved by NL6.
(a) NLG and NL1 (b) NLG and NL2
[image:5.612.43.575.125.579.2](c) NLG and NL3 (d) NLG and NL6
Figure 6 - Narrow Band Spectra at 90°, Flow Speed = 50 m/s, Yaw = 0°
Directivity
In order to further evaluate the directivity of the noise reductions achieved by the isolated and combined low noise technologies spectrograms as a function of frequency and emission angle were generated using the data of the Linear Far Field Array. Data in the range of 100 Hz - 10000 Hz from the 1/3 octave band spectra were used. By subtracting the spectrogram of the baseline NLG configuration from each low noise configuration we can show the ΔSPL(dB) and highlight
technology has very effectively reduced the level of this source. The plot also indicates that there are some further slight (<1dB) noise reductions up to 1kHz and that about 1kHz there is an indication of a 1dB noise increase particularly at emission angles close to 90° along the Linear Far Field array. In summary this technology has achieved a targeted noise reduction in the 200Hz region but with minimal effects elsewhere in the frequency spectrum. Figure 7 (b) reports the results for NL2, additional cover between wheels. The magnitude of the noise reduction is far smaller for this technology with both reductions and increases of 3dB from the baseline at certain frequencies. At low frequencies between 100 and 250Hz there is a noise penalty associated with the technology, however at frequencies ranging from 240Hz to 2kHz there is a noise reduction. This noise reduction is at a higher frequency range than NL1. Figure 7 (c) shows the results for NL3, wheel hub caps. This low noise technology achieves up to 3 dB noise reduction at certain frequencies when
compared to the baseline dressed landing gear NLG. The principle reduction is in the region of 300Hz with other 1.5dB reductions in the 1kHz range. There is an indication of a low frequency penalty at some, mostly upstream, emission angles. There is also a small 0.5dB high frequency penalty above 2kHz across all emission angles. Figure 7 (d) shows that NL6 combines the low frequency noise reduction of NL1 with the noise reduction of NL2 and NL3. From this plot it is clear that the very strong 7dB noise reduction of NL1 is still attained at 200Hz but that this reduction has been broadened to both lower and higher frequencies with greater than 5dB noise reduction achieved between 100Hz and 800Hz for a range of emission angles. There is a minimal high frequency penalty in the region of 2kHz of less than 1dB. This combination technology has achieved significant noise reduction over a wide frequency range greater than any individual technology.
(a) NL1-NLG ΔSPL (b) NL2-NLG ΔSPL
(c) NL3-NLG ΔSPL (d) NL6-NLG ΔSPL
Beamforming
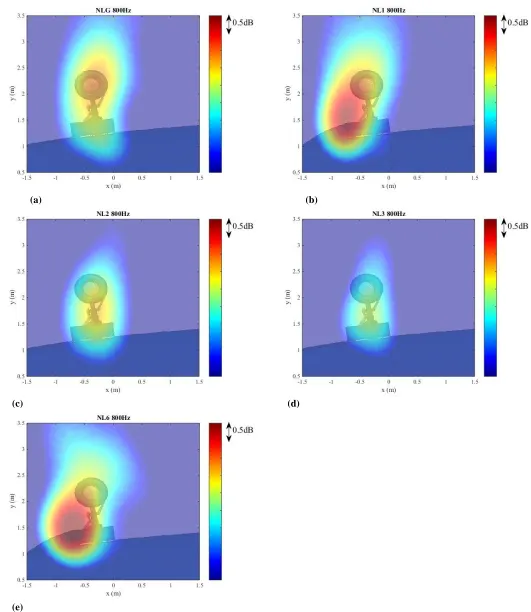
Beam forming results can shed further light on the mechanisms of the identified noise reductions. The nose landing gear is a complex system with many components which are capable of generating noise. A time domain delay-and-sum beam forming algorithm with microphone self-noise removal [7] and shear layer correction [8] in is used to process the data. The side array has been used to scan the noise sources in each 1/3 octave band utilizing band pass filtering of the data prior to application of the beam forming algorithm. The calculation plane is parallel to the related microphone array, at a distance of 4.22 m from it, and is centered on the landing gear vertical axis at the midpoint of the wheel axel. The limitations of the array design prevent useful spatial localization of the sources below the 800Hz 1/3 octave band. The results shown below are for the 800 and 1250 Hz 1/3 octave bands which contain some interesting features based on the results shown in Figure 7. The beamforming maps in Figure 9 and Figure 10 have colour scales which cover the range of the source maximum level in this frequency band less 4dB. The sub-figures all utilize the same colour scale for each figure.
Figure 9 (a) shows a noise source on the baseline NLG configuration with a spatial extent covering the steering pinion, torque links and bay door. Figure 9 (b) shows that the ramp fairing in NL1, door spoiler, produces a stronger noise source in the bay door region with an increase of 1.5dB over the baseline. This is to be expected as the NL1 configuration did not show a beneficial noise reduction in this frequency range. Figure 9 (c) shows that NL2, additional cover between wheels, acts to reduce the spatial extent of the original noise source with a slight reduction in level when compared to the baseline. Figure 9 (c) shows that NL3, wheel hub caps, has the greatest noise reduction in this frequency range of 2dB compared to the baseline. The combined technology NL6 does not perform will in this frequency range showing the same noise increase as NL1 due to the action of the door ramp fairing.
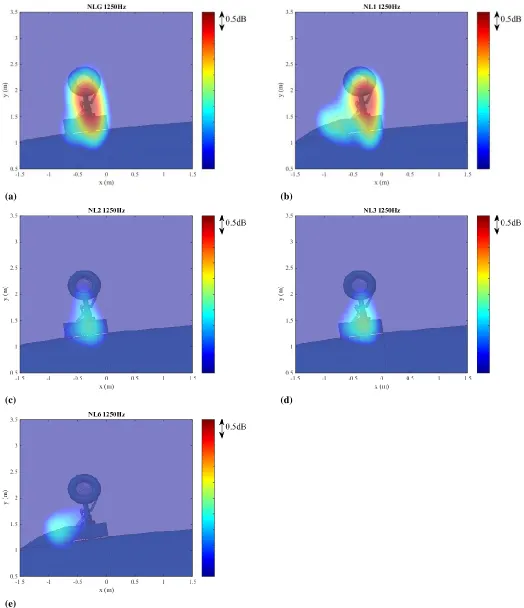
Figure 10 (a) shows the noise sources for the baseline NLG in the 1250 Hz octave band. A significant source is shown on the baseline in the region of the steering pinion and torque links. There are also indications of weaker noise sources on the open bar door. Figure 10 (b) shows that at this frequency range the ramp door (NL1) does not affect the level of the original source but seems to have reduced its spatial extent. NL1 also generates an additional source in the door region, stronger than the sources on the original door design. Figure 10 (c) and (d) show how NL2 and NL3 both act to reduce the original noise source in the region of the steering pinion and torque link by almost 3dB. Figure 10 (e) shows that NL6 has effectively eliminated the original steering pinion and torque link source with a reduction of over 4dB. The strongest remaining noise source in this frequency band is now in the region of the intersection of the bay door and the door ramp fairing. Thus, NL6 can be seen as a combination of the beneficial effects of NL1, NL2 and NL3.
The beam forming technology has successfully identified sources on the landing gear and their relation to the achieved
noise reduction. The actions of the individual technologies to the combined noise reduction of NL6 can be seen. The resolution of the array prevented any useful results in the 300Hz range where the main action of the door ramp fairing was identified.
Beamforming Source Deletion
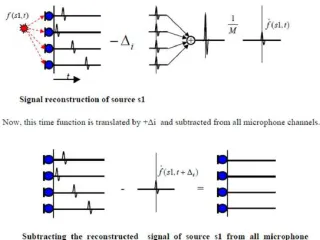
Dobler & Schroder [9] introduced a simple technique to reveal weaker sources by subtractive signal decomposition. In this iterative process the reconstructed signal of the strongest source, which has the form of Equation 1, is sequentially translated by appropriate negative time delays and subtracted from all original microphone signals. This excludes the strongest signal from the noise map and further masked sources become visible.
𝑓̂(𝑠1, 𝑡) =𝑀1∑𝑀𝑖=1𝑤𝑖𝑓𝑖(𝑠1, (𝑡 − 𝛥𝑖)) (1)
The procedure is shown in Figure 8. Although the technique cannot be applied to correlated sources, it suits well the separation of the broadband signals [10]. When applied to the individual and combined low noise technologies the process can reveal additional sources beyond the dominant noise source in the frequency range of interest.
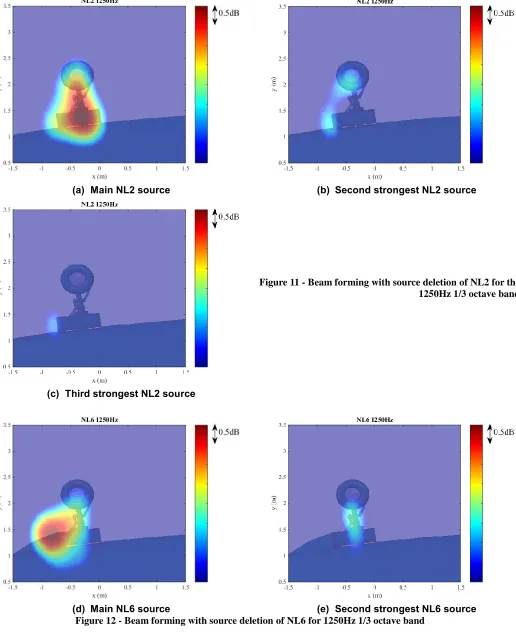
Utilizing this approach for NL2 (additional cover between wheels), shown in Figure 11, we can see the initial beamforming map has a distributed source with a peak covering the steering pinion and torque links. When this peak is removed the contribution wheel region and door edges becomes clearer. A further iteration removes the contribution of the wheel region and the front door edge noise source is the final remaining source. Using this approach we can see that for this technology there were three principal sources in this frequency band which were all similar in level. Any technology which does not target all three sources will not be particularly effect at reducing the level in this band.
[image:7.612.367.527.574.694.2]Taking a similar approach for NL6 reveals the weaker source on the steering pinion and torque links which is hidden by the dominant source due to the ramp door. In this way the beam forming with source deletion has been successfully applied to understand and identify the noise sources on the landing gear. These figures have a 4dB colour scale with the maximum as the peak value of the original noise source.
(a) (b)
(c) (d)
[image:8.612.42.573.82.694.2](e)
(a) (b)
(c) (d)
[image:9.612.49.573.74.682.2](e)
(a) Main NL2 source (b) Second strongest NL2 source
Figure 11 - Beam forming with source deletion of NL2 for the 1250Hz 1/3 octave band
(c) Third strongest NL2 source
(d) Main NL6 source (e) Second strongest NL6 source
CONCLUSIONS
This paper presented results for a full-scale Nose Landing Gear model featuring the belly fuselage, bay cavity and hydraulic dressing and a number of low noise treatments that were applied to the NLG. Since technologies were tested both in isolation and in combination the additive effects of the technologies have been assessed. The study described the different techniques used to quantify the contribution of each technology to the global noise reduction. These techniques are successfully identified the landing gear components responsible for the main noise sources and how the low noise technologies affected these sources. The analysis were performed for a flow velocity of 50m/s, 4⁰ angle of attack and 0⁰ yaw angle.
The paper underlines the frequency range where the main noise sources of the NLG were identified and the low noise technologies work, this was found to be 100 Hz – 1000 Hz. It is also evident that the significant reduction achieved by the NL6 is a combination of the effect of the NL1 (door spoiler) at lower frequencies and of the NL2 (additional cover between wheels) and NL3 (wheel hub caps) at higher frequencies. The directivity and beam forming analysis validate these results. The significant source present in the baseline NLG is eliminated when considering NL6 and a new source is introduced, that is the one generated by the introduction of the NL1 spoiler door.
The use of advanced beam forming techniques, including source deletion, has been successfully applied to decompose the landing gear noise sources and provide greater understanding of the actions of the low noise technologies.
ACKNOWLEDGMENTS
The research leading to these results has received funding from the European Union's Seventh Framework Programme (FP7/2007-2013) for the Clean Sky Joint Technology Initiative under grant agreement n° [308225].
The authors would also like to acknowledge the contribution of Dr. Petr Eret to this work and the completion of the ALLEGRA project.
REFERENCES
1. ACARE (2012) Strategic Research & Innovation Agenda, see www.acare4europe.org.
2. Astley, R.J., Agarwal, A., Joseph, P.F., Self, R.H., Smith, M.G., Sugimoto, R. and Tester, B.J. (2007) “Predicting and reducing aircraft noise” In, 14th International Congress on Sound and Vibration, Cairns, Australia, 09 - 12 Jul 2007. 34pp.
3. J. Piet, N. Molin, and C. Sandu, “Aircraft landing gear provided with at least one noise reducing means,” US Patent 8,256,702, 2012.
4. P. Eret, J. Kennedy, and G. Bennett, “Review of state of the art of landing gear noise reduction technologies.” Technical Report, Trinity College Dublin, 2012.
5. P. M. Morse, and K. U. Ingard, “Theoretical Acoustics”, Princeton University Press, pp.761-763, 1968.
6. Neri, E. Kennedy, J. Bennett, G., O’Reilly, C. Dahan, J., Efraimsson, G., Esposito, M., Amoroso, F., Bianco, A., Massimiliano, B., 2015, “Characterization of low noise technologies applied to a full scale fuselage mounted nose landing gear”, Proceedings of the Internoise 2015/ASME NCAD Meeting, Internoise2015 August 9-12, San Francisco, California, USA
7. Dougherty, R. P. (2004). “Advanced time-domain beamforming techniques.” Proceedings of the 10th AIAA/CEAS Aeroacoustics, (pp. 1754–1764). Manchester, UK.
8. Padois, T., Prax, C., & Valeau, V. (2013). “Numerical validation of shear flow corrections for beamforming acoustic source localisation in open wind-tunnels.” Applied Acoustics 74(4), 591 – 601.
9. Dobler, D., & Schroder, R. (2010). “Contrast improvement of acoustic maps by successive deletion of the main sources.” Proceedings on CD of the 3rd Berlin Beamforming. Berlin.