www.wjpr.net Vol 6, Issue 14, 2017. 1192
COMPARISON STUDIES SHOWING SWELLING EFFECT AND DRUG
RELEASE PATTERN FROM MATRICES CONTAINING DIFFERENT
DRUGS AND SAME POLYMER COMBINATIONS
Masheer Ahmed Khan*
School of Pharmacy, Devi Ahilya Vishwavidyalaya, Takshshila Campus, Khandwa Road,
Indore, 452001, India.
ABSTRACT
Polymers are excellent drug carriers and widely used in the
formulation of matrices to prolong the release of drug from the
devices. The present comparison studies shows swelling effect and
drug release pattern from matrices of Atenolol and Diltiazem
hydrochloride drugs containing same polymer combinations. Matrices
of both the drugs are prepared using same grades of hydroxypropyl
methylcellulose (HPMC), viz, HPMCK4M, HPMCK15M and
HPMCK100M. The study examines the degree of swelling and percent
water uptake for matrices containing same polymer concentrations and
combinations. The results indicate that swelling and release profiles
were affected by concentration and viscosity grades of the polymer.
The higher amount of polymer causes a greater degree of swelling this in turn reduces the
drug release, as the diffusional path length of drug is longer and conversely, reduction in the
amount of polymer reduces the degree of swelling and the thickness of gel layer, this enables
faster drug release. Swelling studies reveals an inverse relationship between swelling effect
and drug release pattern from both the drugs matrices using the same polymer combinations.
Comparison studies shows almost similar swelling effect and drug release pattern from
matrices containing different drugs and same polymer combinations.
KEYWORDS: Polymer, Swelling, Matrices, Drug release.
INTRODUCTION
The aim of the present study was to compare swelling effect and drug release pattern from the
matrices of atenolol and diltiazem hydrochloride prepared using same grades of
Volume 6, Issue 14, 1192-1201. Research Article ISSN 2277– 7105
Article Received on 20 September 2017,
Revised on 11 October 2017, Accepted on 01 Nov. 2017
DOI: 10.20959/wjpr201714-10064
8533
*Corresponding Author
Masheer Ahmed Khan
School of Pharmacy, Devi
Ahilya Vishwavidyalaya,
Takshshila Campus,
Khandwa Road, Indore,
www.wjpr.net Vol 6, Issue 14, 2017. 1193
hydroxypropyl methylcellulose (HPMC), viz, HPMCK4M, HPMCK15M and HPMCK100M.
Sustained release drug delivery system is designed to achieve a prolonged therapeutic effect
by continuously releasing medication over an extended period of time after administration of
a single dose. Hydrophilic matrices devices are one of the least complicated approaches in the
formulation of sustained release dosage forms and are finding increasing application in the
pharmaceutical field.[1-6]
Drug release data from HPMC matrices for both the drugs follows the classical Higuchi
dissolution equation, relating drug release with square root of time. Swellable systems
consisting of hydrophilic polymers, in the presence of water, absorb a significant amount of
water to form a gel. As the dissolution medium penetrates the matrix, polymer material
swelling starts and drug molecules begin to move out of the system by diffusion. The degree
of swelling and percent water uptake is determined to find the relationship between the drug
release and swelling. The release mechanism is obtained from the dissolution data and the
value of release rate exponent is determined. The value of release rate exponent (n) is a
function of geometric shape of the drug delivery device. The release is mainly determined by
the Fickian diffusion which is also confirmed from the n values.[7-12]
EXPERIMENTAL
MATERIALS AND METHODS
Atenolol and Diltiazem hydrochloride were obtained as a gift sample from Pure Pharma.
Labs Ltd, Indore, (M.P.), HPMC (K4M, K15M, K100M) were provided by Colorcon
India Ltd., Goa, dicalcium phosphate, microcrystalline cellulose (Avicel), talc , magnesium
stearate and all other reagent used were of analytical grade.
Preparation ofMatrices
Nine formulations of Diltiazem hydrochloride employed for investigations containing
different ratios of HPMC of different grades were prepared by direct compression and coded
C1, C2, C3, D1, D2, D3, E1, E2 and E3. Similarly nine formulations of Atenolol containing
the same grades of HPMC were prepared and coded F1, F2, F3, G1, G2, G3, H1, H2, and H3.
The ratios of different grades of HPMC employed are shown in Table.[1] The amount of drug,
magnesium stearate, MCC and talc were kept constant while dicalcium phosphate was taken
in sufficient quantity to maintain a constant tablet weight of 120 mg. All the products and
process variables (other than the concentrations of two polymers) like mixing time,
www.wjpr.net Vol 6, Issue 14, 2017. 1194 Matrix Swelling and Water Uptake Studies
Swelling was evaluated by weight. The matrices were placed in 900 ml dissolution medium
pH 6.3, at 370C. At different time intervals, the previously weighed tablets were removed,
gently wiped with a tissue to remove surface water, and reweighed. The percent water uptake
i.e., degree of swelling due to absorbed test liquid, can be estimated at regular time intervals
using the following equation –
% water Uptake = (Ws-Wi)/Wp *100
Where, Ws = Wt. of the swollen matrix at time t, Wi = Initial wt. of the matrix, Wp = wt. of
the polymer in the matrix. The polymer swelling or water uptake are mean of three
determinations.
The degree of swelling can be calculated by the following formula –
Degree of swelling = Ws-Wd/Wd*100
Where, Wd = Final dry wt. of the matrix, Ws = Swollen wt. of the same matrix at immersion
time (t). The swelling degree is the mean of at least three determinations.
The weight of the polymer in the matrix (Wp) and final dry weight of the matrix (Wd) are
shown in Table.[2]
Dissolution Studies
Dissolution studies were carried out for all the eighteen formulations in triplicate, employing
dissolution apparatus, using distilled water pH 6.3 as the dissolution medium at 50 rpm and
37 0.50C. An aliquot of sample was periodically withdrawn at suitable time intervals and
volume replaced with equivalent amounts of plain dissolution medium. The diltiazem
hydrochloride drug samples were analyzed at 237 nm. and the Atenolol drug samples were
www.wjpr.net Vol 6, Issue 14, 2017. 1195 Table 1: Different ratios employed in formulations containing combinations of same HPMC grades.
Formulation Code HPMCK4M HPMCK100M DILTIAZEM HCL
C1 1 1 1
C2 2 2 1
C3 3 3 1
Formulation Code HPMCK4M HPMCK15M DILTIAZEM HCL
D1 1 1 1
D2 2 2 1
D3 3 3 1
Formulation Code HPMCK15M HPMCK100M DILTIAZEM HCL
E1 1 1 1
E2 2 2 1
E3 3 3 1
Formulation Code HPMCK15M HPMCK100M ATENOLOL
F1 1 1 1
F2 2 2 1
F3 3 3 1
Formulation Code HPMCK15M HPMCK100M ATENOLOL
G1 1 1 1
G2 2 2 1
G3 3 3 1
Formulation Code HPMCK15M HPMCK100M ATENOLOL
H1 1 1 1
H2 2 2 1
H3 3 3 1
Table 2: Final dry weight and weight of polymer in matrix tablets of different Formulations.
Formulation Code
Final Dry weight (Wd) (mg)
Weight of polymer in matrix (Wp) (mg)
C1 120 24
C2 127 48
C3 126 72
D1 124 24
D2 120 48
D3 125 72
E1 122 24
E2 125 48
E3 120 72
F1 120 24
F2 127 48
F3 126 72
G1 124 24
G2 122 48
G3 125 72
H1 122 24
H2 125 48
[image:4.595.85.496.93.443.2] [image:4.595.120.474.488.773.2]www.wjpr.net Vol 6, Issue 14, 2017. 1196 RESULTS AND DISCUSSION
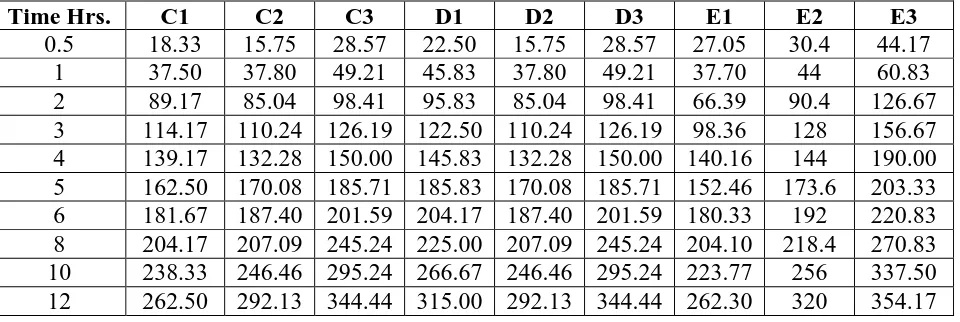
The percent water uptake as a function of time for formulations containing diltiazemh
hydrochloride is reported in Table [3] Similarly Table [4] shows the result of formulations
containing atenolol drug matrices of different codes. The degree of swelling as a function of
time for formulations containing diltiazemh hydrochloride is reported in Table [5]. Similarly
Table [6] shows the degree of swelling result of formulations containing atenolol drug
matrices of different codes. The results of swelling studies are shown graphically for different
formulations. Fig1a shows the plot for water uptake as a function of time for formulation
codes C1, C2, C3, F1, F2 and F3 containing HPMC K4M and K100M combinations with
different ratios and Fig1b shows plot for degree of swelling as a function of time for
formulation codes C1, C2, C3, F1, F2, and F3. Similar plots are shown in Fig 2a and Fig 2b
for formulation codes D1, D2, D3, G1, G2, and G3 containing HPMC K4M and K15M
combinations with different ratios and Fig 3a and Fig 3b for formulation codes E1, E2, E3,
H1, H2, and H3 containing HPMC K15M and K100M combinations with different ratios.
The dissolution parameters of varied formulation with different ratios of polymer
combinations obtained during studies are shown in Table [7].
Table 3: Percent Water Uptake as a Function of Time for Formulations Containing
Diltiazem Hcl Drug.
Time Hrs. C1 C2 C3 D1 D2 D3 E1 E2 E3
[image:5.595.55.541.458.620.2]www.wjpr.net Vol 6, Issue 14, 2017. 1197 Table 4: Percent Water Uptake As A Function Of Time For Formulations Containing
Atenolol Drug.
Time Hrs. F1 F2 F3 G1 G2 G3 H1 H2 H3
0.5 83.33 33.33 45.83 58.33 37.50 41.67 125.00 72.92 69.44 1 175.00 95.83 81.94 87.50 77.08 55.56 170.83 112.50 97.22 2 433.33 220.83 168.06 379.17 218.75 176.39 325.00 229.17 206.94 3 558.33 285.42 215.28 441.67 291.67 201.39 487.50 322.92 256.94 4 683.33 343.75 256.94 587.50 335.42 250.00 708.33 366.67 312.50 5 800.00 443.75 315.28 658.33 410.42 284.72 762.50 445.83 333.33 6 895.83 485.42 347.22 837.50 452.08 309.72 904.17 493.75 361.11 8 1004.17 541.67 419.44 900.00 487.50 370.83 1025.00 556.25 444.44 10 1175.00 641.67 505.56 1025.00 602.08 437.50 1125.00 656.25 555.56 12 1291.67 756.25 588.89 1212.50 725.00 513.89 1320.83 822.92 595.83
Table 5: Degree of Swelling as a Function of Time for Formulations Containing
Diltiazem Hcl Drug.
Time Hrs. C1 C2 C3 D1 D2 D3 E1 E2 E3
0.5 18.33 15.75 28.57 22.50 15.75 28.57 27.05 30.4 44.17 1 37.50 37.80 49.21 45.83 37.80 49.21 37.70 44 60.83 2 89.17 85.04 98.41 95.83 85.04 98.41 66.39 90.4 126.67 3 114.17 110.24 126.19 122.50 110.24 126.19 98.36 128 156.67 4 139.17 132.28 150.00 145.83 132.28 150.00 140.16 144 190.00 5 162.50 170.08 185.71 185.83 170.08 185.71 152.46 173.6 203.33 6 181.67 187.40 201.59 204.17 187.40 201.59 180.33 192 220.83 8 204.17 207.09 245.24 225.00 207.09 245.24 204.10 218.4 270.83 10 238.33 246.46 295.24 266.67 246.46 295.24 223.77 256 337.50 12 262.50 292.13 344.44 315.00 292.13 344.44 262.30 320 354.17
Table 6: Degree of Swelling as a Function of Time for Formulations Containing
Atenolol Drug.
Time Hrs. F1 F2 F3 G1 G2 G3 H1 H2 H3
0.5 16.67 12.60 26.19 15.00 10.24 23.02 24.59 28 41.67 1 35.00 36.22 46.83 20.83 25.20 30.95 33.61 43.2 58.33 2 86.67 83.46 96.03 79.17 78.74 100.00 63.93 88 124.17 3 111.67 107.87 123.02 91.67 106.30 114.29 95.90 124 154.17 4 136.67 129.92 146.83 120.83 122.83 142.06 139.34 140.8 187.50 5 160.00 167.72 180.16 135.00 151.18 161.90 150.00 171.2 200.00 6 179.17 183.46 198.41 170.83 166.93 176.19 177.87 189.6 216.67 8 200.83 204.72 239.68 183.33 180.31 211.11 201.64 213.6 266.67 10 235.00 242.52 288.89 208.33 223.62 249.21 221.31 252 333.33 12 258.33 285.83 336.51 245.83 270.08 292.86 259.84 316 357.50
In this investigation it has been demonstrated that an inverse relationship exists between the
drug release rate and matrix-swelling rate. When the amount of HPMC in the matrix is high,
[image:6.595.61.541.326.487.2]www.wjpr.net Vol 6, Issue 14, 2017. 1198
irrespective of different grades causes a greater degree of swelling. This in turn reduces the
drug release, as the diffusional path length of drug is now longer. Conversely, reduction in
the amount of HPMC reduces the degree of swelling and the thickness of gel layer and thus
enables faster drug release. It is also demonstrated that HPMC of higher viscosity grades
swells to greater extent and has greater intrinsic water uptake property than that of the lower
viscosity grades. Also it is investigated that in both the drugs the same polymer combinations
shows the similar pattern of drug release.
Table 7: Dissolution Parameters of Different Formulations.
Formulation Code
Release at 12
hr. N
Degree of Swelling (%)
Percent of water uptake
C1 97.14 0.512 262.5 1312.5
C2 84.87 0.461 292.13 772.50
C3 75.6 0.452 344.44 602.78
D1 104.6 0.559 315.00 1237.5
D2 103.33 0.555 292.13 735.42
D3 86.6 0.467 344.44 527.78
E1 93.65 0.516 262.30 1333.33
E2 75.59 0.452 320.00 833.33
E3 64.1 0.439 354.17 590.28
F1 96.14 0.502 258.33 1291.67
F2 83.86 0.451 285.83 756.25
F3 74.5 0.442 336.51 588.89
G1 103.5 0.548 245.83 1212.50
G2 102.2 0.545 270.08 725.00
G3 85.5 0.456 292.86 513.89
H1 93.6 0.506 259.84 1320.83
H2 74.6 0.442 316 822.92
www.wjpr.net Vol 6, Issue 14, 2017. 1200 CONCLUSION
Swelling studies reveals an inverse relationship between swelling effect and drug release
pattern from both the drugs matrices using the same polymer combinations. Comparison
studies shows almost similar swelling effect and drug release pattern from matrices
containing different drugs and same polymer combinations. Further, the rational combination
of different grades of polymer can be used satisfactorily to regulate the release of different
drugs in such matrices.
REFERENCES
1. Khan M. A. Studies of swelling effect and drug release in hydrophilic matrices containing
different grades of polymers, Research J. of Pharm. Biological and Chemical Sci, 2013;
4(1): 1241-1247.
2. Khan M. A., Release of atenolol from hydrophilic matrix tablets containing different
grades of hydroxypropyl methylcellulose, World Journal of Pharmaceutical research,
2013; 2(6): 2427-2436.
3. Khan M.A., Effect of pH on dissolution profile of atenolol sustained release matrix
tablets, Research J. Pharma Dosage Forms and Tech, 2013; 5(5): 275-277.
4. Khan M.A. Effect of Swelling and drug release relationship of sustained release matrices
containing different grades of hydroxypropyl methyl cellulose, Research J. Pharma
Dosage Forms and Tech, 2013; 5(4): 232-236.
5. Baisya O, Deb J, and Bhowmik M, Formulation and evaluation of sustained release
matrix tablet of atenolol based on natural polymer, Research Journal of Pharmaceutical,
Biological and Chemical Sciences (RJPBCS), 2012; 3(4).
6. Khan MA, and Maheshwari RK, Studies of relationship between swelling and drug
www.wjpr.net Vol 6, Issue 14, 2017. 1201
hdroxypropylmethyl cellulose, Research Journal of Pharmaceutical, Biological and
Chemical Sciences (RJPBCS), 2011; 2(4): 970-975.
7. Khan M.A. , Chaturvedi S C., Swelling and Drug Release Studies from Hydrophilic
Matrices Containing Combination of Different Grades of Hydroxyl Propyl
Methylcellulose, Asian Journal of Chemistry, 2010; 22(6): 3566-3568.
8. Wan, L. S. C., and Wong, L.F., Drug Dev. Ind. Pharm., 1993; 19(10).
9. Efentakis M, Vlachou M, Choulis N.H, Drug Dev. Ind. Pharm, 1997; 23: 107-112.
10.M. J. Vazquez, M Casalderry, R. Duro, J.L.Gomez.-Amoza, R. M. Pacheco, C. Souto,
A.Concherio, Atenolol release from hydrophilic matrix tablets with
hydroxypropylmethylcellulose (HPMC) mixtures as gelling agent: effects of the viscosity
of the HPMC mixture, January 1996; 39-48.
11.Liberman H, Lachman L and Schwartz J, Pharmaceutical Dosage Forms: Tablets, vol.1,
2nd edition revised and expanded, Dekker, New York, 2005.
12.Goodman and Gilman’s: The Pharmacological basis of therapeutics. 10th edition.
![Table [6] shows the degree of swelling result of formulations containing atenolol drug](https://thumb-us.123doks.com/thumbv2/123dok_us/845157.594923/5.595.55.541.458.620/table-shows-degree-swelling-result-formulations-containing-atenolol.webp)