UV-VISIBLE SPECTROPHOTOMETRIC METHOD DEVELOPMENT
AND VALIDATION OF ASSAY OF ATENOLOL TABLET
FORMULATION
Shinde G. S.*1, R. K. Godge1 and Dr. N. S. Dighe1
Pravara College of Pharmacy, Pravaranagar Tal: Rahata Dist: Ahmednagar Pin- 423109
State: Maharashtra(M.S).
ABSTRACT
A simple, sensitive, specific and validated UV method has been
developed for the quantitative determination of Atenolol in pure and
tablet dosage form. The λmax was found to be 226 nm for assay. The
linearity was found in concentration range of 0-150μg/ml. The
correlation coefficient was found 0.999. The regression equation was
found as y = 0.004x+0.007. The method was validated for linearity,
accuracy, precision and System suitability. The LOD and LOQ for
estimation of Atenolol were found as 2.088 &6.329 respectively.
Recovery of Atenolol was found to be 99.12%.
KEYWORDS: Atenolol, UV Spectrophotometry, Validation, Beer’s
law.
INTRODUCTION
UV-Visible spectrophotometry is one of the most frequently employed technique in
pharmaceutical analysis. It involves measuring the amount of ultraviolet or visible radiation
absorbed by a substance in solution. Instrument which measure the ratio, or function of ratio,
of the intensity of two beams of light in the U.V-Visible region are called Ultraviolet-Visible
spectrophotometers. In qualitative analysis, organic compounds can be identified by use of
spectrophotometer, if any recorded data is available and quantitative spectrophotometric
analysis is used to ascertain the quantity of molecular species absorbing the radiation.[1]
Volume 6, Issue 15, 629-635. Research Article ISSN 2277– 7105
*Corresponding Author
Shinde G. S.
Pravara College of
Pharmacy, Pravaranagar
Tal: Rahata Dist:
Ahmednagar Pin- 423109
State: Maharashtra(M.S). Article Received on 28 Sept. 2017,
Revised on 18 Oct. 2017, Accepted on 08 Nov. 2017
Beer -Lambert law
When beam of light is passed through a transparent cell containing a solution of anabsorbing
substance, reduction of the intensity of light may occur. Mathematically, Beer- Lambert law
is expressed as,
A=a b c
Where, A=absorbance or optical density
a=absorptivity or extinction coefficient
b=path length of radiation through sample (cm)
c=concentration of solute in solution.
Quantification of medicinal substance using spectrophotometer may carried out by preparing
solution in transparent solvent and measuring it’s absorbance at suitable wavelength. The
wavelength normally selected is wavelength of maximum absorption (λmax), where small
error in setting the wavelength scale has little effect on measured absorbance. Ideally,
concentration should be adjusted to give an absorbance of approximately 0.9, around which
the accuracy and precision of the measurements are optimal.
The assay of single component sample, which contains other absorbing substances, is then
calculated from the measured absorbance by using one of three principal proceduresof
standard absorptivity value, calibration graph and single or double point standardization. In
standard absorptive value method, the use of standard A (1%, 1 cm) or E values are used in
order to determine its absorptivity. The concentration of the substances in the sample is
calculated from the proportional relationship that exists between absorbance and
concentration.
Ctest= (Atest×Cstd)/Astd
Where Ctestand Cstdare the concentrations in the sample and standard solutions respectively
and Atestand Astdare the absorbances of the sample and standard solutions respectively. For
assay of substance/s in multi component samples by spectrophotometer.[2]
Description of Drug
Atenolol is a selective β1 receptor antagonist which used primarily in cardiovascular
diseases.[3] Atenolol (M.W. 266.34), designated chemically as (C14H22N2O3),
melting point 152°C to 155°C. It is sparingly soluble in water, soluble in ethanol, Slightly
Soluble in methylene Chloride, practically insoluble in Ether. Atenolol drug is Optical
rotation: +0.10° to -0.10° and dissociation constant (pKa) is 9.6 at 24oC.[4] Beta-blockers are
competitive inhibitors and interfere with the action of stimulating hormones on
beta-adrenergic receptors in the nervous system and decrease the formation of Angiotensin II and
secretion of aldosterone. Its effect on the bronchiolar smooth muscles is vasodilatation there
by it helps in the treatment of cardiovascular disease such as angina, hypertension, cardiac
arrhythmias and myocardial infractions.[5]
Aim of Present Work
This work deals with the validation of the developed method for the assay of Atenolol from
its dosage form (tablets). Hence, the method can be used for routine quality control analysis
and also stability.
The aim and scope of the proposed work are as under:
• To develop suitable spectrophotometric method for assay of Atenolol tablet. • Perform the validation for the method
Experiamental
1. Material and Instrument
Analytical pure Atenolol drug was procured from Micro labs Ltd. Banglore (India). Ethanol
(purity>99.9%), Methanol (HPLC grade), 0.1N Hydrochloric acid (HCL) and all other
chemicals used were of analytical grade and obtained from Merck. Triply distilled water with
-1 at 298.15 K was used for preparation of samples. Shimadzu
double beam UV-visible spectrophotometer (model 1700) with 1 cm matched quartz cuvettes
were used for all absorbance measurements.
2. Selection of solvent and wavelength
The solubility of Atenolol was determined in different solvents viz. distilled water, methanol,
ethanol, 0.1 HCL and phosphate buffer and it was found that the Atenolol showed the
absorbance in range of 226-238nm. Absorbance spectrums of Atenolol in different solvents
were studied carefully during Spectrophotometric technique. But among all these obtained
spectra of Atenolol from different solvents, the spectrum with ethanol solvent was found to
Fig 2: UV-spectrum of Atenolol in 0.1N HCL at λ=226nm.
3. Standard preparation
10 mg drug was dissolved in 0.01N HCL and was shaken well. Then 85 ml water was added
to it to adjust the volume up to 100 ml (100 ppm). From that 5 ml was taken and volume was
adjusted up to 50 ml with diluents.
4. Test preparation
20 tablets were weighed and powdered. Powdered tablet equivalent to 100 mg of Atenolol
was weighed and taken into 100 ml volumetric flask then 15 ml of 0.1N HCL was added and
shaken well to dissolve it after that 85 ml of water was added to adjust the volume up to 100
ml. From that 1 ml of solution was withdrawn and taken in 100 ml volumetric flask. The
volume was adjusted with diluent up to 100 ml.
5. Assay Method
The assay is performed by single point UV-Visible Spectrophotometric Method The
concentration of the substances in the sample is calculated from the proportional relationship
that exists between absorbance and concentration.
Ctest= (Atest×Cstd)/Astd
Where Ctestand Cstdare the concentrations in the sample and standard solutions respectively
VALIDATION
The objective of the analytical procedure should be clearly understood since this will govern
the validation characteristics which need to be evaluated. Typical validation characteristics
which should be considered are listed below:
1. Accuracy
2. Precision
3. Detection Limit
4. Quantitation Limit
5. Linearity
6. System Suitability
1. Linearity: Six points calibration curve were obtained in a concentration range from
0-150 ppm for Atenolol. The response of the drug was found to be linear ininvestigation
concentration range and the linear regression equation was y = 0.004x+0.007 with
correlation coefficient 0.998.
2. Precision
Precision of the analytical method is ascertained by carrying out the analysis as per the
procedure and as per normal weight taken for analysis. Repeat the analysis six times. The
developed method was found to be precise as the %RSD values for the repeatability and
intermediate precision studies were <0.98% and <0.79%, respectively.
Table 1: Precision study.
Sample No. % Assay
SET Intraday Interday
1 100.8 99.3
2 102.1 98.2
3 103.4 99.0
4 102.0 99.0
5 101.5 98.6
6 97.1 100.5
Mean 100.1 99.1
SD 0.98 0.79
%RSD 0.97 0.81
3. Accuracy
Accuracy of the method is ascertained by standard addition method at 3 levels. Standard
best recoveries (98.27-99.12%) of the spiked drug were obtained at each added concentration,
[image:6.595.171.423.455.600.2]indicating that the method was accurate.
Table 2: Accuracy Study.
% Recovery
Level % Recovery
Mean
%Recovery SD % RSD
50%
97.62
98.27
0 0
99.63 0.0057735 0.005854
97.56 0.00816497 0.008279
100%
97.56
98.55
0.00693889 0.007041
98.57 0.00942809 0.009566
99.54 0.1503083 0.015251
150%
98.13
99.12
0.00707107 0.007134
99.11 0.00707107 0.007134
99.12 0 0
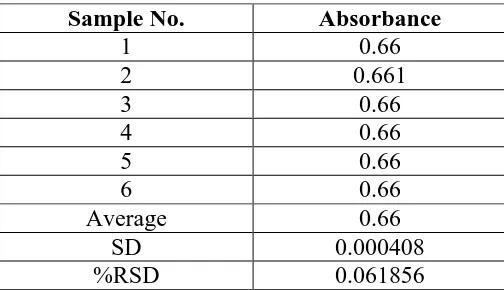
4. System Suitability
A system suitability test of the spectrophotometric system was performed before each
validation run. Six replicate reading of standard preparation were taken and %RSD of
standard reading were taken for same. Acceptance criteria for system suitability, %RSD of
standard reading not more than 2.0%, were full fill during all validation parameter.
Table 3: System Suitability Study.
Sample No. Absorbance
1 0.66
2 0.661
3 0.66
4 0.66
5 0.66
6 0.66
Average 0.66
SD 0.000408
%RSD 0.061856
5. Limit of Detection (LOD) and Limit of Quantification (LOQ)
The LOD and LOQ were calculated directly from the calibration curve using the formula 3.3
σ/S and 10 σ/S respectively, where S is the slope of the calibration curve and σ is the standard
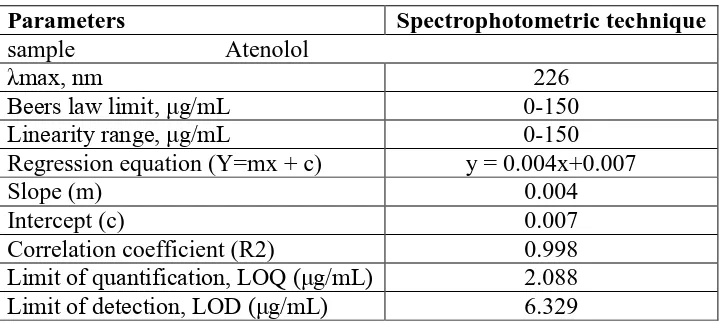
Table 4: Analytical characteristics of drugs by proposed Spectrophotometric technique.
Parameters Spectrophotometric technique
sample Atenolol
λmax, nm 226
Beers law limit, μg/mL 0-150
Linearity range, μg/mL 0-150
Regression equation (Y=mx + c) y = 0.004x+0.007
Slope (m) 0.004
Intercept (c) 0.007
Correlation coefficient (R2) 0.998
Limit of quantification, LOQ (μg/mL) 2.088
Limit of detection, LOD (μg/mL) 6.329
CONCLUSION
The present analytical method was validated as per ICH Q2(R1) guideline and it meets to
specific acceptance criteria. It is concluded that the analytical method was specific, precise,
linear, accurate, robust and having stability indicating characteristics. The present analytical
method can be used for its intended purpose.
ACKNOWLEDGEMENT
I am thankful to Management of Prvara Rural Education Society for providing laboratory
facilities and Micro labs Ltd. Banglore (India) for providing gift sample of drug.
REFERANCE
1. ChatwalGR, Anand S (2002) Instrumental Methods of Chemical Analysis. (5thedn),
Himalaya Publishing House, New Delhi.
2. Davidson AG (2002) Ultraviolet-visible absorption spectrophotometry. In Beckett AH,
Stenlake JB, (4th edn), Practical Pharmaceutical chemistry. CBS Publishers and
distributors, New Delhi, 275-278.
3. A.R.Tengli and B. M. Gurupadayya, (2013) “Chromatography Method Development and
Validation of Tablet Dosage form Containing Losartan Atenolol and Hydrochlorthiazide
Using Internal Standard, 4(5): 1–5.
4. J. Kavitha, S. Muralidharan, (2011) “Development and Validation of New Method for
Atenolol, Hydrochlorothiazide and Losartan potassium by RP-HPLC: Its Application to
Routine Quality Control Analysis,” 2011; 3(2): 4–7.
5. N. R. Pai and S. S. Patil, (2013) “Development and validation of liquid chromatographic