DEVELOPMENT AND VALIDATION OF ARTEMETHER &
LUMEFANTRINE IN PHARMACEUTICAL DOSAGE FORMS
A. Rajesh1* and K. Swapna2
1
Hindu College of Pharmacy, Guntur-522 002.
2
MLR Institute of Pharmacy, Hyderabad-500 043.
ABSTRACT
The developed method was validated for parameters such as System
suitability, Precision, Accuracy, Linearity and Robustness for the assay
of Artemether + Lumefantrine. Hence the method is suitable, linear,
precise, accurate and robust for the assay of Artemether and
Lumefantrine. Precision and Accuracy are the major control
parameters of the whole validation procedure were within the
acceptable limits. The experimental data makes a relevant contribution
to the understanding of validation parameters.The present work shows
a validated, highly sensitive and selective method for determination of
Artemether (20mg) + Lumefantrine (120mg) in tablet dosage forms.
Key Word: Precision , Validation, Dosage Forms
INTRODUCTION
Chromatography is a technique by which the components in a sample, carried by the liquid or
gaseous phase, are resolved by sorption-desorption steps on the stati onary phase.[1-3] HPLC is
a type of liquid chromatography that employs a liquid mobile phase and a very finely divided
stationary phase. In order to obtain satisfactory flow rate liquid must be pressurized to a few
thousands of pounds per square inch. The HPLC is the method of choice in the field of
analytical chemistry, since this method is specific, robust, linear, precise and accurate and the
limit of detection is low and also it offers the following advantages.Speed (many analysis
can be accomplished in 20 min or less), Greater sensitivity (various detectors can be
employed) Improved resolution (wide variety of stationary phases), Reusable columns
(expensive columns but can be used for many analysis), Ideal for the substances of low
viscosity, Easy sample recovery, handling and maintenance. Instrumentation leads itself to
Volume 6, Issue 10, 749-767. Research Article ISSN 2277– 7105
*Corresponding Author
Dr. A. Rajesh
Hindu College of Pharmacy,
Guntur-522 002. Article Received on 09 July 2017,
Revised on 29 July 2017, Accepted on 19 August 2017
automation and quantification (less time and less labour), Precise and reproducible, Integrator
itself does calculations. A good method development strategy should require only as many
experimental runs as are necessary to achieve the desired final result. Finally method
development should be as simple as possible, and it should allow the use of sophisticated
tools such as computer modeling.[4]
The selection of the column in HPLC is somewhat similar to the selection of columns in G.C,
in the sense that, in the adsorption and partition modes, the separation mechanism is based on
inductive forces, dipole-dipole interactions and hydrogen bond formation. In case of
ion-exchange chromatography, the separation is based on the differences in the charge, size of the
ions generated by the sample molecules and the nature of ionisable group on the stationary
phase.[5] One approach is to use an isocratic mobile phase of some average organic solvent
strength (50%). A better alternative is to use a very strong mobile phase first (80-100%) then
reduce% B as necessary. The initial separation with 100% B results in rapid elution of the
entire sample, but few groups will separate. Decreasing the solvent strength shows the rapid
separation of all components with a much longer run time, with a broadening of latter bands
and reduced retention sensitivity.[6,7]
Method validation can be defined as (ICH) “Establishing documented evidence, which
provides a high degree of assurance that a specific activity will consistently produce a desired
result or product meeting its predetermined specifications and quality characteristics”.[8]
Artemether is fast acting drug with a short half-life. Lumefantrine acts slowly and has a
longer half-life. Artemether rapidly reduces parasite biomass and quickly resolves clinical
symptoms, whilst the long-acting activity of Lumefantrine is thought to prevent
recrudescence. This dual effect also appears to reduce the selective pressure on the parasite to
develop resistance. The antimalarial activity of the combination of Lumefantrine and
Artemether is greater than that of either substance alone.[9-12] A detailed review of literature
showed that different methods have been developed for detecting Artemether and
Lumefantrine in pharmaceutical formulations and in human plasma, but these methods are
costly and require sophisticated equipments.
So the present study is designed to develop an assay method for the simultaneous estimation
of these drugs by RP-HPLC in the tablet formulation. This method will be validated for
ICH guidelines. Solubility of Artemether and Lumefantrine in Purified water, 0.1N HCl,
0.1N HCl + 1%Tween80, pH 4.5 Acetate buffer, pH 4.5 Acetate buffer + 2% SLS, pH 6.8
Phosphate buffer, pH 7.4 Phosphate buffer will be studied. Through Review of Literature
initial chromatographic conditions for estimation of Artemether (20mg) + Lumefantrine
(120mg) in tablet dosage form were established and optimized. Assay method for the
estimation Artemether and Lumefantrine will be developed. Developed assay method is
subjected to validation for various parameters like Accuracy, Precision, System suitability,
Linearity and Robustness as per ICH guidelines.
Experimental Part
Assay Method Development
The objective of this experiment was to optimize the assay method for simultaneous
estimation of Artemether and Lumefantrine based on the literature survey made and the
methods given in official pharmacopoeias. So here the trials mentioned describes how the
optimization was done.
Buffer preparation: Dissolve accurately 1.36g of Potassium dihydrogen Orthophosphate in
900ml of Milli-Q water. Adjust the pH to 3.0 with Ortho phosphoric acid and make up the
volume to 1000ml with Milli-Q water and then filter through 0.45µm nylon membrane filter
and degas.
Mobile phase: Buffer and Acetonitrile were mixed in the ratio of 40: 60.
Diluent: Mobile phase.
Chromatographic conditions
Flow rate : 1.5ml/min
Column : Symmetry C18, 250 x 4.6 mm, 5
Detector wave length : Dual i.e, 210 and 303nm
Column temperature : Ambient
Injection volume : 20l
Observation
The peak shapes of Artemether and Lumefantrine were good and also optimum resolution
was obtained.
Optimized Method For Assay
Buffer preparation: Dissolve 1.36gm of potassium dihydrogen orthophosphate in 900ml of
Milli-Q water. Adjust the pH to 3.0 with Ortho phosphoric acid. Makeup the volume to
1000ml and filter through 0.45µm nylon membrane filter and degas.
Mobile phase: Prepare a degassed mixture of Buffer and Acetonitrile in the ratio of 40:60%
v/v.
Diluent: Buffer:Acetonitrile (40:60).
Chromatographic conditions
Flow rate : 1.5 ml/min
Column : Symmetry C18, 250 x 4.6 mm, 5
Detector wave length : Dual i.e, 210 and 303nm
Column temperature : Ambient
Injection volume : 20l
Run time : 20 mins
OBSERVATION
S. No Name of the
peak
Retention time(min)
1. Artemether 13.895
2. Lumefantrine 7.135
The two peaks were well resolved with good peak shape and symmetry.
CONCLUSION
Hence this method was finalized for the simultaneous estimation of Artemether and
Evaluation of System Suitability
The column efficiency as determined for Lumefantrine and Artemether peaks is not less than
5000 USP plate count and the tailing factor for Lumefantrine and Artemether peaks is not
more than 4.5 and 2.0 respectively.
The relative standard deviation for the peak areas of the five replicate injections is not more
than 2.0%.
Validation Of The Assay Method
The following experimental design is drawn in order to prove the test method is capable to
yield consistent, reliable and reproducible results within the pre-determined acceptance
limits. Acceptance criteria for above validation parameters are specified in individual
experimental design. Observations and results are recorded in individual method validation
data sheets. Summarize the findings of the method validation and draw interference. Based
on the interpretation of the results in method validation, draw the conclusion.
The following parameters have been validated.
1. System suitability 2. Precision3. Accuracy 4. Linearity 5. Robustness.
System suitability
A Standard solution was prepared by using, Artemether and Lumefantrine working standards
as per test method and was injected ten times into the HPLC system.
The system suitability parameters were evaluated from standard chromatograms by
calculating the % RSD from ten replicate injections for Artemether and Lumefantrine
retention times and peak areas.
Acceptance criteria
1. The % RSD for the retention times of principal peak from 10 replicate injections of each
Standard solution should be not more than 2.0%
2. The % RSD for the peak area responses of principal peak from 10 replicate injections of
each standard Solution should be not more than 2.0%.
3. The number of theoretical plates (N) for the Artemether and Lumefantrine peaks is not less
than 1500.
4. The Tailing factor (T) for the Artemether peak is NMT 2.0 and for Lumefantrine peak is
PRECISION
a. System precision: Standard solution prepared as per test method and injected five times.
b. Method precision: Prepared six sample preparations individually using a batch of tablets
of Artemether and Lumefantrine tablets (20/120mg) as per the test method and injected
each solution.
Acceptance criteria
The % relative standard deviation of individual Artemether and Lumefantrine from the six
samples should be not more than 2.0%.
The assay of Artemether and Lumefantrine should be not less than 95.0% and not more than
105.0%.
ACCURACY (RECOVERY)
A study of Accuracy was conducted. Drug Assay was performed in triplicate as per test
method with equivalent amount of Artemether and Lumefantrine into each volumetric flask
for each spike level to get the concentration of Artemether and Lumefantrine equivalent to
50%, 100%, and 150% of the labeled amount as per the test method. The average % recovery
of Artemether and Lumefantrine was calculated.
Separately inject the blank, placebo, Artemether and Lumefantrine in to the chromatograph.
Acceptance criteria
The mean % recovery of the Artemether and Lumefantrine at each level should be not less
than 95.0% and not more than 105.0%.
LINEARITY OF TEST METHOD
A Series of solutions are prepared using Artemether and Lumefantrine working standard at
concentration levels from 50% to 150% of target concentration (50%, 75%, 100%, 125% and
150%). Measure the peak area response of solution at Level 1 and Level 6 six times and
Level 2 to Level 5 two times.
Acceptance criteria
Correlation Coefficient should be not less than 0.9990.
% of y- Intercept should be ±2.0.
ROBUSTNESS
i) Effect of variation in mobile phase composition
A study was conducted to determine the effect of variation in Organic phase composition in
mobile phase. Standard solution prepared as per the test method was injected into the HPLC
system using two mobile phases. The system suitability parameters were evaluated and found
to be within the limits for mobile phase having 95% and 110% of method highest organic
phase. Artemether and Lumefantrine blend solution at target concentration was
chromatographed using mobile phase having 90% and 110% of the method organic phase.
Artemether and Lumefantrine were resolved from all other peaks and the retention times
were comparable with those obtained for mobile phase having 100% of the organic phase.
From the study it was established that the allowable variation in mobile phase composition is
90% to 110% of the method highest organic phase of mobile phase.
Acceptance criteria
The Tailing Factor of Artemether standard should be NMT 2.0 and Lumefantrine standard
should be NMT 4.0 for Variation in Organic Phase.
ii) Effect of variation of flow rate
A study was conducted to determine the effect of variation in flow rate. Standard solution
prepared as per the test method was injected into the HPLC system using flow rates,
1.4ml/min and 1.6ml/min. The system suitability parameters were evaluated and found to be
within the limits for 1.4ml/min and 1.6ml/min flow.
Artemether and Lumefantrine were resolved from all other peaks and the retention times
were comparable with those obtained for mobile phase having flow rates 1.5ml/min.
From the above study it was established that the allowable variation in flow rates is
1.4ml/min and 1.6ml/min.
Acceptance criteria
The Tailing Factor of Artemether standard should be NMT 2.0 and Lumefantrine standard
iii) Effect of variation of temperature
A study was conducted to determine the effect of variation in temperature. Standard solution
prepared as per the test method was injected into the HPLC system at 30ºC temperature. The
system suitability parameters were evaluated and found to be with in the limits for a
temperature change of 30ºc.
Similarly sample solution was chromatographed at 30ºC temperature. Artemether and
Lumefantrine were resolved from all other peaks and the retention times were comparable
with those obtained for mobile phase having ambient temperature.
Acceptance criteria
The Tailing Factor Artemether and Lumefantrine standard and sample solutions should be
NMT 2.0 and 4.0 respectively for Variation in temperature.
iv) Effect of variation of pH
A study was conducted to determine the effect of variation in pH. Standard and sample
solutions were prepared as per the test method and injected into the HPLC system using pH
2.8 and 3.2. The system suitability parameters were evaluated and found to be within the
limits for pH 2.8 and 3.2.
Artemether and Lumefantrine were resolved from all other peaks and the retention times
were comparable with those obtained for mobile phase having pH3.0.
From the above study it was established that the allowable variation in pH 2.8 and 3.2.
Acceptance criteria
The Tailing Factor of Artemether and Lumefantrine standard should be NMT 2.0 and 4.0
respectively for Variation in pH.
RESULTS AND DISCUSSION
SOLUBILITY RESULTS
The solubility of Artemether in mg/ml in all medias can be calculated by the following
Table 1: Lumefantrine.
S.No. Media Sample wt.
in mg Sample absorbance Standard absorbance Solubility mg/ml
1 Purified water 25.39 0.671 0.453 3.90
2 0.1N HCl 70.81 0.516 0.461 6.95
3 0.1N HCl +
1%Tween80 400 0.482 0.487 38.83
4 pH 4.5 Acetate
buffer 150.40 0.513 0.437 18.42
5 pH 4.5 Acetate
buffer + 2%SLS 170 0.401 0.479 13.14
6 pH 6.8 Phosphate
buffer 25.0 0.627 0.452 3.58
7 pH 7.4 Phosphate
buffer 25.0 0.678 0.462 3.791
From the above observation, it has been observed that Lumefantrine showed acceptable
solubility in all media exhibiting higher solubility in 0.1N HCl + Tween80.
Table 2: Artemether.
S.No. Media Sample
wt. Sample absorbance Standard absorbance Solubility mg/ml
1 Purified water 20.16 0.536 0.325 3.26
2 0.1N HCl 70.90 0.473 0.391 9.69
3 0.1N HCl +
1%Tween80 70.00 0.459 0.345 10.49
4 pH 4.5 Acetate
buffer 251.1 0.391 0.309 29.93
5 pH 4.5 Acetate
buffer + 2%SLS 520 0.394 0.325 57.35
6 pH 6.8 Phosphate
buffer 20.00 0.531 0.384 2.73
7 pH 7.4 Phosphate
buffer 20.16 0.592 0.371 3.14
From the above observation it has been observed that Artemether showed acceptable
solubility in all media exhibiting higher solubility in pH 4.5 Acetate buffer + 2%SLS.
ASSAY RESULTS
LUMEFANTRINE
Table 3.
S.NO. Std. areas of
Lumefantrine
1 6327565
[image:9.595.87.509.377.579.2]3 6328224
4 6342690
5 6329931
Mean 6331195
Std.dev. 6498.33
%RSD 0.10
At = 5929391
As = 6331195
Aw = 266.12
Std Wt. = 24.85
Sample Wt = 52.39
P = 100
Table 4.
%Assay of Lumefantrine
% Assay
Sample-1 5929391 24.85 100 266.12 100 100 98.51
6331195 100 52.39 120 100
Sample-2 6165393 24.85 100 266.12 100 100 101.6
6331195 100 52.83 120 100
Sample-3 6117776 24.85 100 266.12 100 100 101.3
6331195 100 52.57 120 100
[image:10.595.64.520.27.842.2]ARTEMETHER
Table 5.
S.NO. Std.areas of
Artemether
1 23201
2 22524
3 22831
4 22926
5 22909
Mean 22878.2
Std.dev. 242.45
%RSD 1.06
At = 22023
As = 22878
Aw = 266.12
Sample Wt = 52.08
P = 98.56
Table 6.
%Assay of
Artemether % Assay
Sample-1 22023 40.82 5 100 266.12 98.56 100 98.95
22878 50 100 52.08 20 100
Sample-2 22003 40.82 5 100 266.12 98.56 100 98.99
22878 50 100 52.01 20 100
Sample-3 22016 40.82 5 100 266.12 98.56 100 98.84
Sample Name Name Vial RT Area
1. Assay sam 3 Artimether 47 13.886 22016
Fig. 1 Assay of Drugs.
[image:12.595.120.482.74.441.2]Validation Data
Table 7:System Suitability I) Lumefantrine.
Injection RT Peak
Area
USP Plate count
USP Tailing
1 7.23 6327565 1979.6 3.5
2 7.26 6327661 1975.3 3.5
3 7.22 6327489 1988.9 3.6
4 7.20 6327375 1995.1 3.6
5 7.17 6327240 2000.2 3.6
6 7.21 6327517 1991.3 3.5
7 7.28 6327698 1962.0 3.4
8 7.19 6327330 1998.5 3.6
9 7.24 6327575 1972.4 3.6
10 7.25 6327620 1993.6 3.5
Mean 7.225 6327507 1985.69 3.54
SD 0.034 149.6 --- ---
Table 8: Artemether.
Injection RT Peak
Area
USP Plate count
USP Tailing
1 13.882 23201 17815 1.0
2 13.890 22524 17927.4 1.0
3 13.888 22831 17578.2 1.1
4 13.878 22926 18225.3 1.0
5 13.887 22909 17820.3 1.1
6 13.881 23192 17760.2 1.1
7 13.886 22789 17585.4 1.0
8 13.883 22288 17770.6 1.1
9 13.889 22891 17935.2 1.2
10 13.885 22916 17790.3 1.0
Mean 13.88 22846.7 17815.88 1.06
SD 0.004 275.18 --- ---
% RSD 0.03 1.20 --- ---
Acceptance criteria
1. The % RSD for the retention times of Lumefantrine + Artemether peaks from 10 replicate
injections of each Standard solution should be not more than 2.0%.
2. The % RSD for the peak area responses of Lumefantrine + Artemether peaks from 10
replicate injections of each standard solution should be not more than 2.0%.
3. The number of theoretical plates (N) for the Lumefantrine and Artemether peaks is not less
than 1500.
4. The Tailing factor (T) for the Lumefantrine peak is not more than 4.0 and Artemether
peak is not more than 2.0.
Observations
1. The % RSD for the retention times of Lumefantrine peak from 10 replicate injections of
each Standard solution is 0.46 & the %RSD for the retention times of Artemether peak
from 10 replicate injections of each Standard solution is 0.03.
2. The % RSD for the peak area response of Lumefantrine peak from 10 replicate injections
of each Standard solution is 0.002 & the %RSD for the peak area response of Artemether
peak from 10 replicate injections of each Standard Solution is 1.20.
3. The number of theoretical plates (N) for Lumefantrine is 1985.69 & for Artemether is
17815.9.
Table 9: System Precision.
Concentration 100%
Injection Peak Areas of
Artemether
Peak Areas of Lumefantrine
1 23201 6327565
2 22524 6327565
3 22831 6328224
4 22926 6342690
5 22909 6329931
Statistical Analysis
Mean 22878 6331195
SD 242.51 6498.34
% RSD 1.06 0.10
Table 10: Method Precision.
Tablet ID
% Assay Statistical Analysis
ARTE LUME ARTE LUME
1 99.6 98.9
Mean 99.26 99.11
2 97.8 99.6
3 100.3 97.8
SD 0.79 0.73
4 99.8 100.1
5 98.9 98.8 %RSD
0.79 0.74
6 99.2 99.5 100.3
Acceptance criteria
1. The %RSD for the peak area responses of Lumefantrine and Artemether from the five
replicate injections of Standard solution should not be more than 2.0%.
2. The %RSD for % Assay of Lumefantrine and Artemether of 6 units should not be more
than 5.0.
Observation
1. %RSD for the peak area responses of Lumefantrine peak from the five replicate injections
of Standard solution is 0.10 & the % RSD for the peak area responses of Artemether peak
from 5 replicate injections of Standard solution is 1.06.
2. The %RSD for %Assay of Lumefantrine of 6 units is 0.74 and the %RSD for %Assay of
Table 11: Lumefantrine Accuracy (Recovery).
Concentration % of spiked
level Amount added (ppm) Amount found (ppm) % Recovery Statistical Analysis of % Recovery
50%
Sample 1 12.24 12.17 99.42 MEAN 98.46
50%
Sample 2 12.06 12.02 99.66 SD 0.1833
50%
Sample 3 12.88 12.79 99.30 %RSD 0.184
100 %
Sample 1 24.34 24.28 99.75 MEAN 98.76
100%
Sample 2 24.15 24.09 99.75 SD 0.023
100%
Sample 3 23.86 23.81 99.79 %RSD 0.0231
150%
Sample 1 36.51 36.49 99.94 MEAN 99.86
150%
Sample 2 35.98 35.90 99.77 SD 0.087
150%
Sample 3 36.46 36.42 99.89 %RSD 0.0874
Table 12: Artemether.
Concentration % of spiked
level Amount added (ppm) Amount found (ppm) % Recovery Statistical Analysis of % Recovery
50%
Sample 1 2.17 2.14 98.8
MEAN SD %RSD
99.03
50%
Sample 2 2.10 2.08 99.1 0.16
50%
Sample 3 2.80 2.77 99.2 0.162
100 %
Sample 1 4.12 4.06 98.6
MEAN SD %RSD
98.63
100%
Sample 2 4.23 4.17 98.6 0.04
100%
Sample 3 4.7 4.63 98.7 0.04
150%
Sample 1 6.25 6.18 98.9
MEAN SD %RSD
99.09
150%
Sample 2 6.31 6.25 99.1 0.16
150%
Sample 3 6.28 6.23 99.3 0.161
Acceptance criteria: The mean % recovery of the Artemether and Lumefantrine at each
Observation: The mean % recovery levels were found to be not less than 95.0.
Table 13: Linearity Lumefantrine.
Linearity Level
Concentration ppm
Average Area
% of
RSD Statistical Analysis
L1-50% 123.35 3163782 0.003 Slope 25649
L2-75% 185.02 4745673 -- y-Intercept -50.703
L3-100% 246.7 6327565 -- % of y- Intercept 0.405
L4-125% 308.37 7909456 -- Correlation
Coefficient 0.999996
L5-150% 370.05 9491347 0.001 R2 1.0
[image:16.595.53.546.547.668.2]Fig 2: Lumefantrine graph.
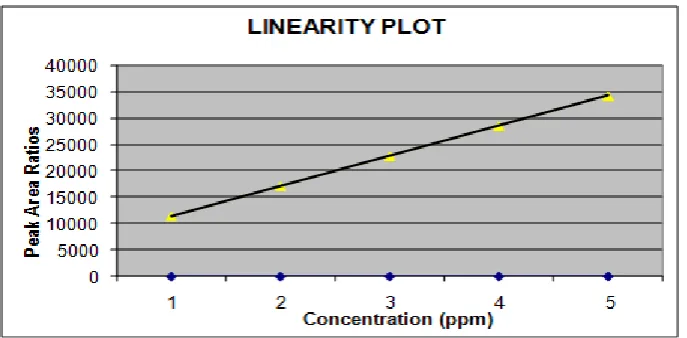
Table 14: Artemether.
Linearity Level
Concentration ppm
Average
Area % of RSD Statistical Analysis
L1-50% 20.32 11439 0.785 Slope 5719.5
L2-75% 30.48 17158 -- y-Intercept -5719.3
L3-100% 40.64 22878 -- % of y- Intercept 0.625
L4-125% 50.8 28597 -- Correlation Coefficient 0.999998
Fig 3: Artemether Graph.
Acceptance criteria
1. The linearity regression coefficient should be more than 0.999.
2. % of y- Intercept should be ±2.0.
3. % RSD for level 1 and Level 6 should be not more than 2.0%.
Observation
1. The linearity regression coefficient for Lumefantrine is 0.999996 & for Artemether is
0.999998.
2. The % y-intercept of Lumefantrine is 0.405 & for Artemether is 0.625.
3. The % RSD of peak area response of Lumefantrine peaks for level 1 and level 6 are 0.003
and 0.001 respectively & the % RSD of peak area response of Artemether peaks for level
1 and level 6 are 0.785 and 0.246 respectively.
Table 15: Robustness.
Parameters Optimum range Conditions in procedure Remarks
Mobile phase composition
(% Of Acetonitrile)
10% variations in
gradient conditions Isocratic
Does not have any effect on system suitability.
Flow rate ml/min 0.9-1.1 1.0 Does not have any effect
on system suitability.
Temperature 25-30oC Ambient Does not have any effect
on system suitability.
PH of mobile phase 2.8-3.2 3.0 Does not have any effect
on system suitability.
Acceptance criteria
1. The Tailing Factor of Artemether standard should not be more than 2.0 and Lumefantrine
[image:17.595.45.551.549.698.2]2. The Tailing Factor of Artemether standard should not be more than 2.0 and Lumefantrine
standard should not be more than 4.0 for Variation in Flow.
3. The Tailing Factor Artemether and Lumefantrine standard and sample solutions should
not be more than 2.0 and 4.0 respectively for Variation in temperature.
4. The Tailing Factor of a Artemether and Lumefantrine standard should not be more than
2.0 and 4.0 respectively for Variation in pH.
OBSERVATION
1. Effect of variation in mobile phase composition: The tailing factor for Artemether and
Lumefantrine are found to be within the limits.
2. Effect of variation of flow rate: The tailing factor for Artemether and Lumefantrine are
found to be within the limits.
3. Effect of variation of temperature: The tailing factor for Artemether and Lumefantrine
are found to be within the limits.
4. Effect of variation of pH: The tailing factor for Artemether and Lumefantrine are found
to be within the limits.
CONCLUSION
The chromatographic method developed for the test procedure of assay for Artemether
(20mg) + Lumefantrine (120mg) in tablet dosage forms were simple, reliable, sensitive and
less time consuming. The advantage of the present test procedures is that it does not require
any complicated mobile phase and it is simple isocratic method. The present method can be
confidently used for rapid and precise estimation of Artemether (20mg) + Lumefantrine
(120mg). Especially this procedure can be a major interest in analytical pharmacy, since it
offers a distinct quality control in the test procedures of assay of pharmaceutical dosage
forms. The methods developed may be recommended for routine and quality control analysis
of the investigated drug. The observed values are within the acceptance criteria for the
validation of stability indicating HPLC method for the assay of Artemether & Lumefantrine.
The developed method was validated for parameters such as System suitability, Precision,
Accuracy, Linearity and Robustness for the assay of Artemether + Lumefantrine. Hence the
method is suitable, linear, precise, accurate and robust for the assay of Artemether and
Lumefantrine. Precision and Accuracy are the major control parameters of the whole
validation procedure were within the acceptable limits. The experimental data makes a
a validated, highly sensitive and selective method for determination of Artemether (20mg) +
Lumefantrine (120mg) in tablet dosage forms.
REFERENCES
1. H.H. Willard; L.L.Merit; F.A. Dean & F.A.Settle, “Instrumental methods of analysis”, 7th
edition, CBS Publishers, New Delhi, 580-613.
2. B.K. Sharma, “Instrumental Methods of Chemical Analysis”, 19th edition, 2000.
3. G.R.Chatwal & Sham K Anand, “Instrumental methods of chemical analysis”, 9th edition,
2004.
4. R.J. Hamilton and Swell, “Introduction to HPLC”, 2nd edition, 1984; 2-9.
5. Craig S. Young and Raymond J. Weigand, “An efficient approach to column selection in
HPLC Method Development”, Altech Associates, www.alltech web.com
6. Lloyd R. Snyder, Joseph J. Kirkland, Joseph L. Glajesh, “Practical HPLC Method
Development”, 2nd
Edn, 1997; 1-14.
7. Ahuja Satinder, Rasmussen Henrik, “HPLC method development for pharmaceuticals”,
Vol.8, Apr. 2007; 510.
8. “Asean Guidelines for Validation of Analytical Procedures”, Adopted from ICH
Guidelines, ICH Q2A-27th Oct. 1994; ICH Q2B-6th Nov.1996.
9. Surendra Nath Pandeya, “A Text book of Medicinal Chemistry”, Vol.2, 3rd edition, 2003;
601-633.
10.White NJ, Van Vugt M, Ezzet F, “Clinical Pharmacokinetics and Pharmacodynamics of
Artemether-Lumefantrine”, Journal of Pharmacology, 1997; 37: 105-125.
11.M Bindschedler, G Lefevre, F Ezzet, N Schaeffer, European Journal of Clinical
Pharmacology, 2000; 56: 375-381.
12.Agarwal, Suraj P; Ali, Asgar, Ahuja, Shipra, Asian Journal of Chemistry, 2007; 19:
4407-4414.
13.Ziyou; Chen, Zufen, Yaowu Fenxi zazhi, “Simultaneous determination of ß-artemether
and its metabolite and urine by a HPLC-MS using Electrospray ionization”, Journal of
Pharmaceutical analysis, 2000; 20(3): 178-179.
14.Zhi-Liang, Yang, Song-Cheng; Zhang, Min; “Determination of lumefantrine in human
plasma by RP-HPLC with UV detection”, Journal of Chromatography B & Biomedical