DEGRADATION OF PHENOL USING A PHB PRODUCING
BACILLUS
SUBTILIS
SP3
Indu Chandrasekharan Nair* and Sukanya Prakash
Assistant Professor, Department of Biotechnology, SAS SNDP Yogam College, Konni,
Pathanamthitta, Kerala, India.689691.
ABSTRACT
The bacterial isolate from soil grown in the designed synthetic medium
with phenol as the sole carbon and energy source could degrade phenol
completely. The isolate showed fast acclimatization in the minimal
medium. Polyhydroxy butyrate (PHB), an alternative to synthetic
plastic was also extracted from the same bacterial isolate. The PHB
granules from the newly screened strain designated as sp3 were
visualized by atomic force microscopy. 16S rRNA analysis of the
bacterial isolate established the identity of the strain as Bacillus subtilis
sp. The effect of pH and incubation time under phenol stress were
optimized for maximum growth. It was observed that the optimum pH
was 7, incubation time was 24 hours and phenol concentration was 12
mM. The degradation was analyzed by Fourier Transform Infra-Red
spectroscopy. This strain could also be successfully used for the
laboratory scale treatment of paper mill effluent containing phenolic components. The
wastewater showed a considerable COD reduction of 64% after 24 hours of treatment.
KEYWORDS: Phenol degradation, Bacillus subtilis sp3, Poly Hydroxy Butyrate, Fourier Transform Infrared Spectroscopy, Chemical Oxygen Demand.
INTRODUCTION
Phenol and its derivatives are toxic and are classified as hazardous materials.[1] Enlisted by
Environmental protection Agency as a priority pollutant phenol provides far ranging effects if
it gets into the ecosystem. Phenol reaches the environment from both natural and industrial
resources. Effluents originated from oil refineries, pulp and paper manufacturing plants, steel,
Volume 6, Issue 8, 1127-1142. Research Article ISSN 2277–7105
Article Received on 25 May 2017,
Revised on 14 June 2017, Accepted on 05 July 2017
DOI: 10.20959/wjpr20178-8935 *Corresponding Author Dr. Indu Chandrasekharan Nair Assistant Professor, Department of Biotechnology, SAS
SNDP Yogam College,
Konni, Pathanamthitta,
and pharmaceutical industries contain phenol and phenolic compounds. On reaching the
ecosystem they provide stress to the biotic components. Continuous and short term exposures
are deleterious since it leads to restricted growth rate, lower fertility and metabolic
abnormalities. As a disinfectant, phenol can inhibit the growth of microorganisms including
bacterial, protozoan and algal community leading to interruption of food chain. Phenolic
components affect skin and exposure produces lesions on fishes.[2] Waste water containing
phenol and its derivatives must be treated to prevent serious ecological risks.
Various approaches are reported to manage the treatment of phenolic contaminants in water.
Microorganisms are promising candidates for biodegradation and remediation. Phenol can be
used as the sole carbon source by many bacteria and fungi which have evolved mechanisms
to tolerate and utilize phenol. Generally such microorganisms show vast diversity in their
biochemical properties and can decompose many complex organic substances including
aromatic compounds. In phenol biodegradation, enzymatic break down of aromatic rings is
reported to be effected through meta or ortho cleavage pathway.[3] The main group of
enzymes involved are phenol hydroxylases and phenol oxidases which have been isolated and
characterized from both fungi and bacteria.
This potential of microbes can be employed in bioremediation procedures. Chemical,
physical and biological methods are used separately and in combination for the treatment of
phenol and other aromatic compound contamination. Biological treatment has shown to be
economical, practical and most versatile approach as it leads to complete mineralization of
phenol.[4] In the present study, bacteria from a detergent contaminated soil were screened for
its phenol degradation ability with a view to utilize them for bioremediation. The bacterium
was also found to accumulate Poly Hydroxy Butyrate (PHB) which is an alternative for
synthetic plastic. The main advantage of PHB includes their superior environmental
qualities. Poly hydroxyl butyrate has very good barrier properties; it is water insoluble and
is susceptible to microbial degradation.
MATERIALS AND METHODS 2.1. Sample collection
Detergent contaminated soil samples from four different regions of Pathanamthita District,
viz; Edathitta, Elakolloor, Pathanapuram and Konni, Kerala, India were collected for the
2.2. Screening for phenol degradation
Screening for phenol degrading bacterial isolates was done from the above soil samples as
follows: 10 g soil from each sample was mixed with 100 ml of sterile distilled water and
allowed to sediment for a while. The supernatant was used as inocula for serial dilution. From
each dilution 1 ml was inoculated to 100ml sterile peptone water containing 1mM phenol.
The conical flasks were incubated overnight at 370C on a rotary shaker at an rpm of 300.
Bacterial samples obtained from primary screening were used as inocula for enrichment.
10ml of 24 hour old cultures in peptone broth were centrifuged at 5000 rpm for 10 minutes
and corresponding pellet was suspended in 1ml physiological saline. Each of the bacterial
suspensions were inoculated into 100 ml Mineral Salt Phenol Medium(MSPM) with the
following composition: 1g KH2PO4, 1g (NH4)2SO, 0.50g MgSO4 .7H2O, 1mg CaCl2 in 1 litre
at pH 7. Phenol, the sole carbon source, was added from the stock to a concentration of 4mM
after autoclaving the medium. The medium was shaken well and incubated overnight at room
temperature in a rotary shaker at 300 rpm. A consortium of microorganisms consistently
growing in the basal medium at 4 mM phenol concentration was selected and was subjected
to further isolation.
2.3. Isolation of pure colonies from the consortium
Colonies with different characteristic features were maintained as pure cultures on nutrient
agar slants and stored at 40C. Out of the three pure isolates one showing fastest growth under
normal conditions in mineral salt phenol medium was selected for further studies.
2.4 Identification of microorganisms
Identification of the selected phenol degrading bacteria was done by conducting various
morphological and biochemical tests as per Bergey’s manual of Systematic Bacteriology.[5]
Identification by 16SrRNA gene analysis
The molecular characterization procedures involves Isolation of DNA, 16s rRNA analysis by
amplification through polymerase chain reaction followed by sequencing and BLAST
analysis. 16s rRNA genes are amplified by PCR using universal primers.
Forward primer: F- (5’-AgA gTT TgA TCM Tgg CTC-3’),
Other requirements include DNA 5ng/ml, PCR ready mix(Merck) made upto a volume of 25
microlitre. PCR Programme includes 25 cycles of: 950C, for 30S, 550C, for 30S, 720C for
30S, 720C for 5 minutes.
Bacterial isolates were tested for species identity using the 16s rRNA sequencing method.[6]
Sequence analysis was performed with sequences in the National Centre for Biotechnology
(NCBI), USA database using Basic Local Alignment Search Tool (BLAST) for Nucleotides
and a phylogenetic tree was constructed.
2.5. Phenol degradation studies
Phenol estimation of the various samples were done through spectrophotometric estimation.[7]
Optimum concentration of phenol utilized by bacteria and inhibitory concentration of phenol
on growth were also found out.
2.6. Staining methods for PHB granules a. Sudan black staining
Sudan black staining was done to identify the cells producing PHB. 0.75 g Sudan black was
dissolved in 10 ml ethanol and the solution was filtered using Whatman No 1 filter paper. A
thin smear was prepared from the suspension on a clean dry microscopic slide by heat fixing.
Sudan black stain was flooded over the smear and kept for 5-10 minutes. The slide was
washed with distilled water, decolourized with xylene and counter stained with saffranin for
10 seconds. The slides were washed with water, dried and observed under oil immersion
objective of compound microscope with magnification 100X.[8]
b. Nile blue a staining
The bacterial cells in MSPM medium were subjected to centrifugation at 5000 rpm for 30
minutes. The supernatant was resuspended in 1 ml sterile saline. This was used to prepare the
smear. The heat fixed smear of the bacteria was stained with 1% aqueous solution of Nile
blue A. This solution was heated for 10 minutes at 550C. The slide was washed with tap
water and was placed in 8% aqueous acetic acid solution for 1 min.[9] After washing the slide
was observed under atomic force microscope (WIT ec alpha 300 RA) at sophisticated and test
2.7 Growth curve in nutrient broth and MSPM
The organism was cultured in 100 ml in nutrient broth and growth was detected in every hour
after the inoculation in terms of turbidity at 650 nm using a spectrophotometer for 30 hours.
The same was also performed with MSPM containing optimum phenol concentration.
2.8. Extraction of PHB
Cells were collected by centrifugation at 7000 rpm for 10 minutes. Pellets were washed with
phosphate buffered saline, air dried and weight taken. Chloroform and 4% sodium
hypochlorite were added to the cell pellet in the ratio 1:1/mg of pellet weight. After overnight
incubation at 300C the pellet was centrifuged and the bottom phase containing PHB was
transferred to another fresh tube and the volume measured. Then 5X volume of a mixture of
methanol and water (7:3v/v) was added. After centrifugation the precipitate was collected
and washed with water and isopropanol.[9]
2.9. Fourier Transform Infrared analysis
The biodegradation of phenol and also the accumulation of PHB were confirmed by Fourier
Transform Infra-Red spectroscopy. The ether extracts of both uninoculated and inoculated
MSPM were subjected to FT/IR analysis.
2.10. Optimization of pH and incubation period for maximum growth pH
100 ml aliquots of the mineral salt phenol medium prepared with pH varying from 2 to 12
were taken, inoculated with the bacterial suspension and incubated a room temperature on a
rotary shaker at 300 rpm. Growth of the culture was observed after 24 hours.
Incubation period
100 ml aliquots of the mineral salt phenol medium taken were inoculated with the bacteria
and incubated for various time intervals on a shaker at 300 rpm. Turbidity of the culture
measured at 600 nm in every hour after inoculation and was plotted against various
incubation time.
2.11. Treatment of paper pulp waste water
Waste water collected from the paper pulp industry was diluted by 4 times and the phenol
concentration was measured.100 ml of waste water was inoculated with 1ml(1OD) cell
300rpm. Phenol content and COD of the waste water sample were analyzed before and after
incubation as per the procedure of ASTM.[11]
3. RESULTS AND DISCUSSION 3.1. Screening for Phenol degradation
The microbial biodiversity is vast to be identified and the biochemical versatility of microbes
is yet to be exploited. The bioremediation approaches focus on this potential and intend to
screen out organisms which can decompose toxic chemicals through unique metabolic
pathways mediated by enzymes. In the present study Bacillus subtilis sp designated as sp3
was confirmed to utilize phenol which is a common aromatic contaminant in many industrial
effluents.
The soil samples from detergent contaminated areas of four different places viz. Edathitta,
Elakolloor, Pathanapuram and Konni, situated in the district of Pathanamthitta, Kerala, India
were subjected to screening and the samples from all the different regions showed the
presence of phenol tolerating bacteria.12 isolates were obtained from primary screening and
when subjected to enrichment, bacterial isolates in the sample from Edathitta showed
maximum efficiency in phenol degradation. The mineral salt phenol medium used for
screening contained phenol at 4mM concentration as the sole source of carbon. The sample
was found to be a consortium on quadrant streaking and the components were subjected to
isolation. Enrichment is an apt method to screen out bacteria capable of utilizing complex
substances. The gradual increase in the concentration of phenol in the MSPM leads to the
isolation of efficient strains involved in phenol degradation.
3.2. Isolation and identification of microorganism from the consortium
Three types of colonies were identified and are named as sp1, sp2 and sp3 which were
selected on the basis of growth under stress induced by phenol. It is well known that certain
groups of microorganisms produce poly hydroxy alkanoate granules under stress condition as
reserve energy store.[12] The strain SP3 from the consortium was identified as the fast
growing and most efficient phenol degrading bacteria with PHB accumulation and was
selected for further studies (Table 1). The identity was established through morphological and
biochemical analysis of the isolate. 16S rRNA analysis is most dependable for characterization of bacteria as it provides a conserved regions in required rates. Phylogenetic
was designated as Bacillus subtilis sp3. The sequence and dendrogram are given as Fig.1 and
Fig.2.
[image:7.595.105.478.164.741.2]Table 1: Secondary screening of the three selected isolates based on the percentage of phenol degradation obtained in MSPM during 24 hours of incubation.
Fig 1: 16 S r RNA gene sequence of the selected isolate sp 3. Designation of
microorganism
Percentage of Phenol degradation
sp 1 66.66±0.6
sp2 54.40±0.4
FIG 2: Dendrogram Of sp3.
3.3. Phenol degradation and PHB accumulation
Phenol degradation and intracellular PHB accumulation efficiency of the selected isolate is a
unique property The organism was capable of degrading phenol upto 30mM concentration.
The rate of phenol degradation was found to decrease along with increase in concentration of
phenol from 12mM concentration. There was no growth in 30 mM phenol concentration
which could be considered as the inhibitory concentration of phenol to the selected bacterial
isolate. Phenolic stress induces the production of PHA granules. In all the three isolates PHB
granules were observed during sudanblack staining. The presence was again confirmed by
nile blue staining for PHB granules using Atomic Force microscopy (Fig.3). PHB is produced
in the bacteria as a reserve food material and this can be extracted out from bacteria as they
plastic. Scale up and optimization are needed to enhance the accumulation of PHB under
[image:9.595.129.470.128.302.2]phenol stress and also to enhance the amount extracted from the bacterium.
Fig 3: Atomic force microscopic image showing PHB accumulation in Bacillus subtilis sp3 grown in MSPM.
3.4.Growth studies of the selected isolate Bacillus subtilis sp3
Growth studies in nutrient broth was conducted to monitor the growth of the selected
organism in a general nutrient medium and growth studies in MSPM was conducted to
analyze the growth pattern of the strain in specific basal medium ( Fig.4 and Fig.5) In
MSPM, phenol is being provided as both carbon and energy source. When comparing the
growth curves it was clear that in the MSPM the initial lag is well extended. In the stress
condition the microorganism takes time to acclimatize with the condition. The increase in
turbidity indicated the active growth of bacteria. After acclimatization the bacteria could
exhibit fast growth in MSPM and reached the stationary phase at about 26th hour as in
nutrient broth.
[image:9.595.135.460.587.744.2]Fig 5: Growth curve of the selected Bacillus subtilis sp3 in MSPM.
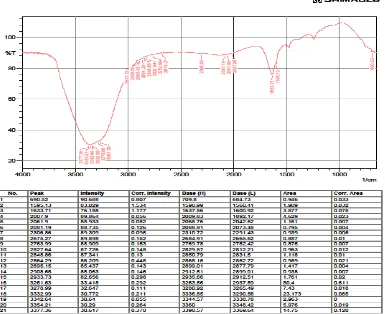
3.5. FT/IR analysis of the mspm for confirming phenol degradtion and PHB production
FT/IR analysis of the organic extracts of MSPM inoculated with Bacillus subtilis sp3was
carried out to trace the phenol degradation and PHB production after 24 hours of incubation.
Fig.6 represented the control, ie the FT/IR of the uninoculated MSPM and the Fig.7
represented the sample ie MSPM inoculated with the selected isolate and incubated for 24
hours. The broadening of bands above 3000 cm-1 together with the new bands formed at 2700
cm-1, 2300 cm-1,nearly 2000 cm-1 represented PHB accumulation during phenol degradation.
PHB is accumulated intracellularly in the form of inclusion bodies and may account for up to
Fig 7: FT/IR analysis of the organic extract of MSPM inoculated with Bacillus subtilis sp3and incubated for 24 hours.
3.6. Optimization of pH and incubation period for maximum growth
The selected organism, Bacillus subtilis sp3 was capable of degrading phenol and
accumulating PHB progressively along the logarithmic phase of growth. Hence an attempt
was made to optimize the conditions, particularly pH (Fig.8) and incubation period (Fig.9) for
the maximum growth of the organism. The pH optimization studies were conducted at
different pH from 5 to 10. A maximum cell concentration could be observed at pH 7. The
biomass concentration at pH 5 and 6 were less. The cell concentration was found to be
decreasing progressively in the alkaline range also. On evaluating the effect of incubation
[image:12.595.107.492.91.405.2]Hence a pH of 7 and incubation period of 24 hour were selected as the optimum conditions
[image:13.595.112.486.127.314.2]for phenol biodegradation.
[image:13.595.110.487.354.540.2]Fig 8: Effect of pH on growth of Bacillus subtilis sp3 in MSPM.
Fig 9: Effect of incubation time on the growth of Bacillus subtilis sp3 in MSPM.
3.7. Treatment of waste water from paper pulp industry: Phenol concentration of the waste water collected from paper industry were decreased after the bacterial treatment.
Correspondingly there was progressive decrease in Chemical oxygen demand on treatment
with the selected isolate for 24 hours(Table 2).
Table 2: Tretment of the phenolic effluent with the selected isolate Bacillus subtilis sp3.
Parameters Before
treatment
After treatment
Phenol concentration(mM) 9±0.5 5±0.3
Maximum percentage reduction of COD was 64% after 24 hours of treatment. This is
effected because of the reduction in the concentration of phenol along with it reduction in the
load of other organic contaminants. Colour, pH variation and high COD are the main
problems associated with paper mill effluents. Various derivatives of phenol like
dichlorophenol and pentachlorophenol are also observed in general.[13] In the present study
the bacteria showed active growth in the diluted waste water in lab conditions and could
achieve considerable COD reduction. In the aerobic treatment systems of paper and pulp
effluents bacteria show better performance, mainly due to the ability to tolerate wide pH
ranges. Further studies are being progressed to optimize the degradation process.
Treatment systems like titanium oxide oxidation and photo fenton reactions are expensive as
they are high energy utilizing. So biological treatment systems are preferred to physico
chemical systems in phenolic waste treatment.
We have also reported earlier about Alcaligenes sp d2 accumulating PHB upon phenol stress
where the accumulation started nearing to complete utilization of phenol.[2] In many of the
cases the property of phenol degradation by bacterial species have been linked to stress
management mechanisms within the species.[14] Polyhydroxialkanoates are reported to be
produced in considerable amounts through acidogenic fermentation where effluents from
paper mill are used. Optimization of production parameters are required according to the
constituents of the effluent.[15] This is a feature to be exploited for the production of
biodegradable plastics using inexpensive sources.
CONCLUSION
Phenol is a toxic organic compound which is usually found associated with many industrial
effluents. Its biodegradation is often challenged by the fact that phenol itself is antibacterial
in its action. However many attempts are being made to isolate phenol degrading bacterial
strains from soil in the view point that bioremediation strategies could be developed and the
molecular biology of the same may be explored. In the present study the selected organism
could degrade phenol within ashort span of time. The organism was characterized as Bacillus
subtilis sp3 which showed accumulation of PHB along with phenol degradation. Further
investigations into the process can bring out fruitful strategies for optimization and scaling up
ACKNOWLEDGEMENT: The work is acknowledged for the financial support from Students project Scheme.
Funding: This work was financially supported by Kerala State Council for Science, Technology and Environment, Government of Kerala, Thiruvananthapuram. Council (P)
Order No.84/SPS 58/2016 /KSCSTE dated 24-06-2016.
REFERENCE
1. Michalowics J and Duda W. Phenol- Sources and Toxicity. Pol. J. Environ. Stud, 2007;
16(3): 347-362.
2. Nair, I.C., Jayachandran K and Shashidhar S. Biodegradation of phenol. Afr. J.
Biotechnol, 2008; 7(25): 4951-4958.
3. Van Schie P M and Young L Y. Bioremediation of Phenol: Mechanisms and applications.
Bioremediat. J, 2000; 4(1): 1-18.
4. Kumar, V, Dhali P, Naithani S, kumar A, Kumar R. Biological approach for the
treatment of pulp and paper industry effluent in sequence batch reactor. J. Bioremed.
Biodeg, 2014; 5: 218 doi: 10.472/2155-6199. 1000218.
5. Nuhoglu N, Yalcin B. Modeling of phenol removal in a batch reactor. Process Biochem,
2005; 40: 1233-1239.
6. Garrity VP(ed). Bergey’s manual of Systematic Bacteriology, 3, Springer, 2009.
7. Rochelle PA, Cragg BA, Fry JC, John parkes R, Weightman AJ. Effect of sample
handling on estimation of bacterial diversity in marine sediments by 16S rRNA gene
sequence analysis. FEMS Microbiol. Ecol, 1994; 15: 215-225.
8. Mordocco A, Kuek C and Jenkim R. Continuous degradation of phenol at low
concentration using immobilized Pseudomonas putida. Enzyme Microb. Technol, 1999;
25: 530-536.
9. Panigrahi S, Badveli U, Screening, Isolation and Quantification of PHB producing Soil
bacteria. IJESI, 2013; 2(9): 01-06.
10.Betscheider D, Joachim Jose. Nile Blue A staining for Escherichia coli in flow cytometer
experiments, Anal. Biochem, 2009; 384: 194-196.
11.Cappuccino, J C, Sherman N. In: Microbiology, A Laboratory manual. 3rd ed., New
York; Benjamin Cummings Pub. Co, 1992.
12.ASTM D 1252 Book of standards, Volume 11.02., ASTM international, American
13.Nair, IC, Pradeep S, Ajayan MS, Jayachandran. K, Shashidhar S. Accumulation of
intracellular Polyhydroxybutyrate in Alcaligenes sp d2 under phenol stress. Appl.
Biochem. Biotechnol, 2009; 159, 2, 545-552.
14.Antony, M and Jayachandran.K. Regulation of acyl homoserine lactones synthesis in
Pseudomonas putida JMQS1 under phenol stress". Water Air Soil Pollut. DOI:
10.1007/s11270-016-3018-5.
15.Kamali M, Khodaparast. Z. Review on recent developments on pulp and paper mill waste