Abstract—The work presented in this article consists of the
development of a discrete event simulation model, based on a real case and implemented in an Arena simulation environment. This is aimed at a class of very specific multiphase multiproduct
production lines, with a four closed-loop network
configuration, which is very common in the automobile sector. Also included in this study is an index of economic and functional efficiency, which evaluates cost-efficiency in each of the simulated scenarios. From a conceptual perspective, the idea of a virtual cell, was used in the configuration modeling of the production line. The modeling of complex production systems, based on the concept of virtual cells, allows for a greater understanding of the functioning process of a production line, through the simplification of the production flow and the addition of buffers between the virtual cells. Thus, due to the facility presented by their dynamic configuration, virtual cells constitute an important modeling tool, which should always be used whenever one aims to optimize production flow, namely in the case of production lines with a rather complex configuration.
Index Terms— Virtual Cells, Simulation, Automobile
Assembly Lines
I. INTRODUCTION AND LITERATURE REVIEW Simulation is one of the tools of support in the decision-making process, which allows for the projection and analysis of performance in systems and complex processes. Simulation can be seen as the construction process of a model representing a real system, as well as that of undertaking experiments using the same model with the purpose of better understanding its behaviour and evaluating the impact of alternative operational strategies [1, 2, 3, 4].
Many of the advantages ensuing from the use of simulation can be found in pertinent literature in this field. Some of these advantages can be clearly stated as follows:
• It permits production engineers to test new configurations in the production process, without the need to compromise resources, whose costs would be high [5].
• It can be used to explore new resource grading policies, operational procedures, decision-making rules, organization structures and information flow, without
Manuscript received February 3, 2011; revised February 28, 2011. Luís Pinto Ferreira is with the Escola Superior de Estudos Industriais e de Gestão (Technical-Scientific Unity of Industrial Engineering and Production), Instituto Politécnico do Porto, Portugal (e-mail: [email protected]).
Enrique Ares Gómez is a Full professor in Vigo University, Área Ingeniería de los Procesos de Fabricación, Spain (e-mail: [email protected]). Gustavo Peláez Lourido is with Vigo University, Área Ingeniería de los Procesos de Fabricación, Spain (e-mail: [email protected]).
Benny Tjahjono is with Cranfield University, School of Applied Sciences, Manufacturing Department, UK (e-mail: [email protected]).
having to interrupt the normal functioning of the system [1, 6].
• Simulation allows one to identify the blocking and starvation points on the production line, as well as test the various options with a view to optimizing their performance, thus identifying the causes for delays in the flow of materials, information and other processes [1, 5, 7].
• It can be used for testing explanatory hypotheses as to how and why a specific phenomenon occurs in the system [2].
• Simulation allows one to study a system which encompasses a wide time-span in a compressed period of time, or alternatively, it allows one to make a detailed study of the system’s performance over an extended time period [8].
• It can be used to know the system better and to identify which variables really influence its performance, acting as a support for an improved understanding of reality so as to explain and describe it, or as a support in decision-making [9, 10].
• It also enables users to test the system’s behaviour when confronted with new and unexpected situations [1, 10], as well as constituting a support for decision-making regarding investment in new technologies and equipment, improving production capacity and the management of material and human resources [11]. Despite all the benefits one can gain from the use of simulation as a support tool in the decision-making process, it also presents a few relevant drawbacks, the most significant of which are:
• Simulation does not provide optimal solutions for case-study problems - it does, however, allow one to evaluate the system’s behaviour in accordance with specific scenarios, which are created by the analyst for the purposes intended [1,2].
• If the model does not constitute a valid representation of the system being studied, the simulation results will not produce much useful information about the real system [8, 10].
The work described in this article consists of the development of a simulation model in an Arena environment, based on a real case, and is aimed at a very specific class of production lines, with a four closed-loop network configuration, commonly used in the automotive sector. This study is a sequence of another, developed by Resano et al. [12,13,14,15], who designed one of the first analytical models for an assembly line in the vehicle sector as a network of four closed loops of machines, decoupled by intermediate buffers formed by conveyors. They consider that machines process pallets which are not univocally related to each other. Both in the analytical model, as well as in the simulation presented here, one can analyse the
Optimization of a Multiphase Multiproduct
Production Line based on Virtual Cells
blocking and starvation phenomena on a complex production line; these models also consider the proportion of four- and two-door cars between the door disassembly and assembly stations. There is no knowledge of any other work in specialized literature, in the area of simulation, which includes all these factors, considered to be of such specific relevance in the performance of these types of manufacturing systems [16,17,18].
There are, in fact, very few studies undertaken which use simulation as a support tool in the decision-making process in the context of networks of closed-loop production lines. There is, however, a wider range of bibliography whenever the purpose of the study presupposes the development of analytical models for these types of configurations. [19] developed a simulation model based on the Siman language, with the purpose of maximizing the production line rate, with a closed-loop configuration, through the optimization of time distribution over the entire cycle, in all the different work stations. [20] developed a model for a network configuration to be used on a production line, comprising various machines, where assembly and disassembly operations are undertaken. This model is based on the first simulator for continuous flow, introduced by [21], where the discrete traffic of components is likened to a continuous flow. However, this study does not consider the phenomena of blockage transmission and starvation in a network of various closed loops. [22] proposed an analytical model to estimate the performance parameters of a closed-loop production line, characterized by limited capacity buffers and failure-prone machines. [23] resorted to the “Quest” language in order to develop a simulation model for a production line with a closed-loop configuration. Their purpose was to optimize its functioning through a better balance in the production flow. In fact, various rules and conditions were evaluated so as to ensure a more effective planning and control of the entire production system. Yet, for this study, the authors did not take into account the phenomena of machine blockage and starvation. Neither did they consider an external variable (x). These factors were included in the simulation model developed in this study. [24] created a tool to be used in the analysis of production lines with a network configuration of various closed loops. He developed a graphic and induction model to analyze efficiently the phenomena of blockage and starvation. Nevertheless, for the construction of the model, this author did not introduce an external variable (x), which is represented by the four-door car body proportion in the simulation model developed within the framework of this study. [25] developed an analytical model to evaluate and optimize the performance of an assembly line of semiconductors, characterized by a two closed-loop configuration. This study aimed to evaluate the impact of several parameters on the performance of the system, such as the number of circulating pallets and machine processing times, amongst others.
II. CONCEPTUAL MODELING BASED ON VIRTUAL CELLS From a conceptual perspective, one used the concept of a virtual cell in the modeling of the production line. This cell is also known as a reconfigurable cell. The concept of the virtual cell was first introduced by [26] in order to develop control software for an automated production line of small
lots of parts. According to [27], the greatest difference between a virtual cell and the traditionally manufactured cell resides in the dynamic nature of the former. In the case of traditionally manufactured cells, the location of work stations is fixed and perfectly identifiable. The same does not happen with virtual cells, since they will vary according to the requirements at hand. According to [28], a virtual cell is any production scenario, from the lowest levels in a manufacturing hierarchy (for example, a CNC machine), to the highest (for example, a factory). Its internal organization allows for the manufacture of different types of products, as well as that of establishing significant parameters in its production capacity.
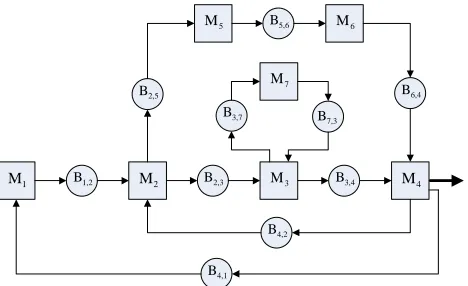
Figure 1 represents the main automobile line, as well as the door and front axle preassembly lines, as a network of four closed loops of machines (M) and intermediate buffers (B) formed by conveyors. Each of the intermediate buffers possesses a limited capacity, in accordance with the number of pallets it can contain. The time cycle for each machine is fixed and deterministic.
1
M B1,2 M2 B2,3 M3 B3,4 M4 5
M B5,6 M6
2,5
B
3,7
B
7,3
B
7
M
6,4
B
4,2
B
4,1
[image:2.595.307.541.296.439.2]B
Figure 1. Main automobile assembly line and preassembly lines.
The sum of the car bodies, door and front axle assembly pallets stored in each of the intermediate buffers of the three first closed-loops remain, respectively, constant at any time and are defined by Equations (1) to (3). This fact, as well as other analyses undertaken to evaluate the influence of different variables which interfere in the performance of the automobile assembly line being studied, was previously analysed in [12, 13, 14, 15].
237
n
n
n
n
12+
23+
34+
41=
(1)n
25+
n
56+
n
64+
n
42=
450
(2)n
37+
n
73=
138
(3)The fourth closed-loop defines the relationship between the number of pallets with doors in different preassembly states and the number of pallets of cars with disassembled doors via an external variable (x), according to Equation (4). This variable represents the four-door car ratio between the doors’ disassembly stations, located at M2, and the doors’assembly stations, located at M4 . This variable can take on values of between 0 and 1.
Equation (4):
(
n
n
n
n
n
)
·
(
1
x
)
n
n
n
n
Where n5 and n6 are the numbers of stations M5 and 6
M , n2is the number of stations at M2, from the door disassembly stations, n3 is the number of stations at M3, and n4 is the number of stations at M4 to the door assembly stations. The valuesn2,n3,n4,n5and n6remain constant. Replacing the sum of their values in Eq. (4) the following is obtained [12, 13, 14, 15]:
(
216
n
n
)
·
(
1
x
)
60
n
n
n
25+
56+
64+
=
+
23+
34+
(5)The simulation model presented in this article is based on these equations in order to determine the number of pallets which must circulate on each of the 4 closed-loops which exist on the analyzed automobile assembly line.
On the first three loops, the velocity (V) of the intermediate buffers formed by conveyors is: V1,2=16m/minute,
V2,3 = 16m/minute, V3,4 = 16m/minute, V4,1 = 16 m/minute,
V2,5 = 25m/minute, V5,6 = 25m/minute, V6,4 = 25 m/minute,
V4,2 = 25m/minute, V3,7 = 45m/minute, V7,3 = 45m/minute.
Figure 2 presents the automobile assembly line analyzed for this study. In the same manner as [12], 7 virtual cells were constituted so as to better understand the trajectories of the state of the intermediate buffers formed by conveyors, positioned between each virtual cell and thus ensuring supply to the cells and avoiding starvation points. These virtual cells are represented by each of the machines (M) presented in figure 2. In the automobile production line being analyzed, each of these constitutes a set of different types of stations (for example, manual stations, automatic stations, semi-automatic stations, etc.), which are logically grouped with the purpose of undertaking a specific set of tasks. For this study, one used this modeling of line configuration to develop a decision-making support system based on a discrete event simulation model for a multiphase multiproduct automobile production line. The main objective here was to compare the results obtained by [12], which is based on analytical methods, with those obtained through the simulation models.
1
M B1,2 M2 B2,3 M3 B3,4 M4 5
M B5,6 M6
2,5
B
3,7
B
7,3
B
7
M
6,4
B
4,2
B
4,1
B
Virtual cell 5
Virtual cell 6
Virtual cell 4 Virtual cell 7
Virtual cell 3 Virtual cell 2
[image:3.595.306.541.52.214.2]Virtual cell 1
Figure 2. The modeling of the automobile assembly line based on 7 virtual cells.
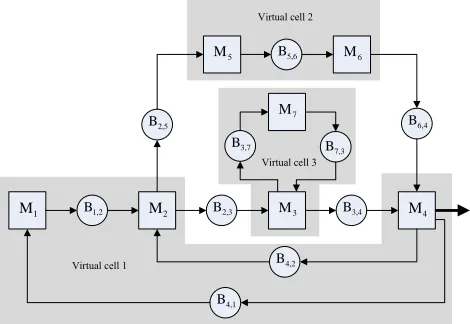
Another line configuration modeling option based on 3 virtual cells could be used for the analysis and optimization of the automobile assembly line being studied, as is presented in figure 3.
1
M B1,2 M2 B2,3 M3 B3,4 M4 5
M B5,6 M6
2,5
B
3,7
B
7,3
B
7
M
6,4
B
4,2
B
4,1
B
Virtual cell 2
Virtual cell 1
Virtual cell 3
Figure 3. Modeling of the automobile assembly line based on 3 virtual cells.
Another modeling example based on the concept of virtual cells is presented in figure 4, in which the automobile assembly line is structured on the basis of 2 virtual cells.
1
M B1,2 M2 B2,3 M3 B3,4 M4 5
M B5,6 M6
2,5
B
3,7
B
7,3
B
7
M
6,4
B
4,2
B
4,1
B
Figure 4. Modeling of the automobile assembly line based on 2 virtual cells.
III. CHARACTERISTICS OF THE DECISION-MAKING SUPPORT SYSTEM DEVELOPED
In the context of this project, all the work was developed in an Arena simulation environment [29]. Its simulation language constitutes a visual and flexible programming tool, directed at the object, since it simultaneously combines the construction of simulation models with the integration of different commonly used languages: Visual Basic, C, C++. This language is based on the SIMAN simulation language [30].
The purpose of the use of an Arena simulation environment was that of enabling the production engineer to evaluate the performance of the automobile assembly line, through the variation of different parameters, thus contributing to an improved specification, characterization and definition of the most efficient control system. With this objective in mind, a support system for decision-making was developed; this enables the automatic generation of different simulation models. In the initial stage of simulation, the user is able to interact with the system to be developed, through the introduction of various parameters such as:
• The four-door car ratio (x);
[image:3.595.310.552.295.453.2] [image:3.595.54.294.540.704.2]• The production sequence in accordance with each type of car (two- or four-door);
• The speed and length of the intermediate buffers formed by conveyors;
• Simulation time;
• The number of pallets circulating on the first three closed-loops.
[image:4.595.309.542.47.329.2]Figure 5 presents the graphic interface which allows the user to configure the above mentioned parameters.
Figure 5 – Parameterization of the automobile assembly line.
Another contribution made by this study was that of integrating an automatic report generator in the simulation environment; this presents information on the main performance indexes of the simulated models, using graphic visualization, which required the integration of various applications in the Arena simulation environment, such as: Visual Basic for Applications (VBA), Visual Basic (VB),
Microsoft Access (Database), Crystal Report (Graphics
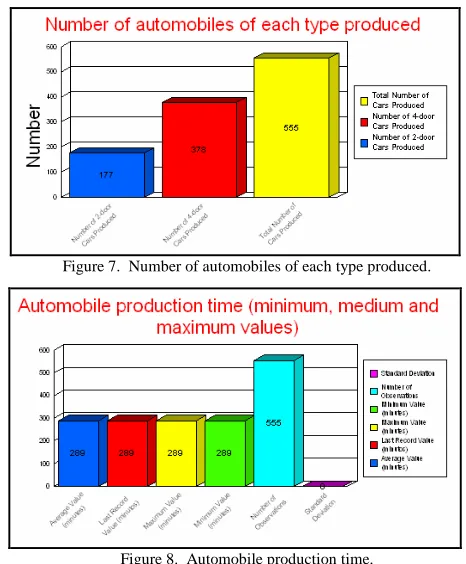
Edition). In this context, it is worth highlighting the visual aspects of the graphics produced (three examples are presented in figures 6, 7 and 8), which allow the user to have a better perception of the performance of the simulated models.
From among those considered, the following performance indicators are highlighted:
• Machine Usage Levels;
• Number of Cars for each of the types produced;
• Number of operations undertaken on each of the machines;
• Production time/vehicle;
[image:4.595.47.294.181.333.2]• Relationship between the time cycle of each machine and the number of pallets on each upstream buffer.
Figure 6. Number of operations undertaken on each of the machines.
Figure 7. Number of automobiles of each type produced.
Figure 8. Automobile production time.
IV. VALIDATION OF THE SIMULATION MODEL PROPOSED In [12, 14, 15] the incompatibility between equations (2) and (5) (see section 2) was demonstrated. These define the sum of the number of pallets on the intermediate buffers which constitute the second and fourth closed loop, with some of the maximum and minimum capacities of the corresponding intermediate buffers, for the specific values of variable x. This incompatibility reveals that the automobile assembly line cannot operate in practice for x<0.37, in both the stationary and transitory regimes, and for x>0,97, in the stationary regime. As with any simulation project, an important phase is the validation of the model constructed; this ensures that it is a faithful representation of reality and can then be used for decision-making. Through the simulation model developed in the context of this study, and for the automobile production line being analyzed, one also verified that the system did not function for the values of x<0,37 and x>0,97, due to the phenomena of blockage and starvation occurring on the machines integrating the analyzed model. In the same way, one also noticed that, once the minimum buffer capacity mentioned in [12, 13] was reached, a continuous supply of transport and assembly pallets to machines was assured [16]. In the context of this work, the validation of the simulation model proposed was confirmed, on the basis of these two presuppositions.
[image:4.595.49.288.580.744.2]specific aspects pertaining to the multiphase multiproduct automobile production line being studied. Table 1 below presents the variables used in the development of the (EFI) so as to evaluate its cost-effectiveness.
TABLE 1
VARIABLES USED IN THE DEVELOPMENT OF THE EFI Nij Total number of type i parts produced for each j machine
PTij Processing time for the type i part on machine j
MCij Manufacturing cost of the type i part on machine j
per time unit
CNUj Cost of non-usage of machine j per time unit
TIj Time of inactivity of machine j
CPIFD Costs of penalties incurred due to failure to meet delivery deadlines
TDO Time of delay in completing an order
CPz Cost based on the number of pallets circulating on loop z
(z =1,2,3)
ECLz Energy costs for loop z (based on the loop’s velocity, the
number of pallets, etc.) (z =1,2,3)
CLCLz Cost associated to the length of the conveyors on loop z
(z =1,2,3)
All the variables are real and the costs are obtained on the basis of a pre-established time unit. The EFI includes the following components:
EFI = Fixed cost of manufacture + Cost of machine non-usage + Cost of failure to meet delivery deadline + Cost of pallets + Energy costs + Cost associated to the length of the conveyors
In this manner, and considering the previously described variables, the following economic index function was obtained. This will allow one to calculate the most representative costs for each of the simulated scenarios: EFI=
∑
= 7 1 MCij * PTij * Nij j +∑
= 7 1 TIj * CNUj j + TDO *CPIFD +
∑
= 3 1 CPz z +
∑
= 3 1 ECLz z +∑
= 3 1 CLCLz zIn the same way, one can calculate the most representative costs for each of the simulated scenarios, in accordance with the first three loops on the production line. Thus, considering that EFI 1, EFI 2 and EFI 3 respectively represent the economic índex function associated to loop 1,
loop 2 and loop 3, one can then obtain the following
economic indicators: EFI1=
∑
= 4 1 MCij * PTij * Nij j +∑
= 4 1 TIj * CNUj j + TDO *CPIFD +CP1 + ECL1 + CLCL1
EFI2=
∑
=2,4,5,6
MCij * PTij * Nij j +
∑
=2,4,5,6
TIj * CNUj j + TDO *
CPIFD +CP2 + ECL2 + CLCL2
EFI3=
∑
=3,7
MCij * PTij * Nij j +
∑
=3,7
TIj * CNUj j + TDO *
CPIFD +CP3 + ECL3 + CLCL3
VI. CONCLUSION
In this paper, an automobile assembly line and different preassembly lines were modelled as a network of four closed-loop machines and intermediate buffers formed by conveyors, constituting a configuration which is widely used in these kinds of assembly lines. Using an Arena simulation environment, a representative model of this line was developed with the purpose of providing the production engineer with a better understanding and assessment of its performance; it represents, on the computer screen, each moment in the state of the system and its evolution over time, thus allowing for improved communication between the model and the user. In fact, the great visual component of the models developed allows for a clear understanding on the part of the decision-making agents who will eventually use them, since they will be able to view the interaction occurring between the entities which make up the model, allowing for a better understanding of the simulation results. The authors believe that, by producing this study, they have contributed to emphasising the importance of the use of simulation in the development, on computer, of virtual environments which reproduce the behaviour of many real systems.
As perspectives of future work, some actuation lines stand out, as a natural continuation of the proposals presented here:
• Evaluated the impact of the pallet numbers circulating on the first three closed loops on the performance of the production line, translated into the number of cars produced/hour, in order to improve the availability of the entire manufacturing system for any value of x.
• Assess the impact of the length of intermediate buffers on the performance of the production line, translated into the number of cars produced / hour, in order to improve the availability of the entire manufacturing system for any value of x.
• Impact evaluation that the sequence of production of different types of cars in the automobile assembly line performance.
• Behaviour evaluation of the production line when a new car type is inserted.
REFERENCES
[1] Robert E. Shannon, “Introduction to the Art and Science of Simulation”, in Proceedings of 1998 Winter Simulation Conference. [2] Ricki G. Ingalls, “Introduction to Simulation”, in Proceedings of
2001 Winter Simulation Conference.
[3] Michael Andersson, Göte Olsson, “A Simulation Based Decision Support Approach For Operational Capacity Planning In A Customer Order Driven Assembly Line”, in Proceedings of 1998 Winter Simulation Conference.
[4] Villa, A; Ares Gómez, J. E. ,1998, “A methodology to analyze workshop lines by discret event dynamic models”. Recent Developments in Production Research, edited by A. Mital.
[5] Jerry Banks, “Introduction to Simulation”, in Proceedings of 2000 Winter Simulation Conference, J.A. Joines, R. R. Barton, K. Kang, and P. A. Fishwick, eds.
[6] Ares, E., Peláez, G., “Integración de línea y célula flexibles en un modelo jerárquico para la planificación y programación de la producción”, Febrero 1997, XII Congreso Nacional de Ingeniería Mecánica, Anales de Ingeniería Mecánica, Revista de la Asociación Española de Ingeniería Mecánica.
[8] Guimarães Rodrigues, Valério de Carvalho, 1984, “CAPS – ECSL, Experiência de modelagem e simulação aplicada a um sistema de elevadores”, Universidade do Minho.
[9] Averill M. Law, W. David Kelton, 1991, “Simulation Modeling & Analysis”, Second Edition, McGraw-Hill International Editions, ISBN 0-07-036698-5.
[10] Reuven Y. Rubinstein, Benjamin Melamed, 1998, “Modern Simulation and Modeling”, Wiley Series in Probability and Statistics, Applied Probability and Statistics Section, A Wiley-Interscience Publication, John Wiley & Sons, INC., ISBN 0-471-17077-1. [11] Charles Mclean, Swee Leong, “The expanding Role of Simulation in
Future Manufacturing”, in Proceedings of 2001 Winter Simulation Conference.
[12] A. Resano Lázaro, 2007, “Análisis Funcional y Optimización de la Distribuición en Planta de una Línea de Ensamblaje de Automóviles”, PhD Thesis, directed by Prof. C. J Luis Pérez. Departamento de Ingeniería Mecánica, Energética y de Materiales”, Universidad Pública de Navarra.
[13] A. Resano Lázaro, C. J. Luis Pérez, 2008, “Analysis of an automobile assembly line as a network of closed loops working in both, stationary and transitory regimes”. International Journal of Production Research, 1366-588X, Volume 46, Issue 17, Pages 4803-4825.
[14] A. Resano Lázaro, C. J. Luis Pérez, 2007, “Analysis and enhancement of the four-door cars proportion limits in a real automobile assembly line working in transitory regime”, Second Manufacturing Engineering Society International Conference. Madrid. Spain.
[15] A. Resano Lázaro, C. J. Luis Pérez, 2007, “Dynamic analysis of an automobile assembly line considering starving and blocking. Robotics and Computer Integrated Manufacturing”, Article in Press. DOI:10.1016/j.rcim.2007.11.002.
[16] Luís Pinto Ferreira, E. Ares Gómez, G.C Peláez Lourido, A. Resano Lázaro, C. J. Luis Pérez, “Comparative Analysis between analytical and Arena simulation models applied to an Automobile closed-loops assembly line, modelled like a network of closed-loops”, in Proceedings of 25th International Manufacturing Conference: “Manufacturing and Design – The Next Generation” (IMC2008), Ireland, 3rd-5th September 2008.
[17] Ferreira, L[uís]; E. Ares, G[ómez]; G.C Peláez, L[ourido] & Salgado, M[arina] (2010). Analysis of the Influence of Conveyor Speed on the Behaviour of an Automobile Assembly Line, Chapter 41 in DAAAM International Scientific Book 2010, pp. 463-470, B. Katalinic (Ed.), Published by DAAAM International, ISBN 978-3-901509-74-2, ISSN 1726-9687, Vienna, Austria. DOI:10.2507/daaam.scibook.2010.41. [18] Luís Pinto Ferreira, Enrique Ares Gómez, Gustavo Peláez Lourido,
Marina Salgado, José Diéguez Quintas, “Analysis on the Influence of the Number of Pallets Circulating on an Automobile Closed-Loops Assembly Line”, January 2011, International Journal of Advanced Engineering Sciences and Technologies (IJAEST), Volume number 2, Issue number 2, pp. 119-123.
[19] Rajan Suri, Ying Tat Leung, “Single Run Optimization of a Siman Model for Closed Loop Flexible Assembly Systems”, in Proceedings of the 1987 Winter Simulation Conference, A. Thesen, H. Grant, W. David Kelton, eds.
[20] Kouikoglou VS., 2002, “An Efficient discrete event model of assembly/disassembly production networks”, International Journal of Production Research, 2002, 40(17):4485-4503.
[21] D`Angelo H, Caramanis M, Finger S, Mavretic A, Phillis YA, Ramsden E., 1988, “Event-driven model of unreliable production lines with storage”, International Journal of Production Research, 26(7):1173-1182.
[22] David Douard, Bruno Baynat, “Improving Efficiency of Decomposition Methods for Closed-Loop Continuos-Flow Production Models”, ACS`02 – SCM Conference, Poland, October 23-25, 2002. [23] Masayuki Soma, Shinsuke Kondoh, Yasusi Umeda, “Simulation of
Closed-loop Manufacturing Systems focused on Material Balances”, in Proceedings of EcoDesign2003: Third International Symposium on Environmentally Conscious Design and Inverse Manufacturing, Tokyo, Japan, December, 8-11, 2003.
[24] Zhang Z., 2006, “Analysis and design of manufacturing systems with multiple-loop structures”, PhD Thesis, Massachusetts Institute of Technology.
[25] Na Li, Li Zheng, Quan-Lin Li, “Performance Analysis of Two-Loop Closed Production Systems”, Computers & Operations Research, Volume 36, Pages: 119-134, 2009, ISSN: 0305-0548, Elsevier Science Ltd.
[26] C. R. Mclean, H. M. Bloom, T. H. Hopp, “The Virtual Manufacturing Cell”, 1982, Proceedings of Fourth IFAC/IFIP Conference on Information Control Problems in Manufacturing Technology, Gaithersberg, MD, USA.
[27] Adil Baykasoglu, “Capability-based distributed layout approach for virtual manufacturing cells”, 2003, International Journal of Production Research, Volume 41, Issue 11, pages 2597 – 2618. [28] Ares Gómez E., Peláez Lourido G., Gómez Lourido R., “Modelo
Dinamico para la Evaluacion de la Eficiencia de Estrategias de Produccion en Ambiente CIM”, Diciembre 1990, Anales de Ingeniería Mecánica, Revista de la Asociación Española de Ingeniería Mecánica.
[29] W. David Kelton, Randall P. Sadowski, David T. Sturrock, 2007, “Simulation With Arena”, Fourth Edition, McGraw-hill Series, ISBN-13: 978-0-07-110685-6.
[30] David A. Takus, David M. Profozich, “ARENA Software Tutorial”, in Proceedings of 1997 Winter Simulation Conference.
[31] Ares Gómez, J. E. “Estructura Jerárquica de Metodologías para la Implantación y Gestión de Sistemas de Fabricación Flexible”, Tesis Doctoral, 1986, Universidad de Santiago de Compostela.
[32] Ares Gómez J. E., Perez Garcia J. A. “Estrutura de sistema experto en tambem mode para la toma de decisiones en el diseño e implantación de lay-out en un ambiente CIM”, Diciembre 1990, Anales de Ingeniería Mecánica, Revista de la Asociación Española de Ingeniería Mecánica.
[33] M. A. Sebastián Pérez, J. Conde Collado, E. Ares Gómez, Agostino Villa, “Enfoques acerca del diseño, implantación y optimización de sistemas de fabricación flexible”, Octubre de 1990, Publicaciones del VIII Congreso de Investigación, Diseño y Utilización de Máquinas-Herramienta, San Sebastián.