Agreement in Manual Annotations?
A Meta-Analytic Investigation
Petra Saskia Bayerl
∗ Erasmus UniversityKarsten Ingmar Paul
∗∗University of Erlangen-Nuremberg
Recent discussions of annotator agreement have mostly centered around its calculation and inter-pretation, and the correct choice of indices. Although these discussions are important, they only consider the “back-end” of the story, namely, what to do once the data are collected. Just as impor-tant in our opinion is to know how agreement is reached in the first place and what factors influ-ence coder agreement as part of the annotation process or setting, as this knowledge can provide concrete guidelines for the planning and set-up of annotation projects. To investigate whether there are factors that consistently impact annotator agreement we conducted a meta-analytic investigation of annotation studies reporting agreement percentages. Our meta-analysis synthe-sized factors reported in 96 annotation studies from three domains (word-sense disambiguation, prosodic transcriptions, and phonetic transcriptions) and was based on a total of 346 agreement indices. Our analysis identified seven factors that influence reported agreement values: annota-tion domain, number of categories in a coding scheme, number of annotators in a project, whether annotators received training, the intensity of annotator training, the annotation purpose, and the method used for the calculation of percentage agreements. Based on our results we develop practical recommendations for the assessment, interpretation, calculation, and reporting of coder agreement. We also briefly discuss theoretical implications for the concept of annotation quality.
1. Introduction
Recent years have seen a growing emphasis in the field of computational linguistics to provide empirical evidence that manual annotations satisfy at least minimal standards of data quality. This trend is indicated by a rising number of publications on method-ological and statistical issues of how to measure and interpret inter-annotator agreement (Carletta 1996; DiEugenio and Glass 2004; Passoneau 2004; Versley 2006; Artstein and Poesio 2008) as well as a rising number of reports on annotation quality and schema
∗ Rotterdam School of Management, Burgemeester Oudlaan 50, 3062 PA Rotterdam, The Netherlands. E-mail:[email protected].
∗∗ Chair of Psychology, Lange Gasse 20, 90403 Nuremberg, Germany. E-mail:[email protected].
validity (Teufel, Carletta, and Moens 1999; Calhoune et al. 2005; Gruenstein, Niekransz, and Purver 2005; Purver, Ehlers, and Niekrasz 2006).
The main reason for the analysis of annotation quality is to obtain a measure of the “trustworthiness” of annotations (Artstein and Poesio 2008). Only if we can trust that annotations are provided in a consistent and reproducible manner, can we be sure that conclusions drawn from such data are likewise reliable and that the subsequent usage of annotations is not negatively influenced by inconsistencies and errors in the data. Inter-annotator (or inter-coder) agreement has become the quasi-standard procedure for testing the accuracy of manual annotations. This process is based on the assumption that if multiple coders agree in their coding decisions of the same material we can be certain that—at least for this set of data and this set of coders—annotations are free of unsystematic and distorting variations.
Our degree of certainty depends on the ability of annotators to reach sufficient agreement in their coding decisions. Perfect agreement among coders is very rare. Slips of attention can lead to errors in the annotations of individual annotators, as can misinterpretations of coding instructions, personal biases, or genuinely disparate inter-pretations of material (Krishnamurthy and Nicholls 2000; Beigman Klebanov, Beigman, and Diermeier 2008). A common rule of thumb requires that annotators should agree in at least 80% of all cases or—if using a chance-corrected measure such as kappa— reach values of at least 0.67 (Carletta 1996; DiEugenio and Glass 2004). Some recent discussions demand even higher agreement values from 0.80 up to 0.90 (Neuendorf 2002; Artstein and Poesio 2008).
Experience has shown that such values are often hard to achieve, even when the coding task appears to be easy. To name only two examples: For the ib2b smoking challenge, agreement between medical experts on the smoking status of patients only reached 60% (Uzuner, Szolovits, and Kohane 2006). In a recent review of the word-sense disambiguation domain, Navigli (2009) reported upper boundaries for coder agreement of 90% for coarse-grained/binary sense inventories, but only 67–80% for fine-grained inventories. Comparing annotations of the same data by independent coder groups can even yield agreement rates as low as 22% (Andreevskala and Bergler 2006; Grefenstette et al. 2006). Disagreements in human annotators are thus a common occurrence, and computational linguists expend considerable efforts to improve agreement rates among coders.
The question is whether processes that lead to disagreement among coders are unsystematic, or whether there are conditions and settings that impact annotator agree-ment in a predictable way. Computational linguists have started to tackle this question (Oppermann, Burger, and Weilhammer 2000; Syrdal et al. 2001; Pitt et al. 2005). Possible influences on annotation decisions identified in past studies are the complexity of annotation schemes (Popescu-Belis 2008), the degree of annotators’ expertise (Lewis, Watterson, and Houghton 2003), the difficulty of the material (Wiebe, Wilson, and Cardie 2005; Beigman Klebanov and Beigman 2009), or the usage properties of indi-vidual words (Passonneau, Salleb-Aouissi, and Ide 2009). These findings point to a combination of annotator characteristics, such as level of expertise, and external factors, such as characteristics of the material or annotation scheme.
problems and potential reasons for lower agreement rates. In the same regard, knowing which annotator characteristics are conducive to consistent and reliable work enables us to select annotators that meet these criteria.
Unfortunately, despite a wealth of annotation studies and practical experiences, we still lack a clear picture on what influences inter-annotator agreement. Although individual studies have found potential factors, it is unclear whether these findings are applicable only to the specific project or task in which they were observed, or whether they represent systematic influences on annotator agreement over a wide range of (or even all) situations. The main question guiding our study in this article was therefore whether we are able to identify factors that impact coder agreement in systematic ways across multiple studies and multiple domains.
Trying to propose a general framework of factors influencing annotator agreement is challenging, as manual annotations are required in a vast range of tasks from POS-tagging to prosodic transcriptions, word-sense disambiguation, the classification of text genres, or the identification of gestures or emotions. Moreover, each annotation project has its specific, idiosyncratic features. If factors such as annotator expertise or scheme granularity are important influences in one specific project, how can we be sure that this is also the case in other projects or other areas?
The best approach to answer this question is to review and synthesize informa-tion from a wide variety of studies in the same field. In this article we used a meta-analytic approach to synthesize existing information on inter-annotator agreement. Meta-analysis is a statistical method that combines and compares results of independent studies to obtain an overview of the respective research field. It is further used to identify factors with a (statistically) significant impact on the outcomes of individual studies (Cooper and Hedges 1994b; Lipsey and Wilson 2001).
Our investigation followed two aims: (1) to test whether there are factors that consistently influence annotator agreement, while abstracting from the specifics of indi-vidual annotation projects and settings; and (2) to get a first indication of how far these influencing factors are generalizable across different annotation domains. This second aspect is of considerable practical importance. If influencing factors are comparable across domains, findings from one area can be applied to other areas. If not, each domain has to consider factors that impact coder agreement individually.
This study contributes to the existing literature in that it approaches the question of inter-annotator agreement at the stage when decisions about procedures and settings can still influence the end results. It thus adds to earlier discussions by emphasizing the importance of the earliest stages in the annotation process before and when annota-tions are made. It does so by taking an objective, statistical approach to reanalyze and synthesize findings of existing empirical studies.
In the next section, we give a short introduction to the meta-analytic method and describe the specific procedure followed in the present study. This is followed by the presentation of our findings and a discussion of the practical implications for annotation projects. Based on our results, we formulate recommendations for the planning, execu-tion, and reporting of annotations. Further, we briefly outline the broader theoretical implications and open questions for the concept of manual annotation quality.
2. Method
to the problems that characterize traditional narrative reviews (Cooper and Hedges 1994a). The traditional method has long been criticized for being “unsystematic, hap-hazard, and impos[ing] an impossible information-processing burden on the reviewer” (Hunter and Schmidt 1990, p. 488). As a result, authors of traditional reviews typically fall back on personal strategies with the consequence that different reviewers often come to very different conclusions, even if they analyze the same set of studies (Van Den Noortgate and Onghena 2005).
To prevent such personal biases, meta-analyses use a statistical approach to synthe-size research results. Meta-analyses are “quantitative summaries of research domains that describe the typical strength of the effect or phenomenon, its variability, its statisti-cal significance, and the nature of the moderator variables from which one can predict the relative strength of the effect or phenomenon” (Rosenthal 1995, p. 183). Since the term “meta-analysis” was coined (Glass 1976) and the first studies were published in the fields of education and psychology (Smith and Glass 1977; Glass and Smith 1979), such quantitative syntheses have seen a strong rise in popularity in the psychological, educational, and medical sciences. Other areas are following suit, leading to what has been called a “meta-analytic revolution” (Fiske 1983).
A meta-analysis consists of six basic stages: (1) formulation of the research ques-tions or hypotheses and definition of criteria for the selection of primary studies, (2) comprehensive search for studies on the topic of interest that fit the selection criteria, (3) extraction and coding of relevant data, (4) conversion of study results to an index that makes results comparable across studies (the so-called effect sizesuch as correlations, standardized mean differences, or proportions), (5) combination and/or comparison of results across studies including the investigation of possible moderator variables (i. e., variables that change the strength of an effect or relationship between two vari-ables by either increasing/decreasing its strength or changing its direction), and (6) interpretation and reporting of results. The fifth stage constitutes the “essence of the meta-analysis” (Van Den Noortgate and Onghena 2005, p. 3), in which the results of the primary studies are analyzed statistically. Although all meta-analyses follow the same basic procedure, decisions on each of these steps need to be tailored to the question and data at hand. In the following we detail the procedure followed in our study.1
2.1 Identification and Selection of Studies and Domains
Our main research question was very broad, and we therefore started our search for primary studies with few restrictions. The search for relevant studies used three main approaches. First, electronic searches in computerized databases (MLA, CiteSeer) were conducted using variations and combinations of the keywords manual (annotation), human (coders), agreement, reliability, ITA, inter-coder, inter-annotator, and inter-tagger. Additional Internet-based searches in Google using the same keywords were conducted to find documents published in proceedings and as internal papers, working notes, or theses. Further, on-line reference lists of projects and authors concerned with manual annotations were searched. Additional publications were identified through the back-tracing of references in key articles. In a few cases authors were contacted for papers unavailable through the Internet or libraries. The use of a broad range of search methods and the inclusion of unpublished studies strengthens the representativeness of the
meta-analytic data set for the respective research field and reduces the probability that the meta-analytic results are affected by publication or availability biases (Begg 1994).
All studies found in this first step were checked for relevance and included, if they adhered to the following three selection criteria:
r
The study reported a case of linguistic annotation done by human coders.r
The study reported an agreement index or the agreement could becalculated with the information provided in the text.
r
The study reported the amount of annotated material (e.g., number ofwords, syllables, or phrases).
In some cases authors published the same data and (parts of the) results in two or three different papers. In this case only the most informative source was included in the analysis. In case of overlaps between papers only the results that had not been reported in a study already entered in the analysis were included. In total we reviewed 587 publications that reported instances of linguistic annotations. Of these, 326 studies complied with our inclusion criteria representing a total of 972 agreement indices. Percentages were the most frequent inter-annotator agreement index (56.1% of reported indices), followed by kappa (39.3%) and other measures (4.6%).
The 326 studies stemmed from a wide range of domains such as part-of-speech tagging, orthographic transcriptions, marking of gestures, co-references, or rhetorical structure. One of our objectives in this study was to investigate whether annotation domains differ in the overall level of annotator agreement or the type of factors that influence agreement. To guarantee that results are stable and generalizable, a domain must be represented by a sufficient number of primary studies. If factors or categories within factors are only represented by very few studies, statements about the effect of these factors are hard to generalize to the wider domain.
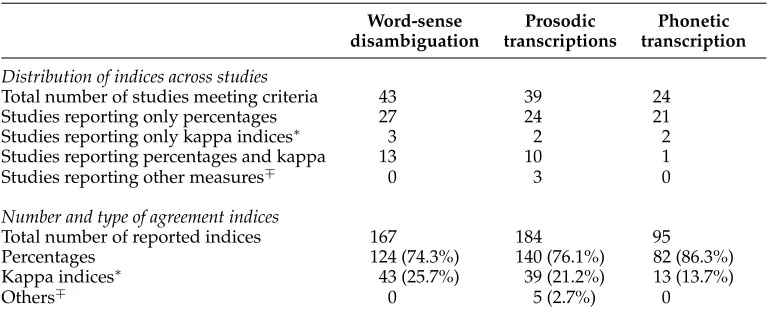
Our data contained three domains with enough data to warrant comparative analy-ses: word-sense disambiguation (167 reported indices from 43 studies), prosodic tran-scriptions (184 indices from 39 studies), and phonetic trantran-scriptions (95 indices from 24 studies). The majority of the indices reported in these domains were percentages (85.9%), followed by kappa (12.9%), and F-measures and alpha measures (together 1.2%). A breakdown of indices per domain is shown in Table 1.
Due to the low number of reports on kappa, we refrained from conducting a meta-analysis also for kappa indices, and restricted our meta-analysis to agreement percentages, which still seems to be one of the most important indicators for annotator agreement. A further reason for our decision to exclude kappa was based on methodological grounds. The calculation of standard errors for kappas, as important information for the meta-analytic procedure, relies on the knowledge of the marginal distribution the index was derived from. This information is generally not provided in publications. A possible way to circumvent this problem is to use general assumptions and estimates for standard errors. This, however, can threaten the validity of the meta-analytic results. Restricting our study to percentages, our analysis was thus based on a total of 346 data points from 96 primary studies.
2.2 Information Extracted from the Primary Studies
Table 1
Number of included studies and indices in the three domains.
Word-sense Prosodic Phonetic disambiguation transcriptions transcription
Distribution of indices across studies
Total number of studies meeting criteria 43 39 24 Studies reporting only percentages 27 24 21 Studies reporting only kappa indices∗ 3 2 2 Studies reporting percentages and kappa 13 10 1 Studies reporting other measures∓ 0 3 0
Number and type of agreement indices
Total number of reported indices 167 184 95 Percentages 124 (74.3%) 140 (76.1%) 82 (86.3%) Kappa indices∗ 43 (25.7%) 39 (21.2%) 13 (13.7%)
Others∓ 0 5 (2.7%) 0
∗This category does not differentiate between disparate versions of the kappa index.∓ Other measures
comprise Krippendorff’s alpha (1 study, 2 indices), Cronbach’s alpha (1 study, 2 indices) and F-measure (1 study, 1 index).
included in the analysis. Instead we extracted all information provided in the primary studies related to the annotation task and setting; for example, reported length of annotator training in hours or days, whether annotators had prior experience with an-notations, their educational background, or the overall reason for calculating inter-annotator agreement. Our investigation thus followed an exploratory approach aiming at the identification of new aspects rather than the confirmation of a priori assumptions (Greene, Caracelli, and Graham 1989). From this first comprehensive overview, eight aspects emerged, for which information was provided in all or at least the majority of studies. These aspects fell into five general categories providing information on charac-teristics of the annotation process and setting, the annotators, the annotated material, the annotation scheme, and the agreement index:
1. Characteristics of the annotation process/setting: Information on the annotation domain, number of annotators, the training of annotators, and the purpose for measuring agreement
2. Characteristics of the annotators: Level of annotators’ domain experience
3. Characteristics of the annotated material: Language of the material
4. Characteristics of the annotation scheme: Number of categories in the scheme
5. Characteristics of the agreement index: Method used to calculate percentage agreement
about the way annotations were carried out, and secondly, a lack of agreement on what should be reported and in what way. Both points are problematic not only for a statistical review such as that conducted in this article, but also for a fair appreciation of agreement figures in reports, as will be discussed subsequently. As a consequence of these observations and based on the results of our meta-analysis, we developed what we consider a minimal set of information that should be reported (see Section 5.2).
2.3 Coding of Information
To be able to compare studies with respect to the characteristics listed in the previous section, we coded each study according to a standard set of categories. For each study we first noted the domain it belonged to (word-sense disambiguation, prosodic tran-scription, or phonetic transcription). With respect to the purpose for the agreement cal-culation we differentiated between four types: (1) proof of sufficient annotation quality to warrant the linguistic analysis of the annotated data, (2) proof for the reliability of a newly developed annotation scheme, (3) part of an annotation study with the aim to identify thresholds or factors that influence inter-annotator agreement (reliability study), and (4) proof of sufficient annotation quality to warrant the use of the data in (semi-)automatic annotations (e.g., as training sets, gold standards, or test sets). For the factor annotator training, we decided to investigate two different levels of granularity: firstly, a binary yes/no differentiation on whether training had taken place; secondly, a three-step differentiation for the intensity of the training as either high, low, or none. Our reason for considering two levels of granularity was that the majority of studies did not report the exact amount of annotator training, even if they reported that annotator training had taken place. Creating a binary yes/no category allowed us to include these studies in the analysis, and thus to provide a broader footing for the question whether annotator training provides benefits or not. The finer granularity in turn allowed us to differentiate between high and low levels of training intensity. The coding of training intensity was based on explicit statements in the reports. For instance, mention of “ex-tensive hands-on training” or “well-trained annotators” were coded as high intensity, whereas reports of “little training” or providing a “short introduction” were coded as low intensity. Some studies reported number of training days. In these cases, we coded durations from two days to several months as high intensity, and durations of one day or less as low intensity. “No training” was only coded if the authors explicitly reported that no training had taken place.
The number of annotators was taken as provided in the text (raw counts). Expert status was assigned by the authors of the primary studies and only coded if annotators were explicitly referred to as “experts” or “novices” in the text. The group of novices generally consisted of (linguistic) students. Our level of novices thus does not refer to complete novices such as the non-expert coders in Amazon’s mechanical Turk task (Snow et al. 2008), but to annotators with reduced domain expertise when compared to an expert group. Language of material was coded as provided in the text. Languages represented by fewer than 15 indices were grouped together according to language families (here Iberian Romance and Asian languages). Languages represented by fewer than seven indices that could not be grouped into a common language family were grouped together into a rest category (“others”). The number of categories in a scheme was recorded as provided in the text (raw counts).
identical judgments between all pairs of annotators. In the majority method, agreement is given if a certain proportion of annotators agree on the classification of an item (two out of three, four out of six, three out of five, etc.). The consensus method requires that all annotators in the group make identical decisions on an item. We further coded the level of inter-annotator agreement, which served as the outcome measure (dependent variable) in all analyses.
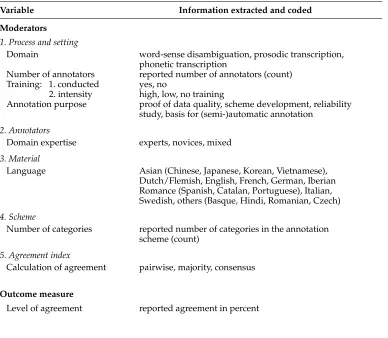
Table 2 provides a summary of all aspects included in our analysis and the coding of the information extracted from the primary studies.
2.4 Data Analysis
[image:8.486.50.438.346.684.2]The first step in the data analysis stage is the description of the distribution of effect sizes and the estimation of the population mean with an associated confidence interval. Because some effect sizes, particularly those from large studies, are more reliable esti-mates of the population effect size than others, the effect sizes are usually weighted by their precision, that is, the inverse of their squared standard error (Van Den Noortgate and Onghena 2005). This strategy was also followed in our study. An agreement rate
Table 2
Information extracted and coded in the primary studies.
Variable Information extracted and coded
Moderators
1. Process and setting
Domain word-sense disambiguation, prosodic transcription, phonetic transcription
Number of annotators reported number of annotators (count) Training: 1. conducted yes, no
2. intensity high, low, no training
Annotation purpose proof of data quality, scheme development, reliability study, basis for (semi-)automatic annotation
2. Annotators
Domain expertise experts, novices, mixed
3. Material
Language Asian (Chinese, Japanese, Korean, Vietnamese), Dutch/Flemish, English, French, German, Iberian Romance (Spanish, Catalan, Portuguese), Italian, Swedish, others (Basque, Hindi, Romanian, Czech)
4. Scheme
Number of categories reported number of categories in the annotation scheme (count)
5. Agreement index
Calculation of agreement pairwise, majority, consensus
Outcome measure
based on a large number of instances thus had a stronger influence on the meta-analytic results than an agreement rate based on a small number of instances. Yet, because we used a random effects model of meta-analysis (see the following), each weighting factor also included an estimate of the variability between all the agreement indices in the analysis. This aspect of random effects models has an equalizing effect on the weights. In sum, indices based on many instances got larger weights than indices based on few instances, but this effect was mitigated by the variance component (i.e., the estimate of the between-studies variability), which is identical for all indices included in a specific analysis (note that the variance component changes when subgroups of studies are analyzed).
Our effect sizes were agreement rates in percentages. No other indices were used in order to guarantee comparability. We used the individual agreement rates in the meta-analysis, not combined rates on study-level. Thus, for some studies more than one agreement rate was included in the analysis when they differed with regard to the moderator variables scrutinized here. For example, when a study reported one agreement rate for experts and a second agreement rate for non-experts, both rates were used separately, because we wanted to avoid the information loss that is associated with combining the indices on study level (Hunter and Schmidt 1990).2
The second step in the analysis stage is to assess whether the mean effect size adequately represents the entire distribution of effects across all studies in the data set. If the variability of effect sizes is small, it can be concluded that the mean effect size characterizes the entire distribution of effect sizes very well. If the variability is large, the mean effect size is not very representative of the whole distribution of effect sizes. The variability thus describes the degree of spread or homogeneity of effect sizes in the sample. To ascertain whether the spread is too large to speak of a homogeneous sample, a homogeneity test is conducted. For this, the observed variability of effect sizes is compared with an estimate of the variability that would be expected from sampling error alone. In order to accomplish this the Q-statistic is used. It is based on a chi-square distribution with k−1 degrees of freedom (k= number of effect sizes) (Hedges and Olkin 1985).
Heterogeneity in effect sizes—indicated by a significant Q-statistic—points to the existence of moderator variables, that is, study characteristics that influence the outcome of the studies and help to explain the wide spread of effects sizes around the mean. Their influence is ascertained through moderator tests. For continuous variables moderator tests are done via meta-regression, which is a modified form of weighted regression (Hedges and Olkin 1985).3 If the independent variable is a categorical
2 In case of one moderator variable (calculation method) this method led to a small number of statistically dependent agreement indices because some authors computed several agreement indices for identical data, for example, by simultaneously reporting pairwise agreement and consensus agreement for the same set of annotations. Altogether, this was the case for eight studies reporting 42 indices based on 19 independent data sets. Because this number of nonindependent indices is low compared to the overall number of indices included in the meta-analysis, the likelihood that they caused a serious distortion of the results is small (Hunter and Schmidt 1990). We therefore decided to keep these indices in the meta-analysis. In order to check the stability of our results, we conducted an additional analysis without the nonindependent indices: 23 indices were eliminated so that all remaining indices were statistically independent. Then all moderator analyses with the overall sample were repeated. All significant moderator effects that were found in the analysis reported in the present article could be replicated, demonstrating that the inclusion of this small number of nonindependent indices did not bias the results of the meta-analysis.
variable, the moderator analysis is done via a meta-analytic analog of analysis of variance (Hedges and Pigott 2004).
Potential moderators in our study were of two types: frequency counts, such as the number of annotators or number of categories in a scheme, and categorical variables (i. e., variables that represent mutually exclusive categories such as type of domain or language of the material). To test whether the potential moderators extracted from the primary studies had a statistically significant impact on agreement, moderator tests were carried out. For counts the moderator tests were conducted using weighted regression analyses; moderator tests for categorical moderator variables were done by comparing the mean agreement rates of categories in a variable with a subgroup moderator test.
For the statistical analysis of the effects sizes, both fixed effects models and random effects models are available. Fixed effect models assume that the observed effect sizes stem from the same common population. Random effects models do not assume a common population of effect sizes. Instead, they assume that effect sizes can stem from multiple populations of which the population effect sizes in the meta-analytic data set is only a random sample. In consequence, the weights in random effects models differ from the weights used in fixed effects models. Weights in random effect models equal the inverse of the sampling error plus the population variance (Van Den Noortgate and Onghena 2005). This has an equalizing effect on the weights, because the estimated population average is the same for all studies, giving small studies a stronger influence on the end results of the meta-analysis. In random effects models confidence intervals tend to be wider and moderator tests tend to have less power, rendering it a more con-servative procedure compared to fixed effects models (Cohn and Becker 2003; Hedges and Pigott 2004). It is thus harder to detect effects of moderator variables, but also less likely to overestimate their influence.
The decision of whether to use a fixed or random effects model depends on the results of the homogeneity test, as well as conceptual deliberations. If the homogeneity test is insignificant, fixed and random effects models lead to the same results. If it is significant, a random effects model should be used. This general rule, however, can change depending on the aim of the analysis. If the researcher only intends to summarize the selected studies in the data set without aiming to generalize to studies outside the original data set, a fixed effects model is appropriate even in the case of heterogeneous effect sizes. When the goal is to generalize to other studies (for instance, to studies that have not yet been published), the use of a random effects model is recommended (Hedges and Vevea 1998).
The aim of our meta-analysis was clearly to generalize to a broader set of annotation projects beyond the ones in our sample. We therefore applied a random effects model for the meta-analytic combination of individual agreement indices across primary stud-ies. Prior to the actual analysis, all values for inter-annotator agreement were logit-transformed. This transformation is recommended if a high percentage of observed values are larger than 0.8, to adjust for the positive skewness in the data (Lipsey and Wilson 2001). In our case 50.2% of reported indices were larger than 0.8, leading to a significantly positively skewed distribution (z=−9.5).
3. Results and Discussion
3.1 Agreement Rates in the Complete Sample
The average inter-annotator agreement for the complete sample was 81%. The individ-ual agreement rates, however, deviated considerably from this average value—ranging from as low as 13% to a maximum of 100%. This large range together with a very large and highly significant heterogeneity statistic (Q=94182.88, p <0.001) indicates that this variation is too high to be solely attributable to chance. We can therefore assume that one or more moderator variables influenced agreement. To identify these variables, we conducted moderator analyses for all eight characteristics extracted from the primary studies. Except for one, all moderator variables extracted in this study were significant influencing factors on reported agreements rates.
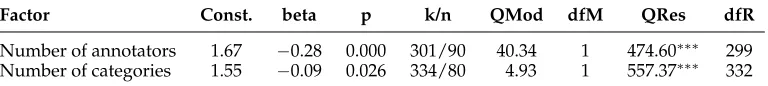
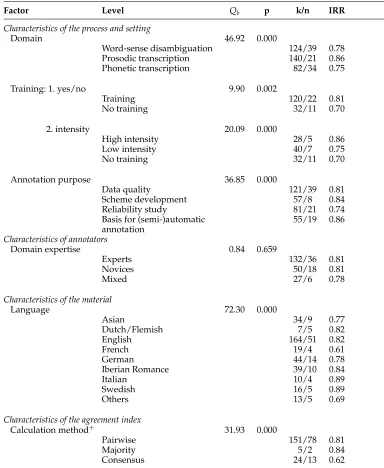
Moderator variables came in two types: count variables and categorical variables. The results of the moderator analyses for the two count variablesnumber of annotators and number of categories can be found in Table 3. Table 4 shows the results for the categorical variables. In the following sections, we describe and discuss our findings.
3.2 Characteristics of the Annotation Setting
3.2.1 Domain Differences.In the first moderator analysis, we compared the three anno-tation domains in our sample to obtain an indication of similarities in agreement rates for disparate annotation tasks. The average inter-annotator agreement for word-sense disambiguation was 78%, for prosodic transcriptions 86%, and for phonetic transcrip-tions 75%. These differences were highly significant (Qb=46.92, p<0.001). Annotation domain thus emerged as a first significant moderator for inter-annotator agreement.
[image:11.486.54.438.577.620.2]If annotation domains differ significantly in their reported agreement rates, the question arises why this is the case. We see three possible explanations: (1) coding decisions in some domains are inherently more difficult or ambiguous than in others (impact of domain-specific features), (2) factors other than the domain are responsible (impact of third variables unrelated to domains), or (3) these differences are due to systematic differences in the types of studies included in our analysis (sampling issue). A look at the complete range of agreement rates in the three domains in Figure 1 shows that all three domains contain studies at the upper end of inter-annotator agree-ment. This observation demonstrates that it is possible in all three domains to obtain high or very high agreement rates. Annotation domain therefore cannot be the sole factor responsible for the differences in average agreements. Other factors—either alone or in combination with annotation domain—must play a role.
Table 3
Results of moderator analyses for count variables (based on the complete data set).
Factor Const. beta p k/n QMod dfM QRes dfR
Number of annotators 1.67 −0.28 0.000 301/90 40.34 1 474.60∗∗∗ 299 Number of categories 1.55 −0.09 0.026 334/80 4.93 1 557.37∗∗∗ 332
Table 4
Results of moderator analyses for categorical variables (based on the complete data set).
Factor Level Qb p k/n IRR
Characteristics of the process and setting
Domain 46.92 0.000
Word-sense disambiguation 124/39 0.78 Prosodic transcription 140/21 0.86 Phonetic transcription 82/34 0.75
Training: 1. yes/no 9.90 0.002
Training 120/22 0.81 No training 32/11 0.70
2. intensity 20.09 0.000
High intensity 28/5 0.86 Low intensity 40/7 0.75 No training 32/11 0.70
Annotation purpose 36.85 0.000
Data quality 121/39 0.81 Scheme development 57/8 0.84 Reliability study 81/21 0.74 Basis for (semi-)automatic 55/19 0.86 annotation
Characteristics of annotators
Domain expertise 0.84 0.659
Experts 132/36 0.81
Novices 50/18 0.81
Mixed 27/6 0.78
Characteristics of the material
Language 72.30 0.000
Asian 34/9 0.77
Dutch/Flemish 7/5 0.82
English 164/51 0.82
French 19/4 0.61
German 44/14 0.78
Iberian Romance 39/10 0.84
Italian 10/4 0.89
Swedish 16/5 0.89
Others 13/5 0.69
Characteristics of the agreement index
Calculation method+ 31.93 0.000
Pairwise 151/78 0.81
Majority 5/2 0.84
Consensus 24/13 0.62
Figure 1
Distribution of agreement rates in the complete data set and individual domains (unweighted means).
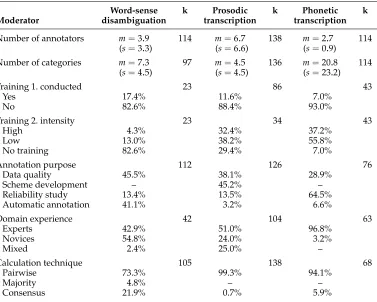
One of these factors could be systematic differences in the types of studies included in the analysis. Table 5 shows the domain characteristics for six factors extracted from the primary studies. This comparison shows some differences (e.g., in terms of average number of annotators or average number of categories in a scheme). To clarify whether these variations led to the significant differences among domains we conducted each moderator analysis twice: first for the whole data set, second for each of the three domains separately. The meta-analysis for the sub-samples will be discussed alongside the results for the complete data set.
Table 5
Comparison of study characteristics in the three domains (percentage of studies, excluding language).
Word-sense k Prosodic k Phonetic k Moderator disambiguation transcription transcription
Number of annotators m=3.9 114 m=6.7 138 m=2.7 114 (s=3.3) (s=6.6) (s=0.9)
Number of categories m=7.3 97 m=4.5 136 m=20.8 114 (s=4.5) (s=4.5) (s=23.2)
Training 1. conducted 23 86 43
Yes 17.4% 11.6% 7.0%
No 82.6% 88.4% 93.0%
Training 2. intensity 23 34 43
High 4.3% 32.4% 37.2%
Low 13.0% 38.2% 55.8%
No training 82.6% 29.4% 7.0%
Annotation purpose 112 126 76
Data quality 45.5% 38.1% 28.9% Scheme development – 45.2% – Reliability study 13.4% 13.5% 64.5% Automatic annotation 41.1% 3.2% 6.6%
Domain experience 42 104 63
Experts 42.9% 51.0% 96.8%
Novices 54.8% 24.0% 3.2%
Mixed 2.4% 25.0% –
Calculation technique 105 138 68
Pairwise 73.3% 99.3% 94.1%
Majority 4.8% – –
Consensus 21.9% 0.7% 5.9%
k = number of indices; m = mean; s = standard deviation.
effect became even more pronounced in the domain-specific analyses for word-sense disambiguation (β=−0.24, p<0.01,k=114) and prosodic transcriptions (β=−0.29, p <0.001,k=138). In the phonetic transcription domain the effect pointed in the opposite direction. The effect, however, was very weak and close to non-significance (β=0.11, p =0.09,k=82). This result is thus most likely a chance effect due to the specifics of the data set, and therefore hard to interpret in a meaningful way.4
Overall, our data suggest a clear tendency for high annotator numbers to decrease agreement. The probability for disagreements thus grows with increasing numbers of coders. This result is of immediate practical concern. If coder agreement is used as a
4 A possible explanation for these disparate findings is a systematic variation of annotator numbers employed in the domains (see Table 5). Annotations for phonetic transcriptions relied on average on 2.7 annotators (range: 2–5, median: 2.0), while word-sense disambiguation studies used on average 3.9 annotators (range: 2–17, median: 3.0) and prosodic transcriptions 6.7 annotators (range: 2–26, median: 4.0). The differences between annotator numbers across domains were statistically significant
proxy for the trustworthiness of annotations, the question arises how many annotators need to agree, to be certain that annotations are trustworthy enough. Is it acceptable if only two coders agree on the same material or is an annotation only reliable if five, six, or more coders are able to reach acceptable agreement levels?
That two coders agree more often than groups of four or more points to the fact that small groups may simply not represent the full spectrum of possible disagreements. Two annotators may well agree with each other by chance. This chance decreases, how-ever, the more annotators get involved, as with rising coder numbers the probability of biases or disparate interpretations of language material increases dramatically (Hux et al. 1997; Wiebe et al. 1998; Wiebe, Bruce, and O’Hara 1999).
The full set of possible annotations in a given setting may be described as ‘annota-tion space.’5A small group of annotators is unlikely to fully represent and explore this space of possible annotations—especially when more complex material and annotation schemes are used. Consequently, the confidence for a judgment on the trustworthiness of annotations increases with the number of coders. The higher the number of annota-tors who are able to agree, the less bias and distortion can be expected in the data and the more stable and comparable the results are likely to be. Reaching high agreement with a larger number of annotators would thus indicate a higher trustworthiness of annotations.
Assembling large coder groups can be very costly and may not always be feasible. Our suggestion is therefore to treat this issue as a contingency of the task. For tasks in which very high quality is critical, we recommend the use of larger annotator groups (e.g., five or more annotators); for less critical tasks three or four annotators might be adequate. We also suggest using larger annotator groups in early stages of a project (e.g., when developing and testing a new coding scheme) to increase the potential to discover disagreements early on (allowing a broader investigation of the annotation space).
3.2.3 Annotator Training: Realization and Intensity.With respect to annotator training we analyzed two aspects: (1) whether training had taken place and (2) the intensity of the training. Providing annotators with training had a clear positive effect on agree-ment among coders (Qb=9.90, p <0.01). Trained annotators reached on average an agreement of 81%, untrained annotators of only 70%. Taking into account the intensity of the training, our results show that high-intensity training led to significantly better agreement rates than low intensities or no training: 86% vs. 75% and 70% for the whole sample (Qb=20.09, p<0.001).
These results were replicated in two of the separate domain analyses. For phonetic transcriptions agreement rates were 78% for high training intensity, 67% for low in-tensity, and 26% for no training (p <0.01). For prosodic transcriptions high training intensity resulted in an average agreement of 93% compared with 83% in the other two categories (p<0.01). Results for the word-sense disambiguation domain were not significant. This result is most likely due to the low number of studies in the training categories (4 of the 23 indices reporting intensity).
Overall, results demonstrate a clear positive effect of annotator training on coder agreement. Our data more specifically indicate that investing in intensive training can significantly increase agreement rates.
3.2.4 Annotation Purpose.The purpose for the calculation of annotator agreement was another strong influencing factor on reported values (Qb=36.85, p<0.001). Reliability studies generally reported the lowest agreement values (avg. 74%), whereas publica-tions that used manual coding as a basis for (semi-)automatic annotapublica-tions reported the highest values (avg. 86%). As reliability studies in our sample were defined as investigations of upper and lower boundaries of manual annotation quality, and were thus frequently conducted by untrained annotators, the significantly lower agreement in these studies cannot come as a surprise. In the same regard, the importance of highly reliable data for the training of algorithms makes the average agreement in this group understandable. Values lower than 80% are generally considered too low for training sets, and will therefore not be reported. Between these two purposes lay the values for the test of newly developed annotation schemes (84%) and proof of data quality (81%). Considering domains individually, these findings were replicated for the word-sense disambiguation and phonetic transcription domains; prosodic transcriptions showed no significant differences between annotation purposes.
The fact that annotation purpose significantly influenced reported agreement sug-gests that coder agreement reported in publications cannot be taken as natural upper limits or “best possible” values achievable in an annotation project. Rather, published levels of inter-annotator agreement are more likely decided by the purpose of the project and the generally accepted standards in a community. Such standards can be implicit agreements or explicit rules. Our findings thus illustrate that (implicit or explicit) stan-dards can actively impact data quality. They may, for instance, play a significant role in determining when efforts for the improvement of agreement values are stopped. Where higher boundaries are requested, more effort is expended to meet these standards.
This underlines our introductory comments, in which we emphasized the role of external factors in shaping coder agreement even before starting the actual annotations. In this case it means that the simple fact of shared expectations for agreement levels can already impact the final annotation quality reported in publications. This does not imply that there may not be inherent or “natural” upper bounds to inter-coder agreement; merely that reported rates are impacted by the specific setting in which annotations are made.
Following the arguments made by other authors (Craggs and McGeeWood 2005; Artstein and Poesio 2008), we do not advocate the use of identical thresholds for all situations or purposes. Reliability studies, for instance, have by definition no upper bounds, and important information can also be gained from annotations with agree-ment rates lower than 80% (orkappa<0.80). A general recommendation would be to adjust the minimum level of agreement depending on the annotation purpose—as is already the practice in the computational linguistics community as indicated by our data.
The more important implication from the results is in our view that, if implicit or explicit rules within a community shape data quality, expectations of what exactly is to be regarded as acceptable or minimal agreement need to be made more explicit. The same is true for the reporting of inter-annotator agreement rates. For instance, if authors stop training their annotators because they consider 80% agreement good enough, then this fact should be made explicit to their readers.
3.3 Characteristics of the Annotators: Domain Expertise
experts and novices. For the complete sample, the expert and novice groups reached both the same average agreement (81%). For mixed groups the average agreement was slightly lower (78%). This difference was not statistically significant (Qb=0.84, p = 0.66). More domain expertise thus did not improve agreement rates. In fact, our data suggest that the selection of lay annotators can produce agreement rates as high as those from more knowledgeable annotators.
This finding was replicated in the separate analysis for prosodic transcriptions. Here, experts and non-experts also did not differ—both reached an average agreement of 87%. In this domain, however, mixed groups did significantly worse than homo-geneous groups (78%, p <0.01). For word-sense disambiguation expert annotators achieved significantly higher agreement rates than non-expert annotators (88% vs. 73%). The mixed group was only represented by one value precluding comparisons. No separate meta-analysis was conducted for phonetic transcriptions, as here all but two of the 63 entries fell in the expert category.
Results on domain expertise thus leave us with a somewhat mixed picture. The complete sample and prosodic transcription suggest that domain expertise has no direct influence on agreement rates. The considerable gap between the two average agree-ment rates for word-sense disambiguation, in contrast, illustrates that in this domain expertise is indeed an important factor for agreement. In practical terms, our findings mean two things: (1) the influence of expertise on agreement seems to differ across domains, and (2) to increase the likelihood of high agreement rates annotator groups should consist of coders with a comparable level of expertise.
Given this mixed picture, the question arises when to choose experts, and when novices. For domains such as word-sense disambiguation, in which expertise increases agreement, the greater costs in employing domain experts compared to non-experts are clearly worthwhile, if high quality annotations are needed (Kilgarriff 1999). Because of the restriction in domains in our sample we cannot predict which domains—other than the ones we investigated in this study—would particularly profit from expert annotators. Yet, given the existence of this effect, we think that further investigations would be profitable to clarify this point.
A more complex finding is that mixed groups generally resulted in lower agreement rates than homogeneous groups. Implicit in discussions of inter-annotator agreement is that coders not only agree on which unit belongs to which category, but that if they agree these decisions are also correct with respect to the phenomenon under scrutiny. Inter-annotator agreement is thus interpreted as an “estimate” of the correctness or validity of annotations (Smyth 1995). Yet, in the prosodic transcriptions domain experts and non-experts achieved comparable levels of agreement, while the average agreement for mixed groups was significantly lower. In other words, experts and novices were equally reliable, yet did not agree with each other. This leaves the question, which of the annotations are more “correct.”
as valid as expert decisions. The main implication from this finding is that choices between experts and novices should rather be a question of what interpretation is required than a question of right versus wrong. Our recommendation therefore is to select coders according to the content or purpose of the annotation. If the research question is concerned with language usage/interpretation by “naive speakers,” then a novice group should be used. If the purpose is to yield high-quality annotations in a very complex field, domain experts should be chosen. If a broad view is needed, or if authors want to increase their chance to find weaknesses in the annotation scheme and/or setting in the early stage of an annotation project, then a mix of experts and non-experts should be used.
3.3.1 Expertise versus Training. One of the main questions when choosing annotators is whether to look for experts or to provide training for less-expert coders. Although findings for training were clearer than results on expertise, solely based on our data it is not possible to say whether trained annotators generally perform systematically better or worse than expert coders. Our data demonstrate that annotator training increases consistency among coders, although—as with prosodic transcriptions—in some cases only intensive training will bring a definite improvement over untrained annotators. Yet, as past research on ratings of language proficiency suggests, training effects may not endure for long (Lumley 1995). A study by Lewis, Watterson, and Houghton (2003) on ratings of nasality points in the same direction. Comparing three groups, highly experienced and trained individuals, highly experienced individuals without training, and inexperienced but trained individuals, they found that the first two groups were more reliable than the third. Past research thus suggests that in the long-term domain expertise may be a better predictor for inter-annotator agreement than training. For more critical tasks the selection of expert annotators thus seems advisable over coder training for non-expert annotators. If expert coders are not available, our data suggest that coder training is a good way to compensate, as long as it is intensive. Because training effects fade over time, we further advise repeated checks of inter-annotator agreement and retraining of coders at regular intervals.
3.4 Characteristics of the Material: Language
Language of the material was the only characteristic of the material comparable across studies and domains. We found highly significant differences in the agreement rates of languages (Qb=72.30, p<0.001). Italian and Swedish showed the highest agreement, with 89% in both cases. The lowest agreement rates were found for Asian languages (77%), French (61%), and the “others” category (69%). Word-sense disambiguation showed similar effects as the overall sample, with the lowest agreement rate for French and the “other” category (p<0.001). For the phonetic transcription domain, the “other” category was again the weakest followed by German, Iberian Romance, and French (p <0.02). The prosodic transcription domain had too few studies to allow a valid comparison across languages.
categories for coding (Asian languages:m=11.2; others:m=12.5 compared to Italian: m=5.0 and Swedish: m=3.2). Based on these findings, we would therefore caution to infer a direct effect of language on annotator agreement. Results rather suggest that other factors such as annotation purpose, number of categories, or number of annotators play a more important role than language.6
3.5 Characteristics of the Annotation Scheme: Number of Categories
For the complete sample we found a highly significant negative relationship between categories and inter-annotator agreement (β=−0.28, p<0.001). Thus, inter-annotator agreement decreased with a rising number of categories in the coding scheme. This result was replicated for each of the three domains (word-sense disambiguation:β=
−0.29, p <0.001 after elimination of one outlier study; prosodic transcriptions: β=
−0.21, p <0.01; phonetic transcriptions:β=−0.22, p <0.05). The replication of the negative relationship found in the overall data set for all three domains points towards a general link between number of categories and inter-annotator agreement.
The main implication of this finding is that annotation schemes should be as sparse as possible, if the reliability of annotations has to be high. More categories put higher demands on annotators, both in terms of memory load (i.e., keeping all possible categories in mind) as well as their ability to differentiate between possible choices. Fine-grained schemes, in which categories differ only slightly in their mean-ing, are especially problematic (Rumshisky and Batiukova 2008). Part of the negative relationship can thus be explained by cognitive factors, in the sense that a high number of categories require more (and often finer-grained) differentiations, which tend to be harder to make. A part of the negative relationship is thus likely due to disagreements of coders on finer-grained categories or the inability to differentiate between very similar categories.
The negative relationship between number of categories and agreement may also be partly due to the statistical properties of agreement indices, which link an increasing number of categories to lower agreement. This relationship has been found for percent-ages as well as kappa (Julius and Wright 2005; Artstein and Poesio 2008). Our study cannot determine whether this statistical influence is equally or even more important than the impact of increasing cognitive demands for annotators. Qualitative studies demonstrate, however, that larger and finer-grained schemes do have an influence on annotator behavior (Krishnamurthy and Nicholls 2000; Versley 2006). We are therefore certain that at least a part of the negative relationship is attributable to the increased difficulty of more complex schemes. The practical implication of this finding is that large schemes should be avoided, if high inter-coder agreement is necessary.
3.6 Characteristics of the Agreement Index: Calculation Method
For the comparison of calculation methods we only included studies with more than two annotators. Calculation method showed a clear impact on agreement (Qb=31.93, p <0.000, k= 180). The calculation as majority or pairwise agreement yielded sys-tematically higher agreement rates than when the consensus method was used. For
the pairwise method the average agreement rate was 81% (k=151), for the majority method 84% (k=5), and the consensus method resulted in an average agreement of 62% (k=24). The significantly lower agreement using the consensus method could be replicated in the separate analyses for word-sense disambiguation (p<0.001) and phonetic transcriptions (p<0.001). In the subsample for prosodic transcriptions only one study used the consensus method. We therefore did not run a separate analysis for this domain.
When considering the implications of this result, it must be noted that the differ-ences in agreement rates are not due to actual differdiffer-ences in the underlying data. Rather the three indices represent conceptual differences in what is regarded as “agreement”. The three methods are thus not simply statistical alternatives, but represent disparate approaches to agreement. Pairwise agreement is calculated by averaging the indices obtained by comparing the annotation of one annotator with the annotation of each remaining annotator. An index obtained by consensus does not consider pairs but the whole group of annotators as the basis of calculation. Here agreement is only given if all annotators agree in their annotation of an instance. The criterion for agreement is thus much stronger in consensus than in pairwise agreement. The majority method lies between these two approaches, and can either use a more lenient stance (for instance, agreement is given if three out of five coders agree) or a more strict understanding of agreement (four out of five coders need to agree). Because the consensus method is more severe in punishing disagreement than either of the other two methods, the systematically lower agreement with this calculation method cannot be a surprise—it is simply an expression of the stronger criterion for agreement.
The significant differences among computation techniques raise the question, which of the methods is the most appropriate, and whether the same thresholds and standards across computation methods can be applied. Because results of consensus and majority votes will depend on the number of annotators in the study with a likely trend for lower coefficients in the case of more annotators, indices from different studies are often not directly comparable, and a comparison of indices derived with different calculation methods seems questionable at best. To our knowledge, no clear rule on either differen-tial thresholds or on the feasibility or preferability of one calculation method over the other exists. Our suggestion would be to treat calculation method as a contingency of the criticality of the task. In practical terms this means:
r
Because consensus methods are much more sensitive to disagreement andrequire more absolute agreements on identical items, this method seems most appropriate where reliability of data is highly critical.
r
For less critical tasks, pairwise agreement can be used.r
Sensitivity can be adjusted by changing the criterion in majority votes, thatis, the number of coders in a group that need to agree on an item.
r
The interpretation of reported agreement values must take the methodused for their calculation into account.
4. Summary of Results
In this context we investigated eight disparate factors providing information on the characteristics of the setting, annotators, material, annotation scheme, and calculation method. The following is a summary of our results:
1. Domain:Agreement rates differed significantly across domains. They were highest for the phonetic transcription domain followed by word-sense disambiguation and prosodic transcriptions.
2. Number of annotators:Inter-annotator agreement decreased with increasing number of annotators.
3. Training:Training improved inter-annotator agreement, particularly if the training intensity was high.
4. Annotation purpose:Inter-annotator agreement differed systematically across annotation purposes. It was highest for data sets intended as basis for (semi-)automatic annotations and lowest for reliability studies.
5. Domain expertise:Experts and novices reached the same level of agreement in the overall data set and the prosodic transcription domain. In
word-sense disambiguation expertise led to significantly higher agreement, indicating that the relevance of expertise differs across domains. Homogeneous groups of only experts or only non-experts achieved generally higher agreement rates than mixed groups.
6. Language of the material:We found no clear results for language. French and “others” generally yielded the lowest agreement rates, but this was probably due to other factors such as annotation purpose.
7. Number of categories:Agreement rates decreased with rising numbers of categories in a scheme.
8. Calculation method:Calculation method systematically impacted the reported agreement values. Majority and pairwise methods resulted in higher values than the consensus method.
5. Additional Recommendations and Theoretical Implications
5.1 Steps to Increase the Likelihood of Inter-Coder Agreement and Confidence in Annotations
In the presentation of our findings, we discussed two kinds of recommendations: one for increasing the likelihood of inter-coder agreement, the other for increasing the confidence in the trustworthiness of annotations.
To increase likelihood of inter-coder agreement, we suggest:
r
use few categoriesr
use annotators with the same level of domain expertiser
provide training, preferably of high intensityTo increase confidence in the trustworthiness of annotations, we suggest:
r
use larger groups of annotators (e.g., five or more for very critical tasks,r
calculate agreement as consensus rather than as pairwise or (lenient)majority agreement
5.2 Reporting of Information
Given systematic influences on agreement rates, reported agreement rates become a function of the specific context in which annotation data were collected: Although 85% agreement between two coders using four categories might not be hard to achieve, the same value for a group of six annotators using ten or more categories could be much more challenging. The same is true for agreement rates achieved by untrained or little-trained annotators versus expert or highly trained annotators, or the calculation of agreement as pairwise or consensus agreement. As discussed previously, the systematic influences of such factors as training, annotation purpose, number of categories and annotators, and so forth, demonstrate that agreement values depend on the context and the way agreement was achieved and calculated.
Unfortunately, reports of annotation studies tend to include very few specifics on the setting or procedure. For example, only 34.4% of all studies we analyzed reported information on whether training had taken place, and only about 12.5% of these studies gave any precise indication of how much training annotators received. Only slightly more than half of the studies (54.2%) reported the expert status of annotators, and 16.7% were missing information on how the agreement index was calculated. Four studies in our sample even failed to provide the number of annotators in the project. The lack of context information makes it difficult to develop a fair appreciation of the agreement in a specific study. We therefore would like to encourage a more systematic and detailed way of reporting annotation reliability. In our opinion, a minimum set of information should include:
1. Number of annotators
2. Type and amount of material annotated
3. Number of categories in the scheme
4. Criteria for selecting annotators
5. Annotators’ expert status (novices, domain experts, schema developers, native speakers, etc.)
6. Type and intensity of training
7. Type and computation of the agreement index
8. Purpose for calculating the agreement index (including whether the goal was to reach a certain threshold or achieve “highest-possible” agreement)
information across studies. A clearly defined set of labels would greatly facilitate such a comparison. We would therefore like to encourage efforts to develop such a common vocabulary for manual annotations.
5.3 Theoretical Implications: Differentiating between Agreement and Correctness Implicit in discussions of inter-annotator agreement is that coders not only agree on which unit belongs to which category, but that if they agree these decisions are also correct with respect to the phenomenon under scrutiny. Inter-annotator agreement is thus interpreted as an estimate of the correctness or validity of annotations (Smyth 1995). In our study, this assumption left us with a dilemma. Our data showed that experts and non-experts could achieve comparable levels of agreement, whereas the average agreement for mixed groups was significantly lower. In other words, experts and novices were equally reliable, yet did not agree with each other.
This dilemma points to the difficulty of distinguishing betweenannotator agreement andcorrectness of annotations. Whereas annotation studies are generally concerned about the reliability of their data, the validity of annotator decisions seems to be implied. Our finding on expert and novice coders at least warrants the question of whether reliabil-ity (measured in terms of inter-annotator agreement) can provide all the information needed to make an informed decision about overall annotation quality. Reliability can give us a fair indication of the trustworthiness of our data with respect to unsystematic variation (Hollnagel 1993), but it does not provide us with an indication of its correct-ness. We thus think that future discussions about annotation quality should be extended conceptually to include both reliability and validity considerations.
6. Limitations
Although the meta-analytic method is widely accepted as a valuable approach to syn-thesize information, our analysis also has several limitations. One of the main challenges of the meta-analytic method is that it is restricted to the information reported in its primary sources. One of the first observations coming out of our review was the general scarcity and unsystematic nature of information in annotation reports. This limited our ability to include a wider range of possible moderators in our analysis. We hope that our article encourages authors to provide more background information on the anno-tation setting and process. This will not only increase the understanding of reported agreement values, but also increase our chance to investigate additional influences and domains in the future.
are confident that these influences will not change the general picture of our results, especially given the large sample and the robust effects we found for most factors. Thus, although different agreement indices are based on slightly different concepts of agreement, the general intent and direction of indices are comparable. We would thus expect that meta-analyses for alternatives to percentage agreement will lead to very similar results. The only exception might be number of categories. Controlling for the influence of number of categories was one of the foremost reasons why kappa was invented. In consequence, for chance-corrected coefficients such as kappa a much smaller or possibly no moderator effect could emerge. Still, an increasing number of categories often also implies that categories become harder to distinguish. A part of the negative relationship between number of categories and agreement values could thus also be due to the increasing challenges in differentiating between increasingly similar categories. This effect has been demonstrated in qualitative studies (Krishnamurthy and Nicholls 2000; Versley 2006) and would not be affected by the correction for chance. Our assumption would be that, if the negative relationship can be attributed entirely to the number of categories in a scheme, a meta-analysis of chance corrected measures would find smaller or no moderator effect. If disagreements are (also) due to the inability to distinguish categories, a comparatively large negative relationship should remain. In our analysis we did not differentiate between the two factorsschema sizeandsimilarity of categories, and at present, not enough data exist to conduct comparative meta-analyses of different agreement indices on this or other factors. However, as kappa is starting to replace agreement percentages, a systematic analysis of this index and a comparison with the present findings will, we hope, become feasible.
For methodological reasons our analysis was restricted to those three annotation domains that offered sufficient data to conduct robust moderator analyses. This restric-tion raises the quesrestric-tion as to how far our results are generalizable to other domains. The important aspect to determine comparability is whether the coding problems and procedures that are typical for these three domains are also typical for linguistic an-notations in general. In other words, generalizability is given if coding problems and procedures found in the three domains in our analysis are typical for the linguistic domain our results are to be applied to. In our estimation the factors examined in this article (e.g., number of annotators, number of categories in an annotation scheme, or intensity of annotator training) are relevant for the majority of annotation tasks. We therefore argue that the results in this article are generalizable to other domains, as long as these domains do not differ more from the studies in our sample than these studies differ among themselves. Consequently, if the reader considers these three domains as typical for linguistic annotation tasks the results of the overall analysis can be seen as generic. This is particularly true if these results could be replicated within the domain-specific analyses, which had a weaker test power due to the smaller number of studies included in each analysis.
7. Conclusions